> For the complete documentation index, see [llms.txt](https://docs.powermonitor.com.br/llms.txt). Markdown versions of documentation pages are available by appending `.md` to page URLs; this page is available as [Markdown](https://docs.powermonitor.com.br/en/power-monitor/mapeamento/tamanho-de-modelos.md).
# Model Size
Track and trigger the daily capture of the real size (VertiPaq) of semantic models through the XMLA endpoint.
The **Model Size** collection connects to each semantic model through the **XMLA endpoint** and measures the real in-memory size of the model (VertiPaq storage), the same way tools such as DAX Studio do, plus technical details: total rows, compatibility level, number of partitions, use of incremental refresh and number of RLS roles. This data appears in Governance, in the Workspace X-Ray and in the performance analyses.
**How to access:** *Mapping › Models and reports › Model Size* (page title: **Model Size Capture**). Only **Administrators** can access the screen and its actions. In [Governance › Semantic Models](/en/power-monitor/governanca/modelos-semanticos.md), administrators also find, in the **Size** column, a shortcut to this screen (**View size capture execution history**).
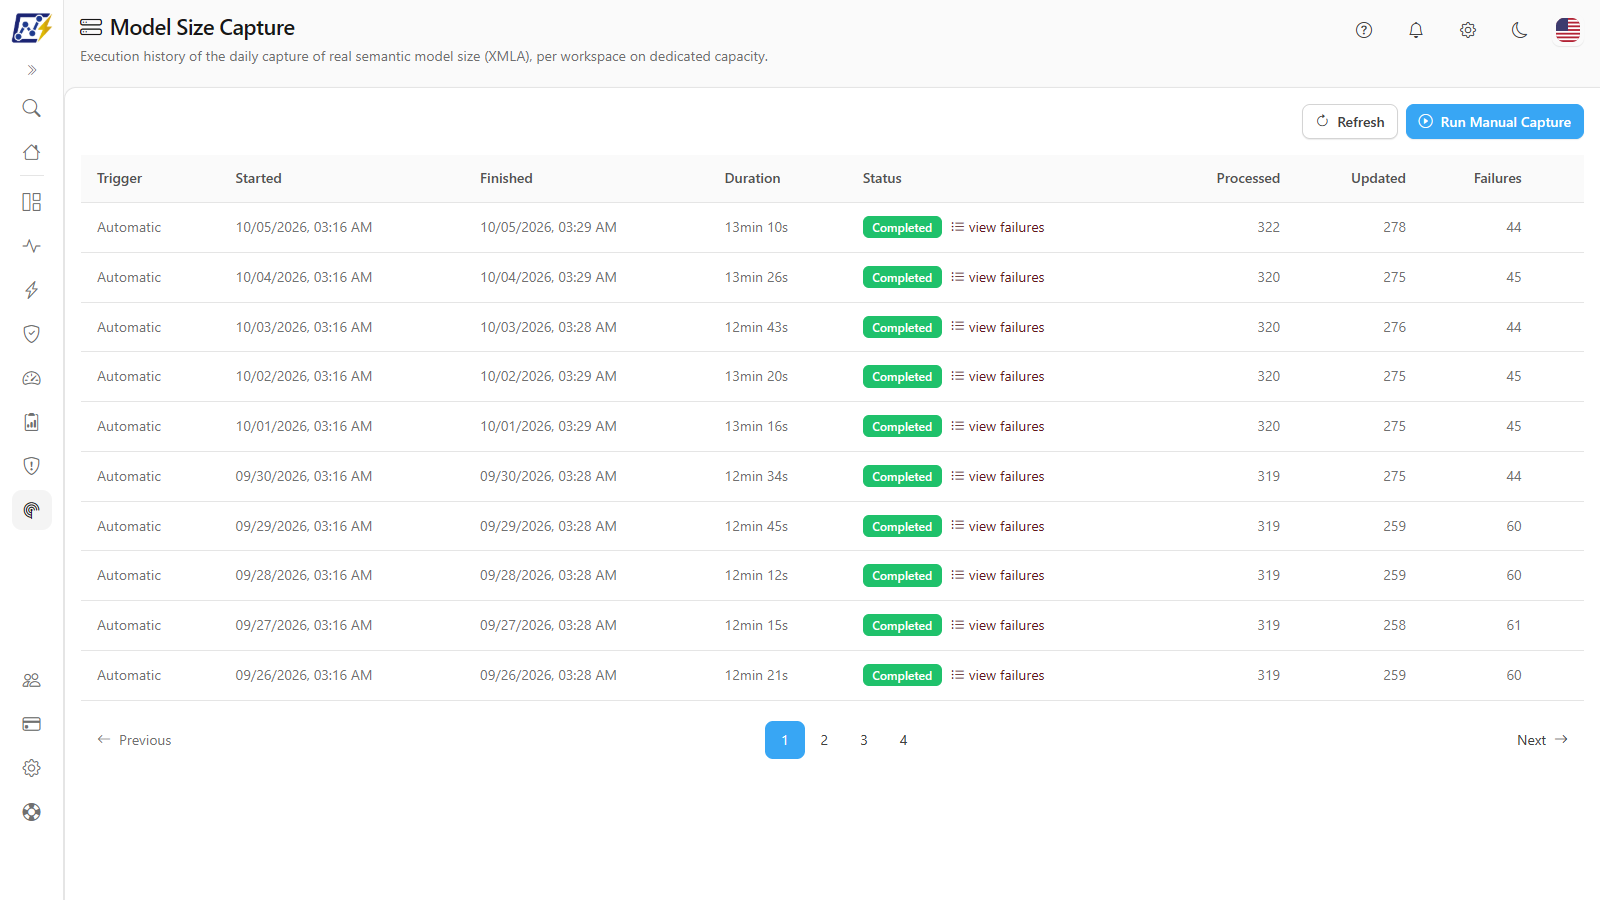
Model Size
## What it is for
* Know how much space each model actually takes, to plan capacity and identify models that need optimization.
* Check whether the daily capture ran and which models could not be measured.
* Measure again after optimizing a model, without waiting for the next execution.
## Features
The screen has five features: **Refresh**, **Run Manual Capture**, the executions table (with real-time progress), the **Stop** button and the **view failures** modal.
Screen action buttons
### Refresh
**What it is:** button that reloads the executions table.
**What it is for:** see the latest result without reloading the page, for example after the nightly automatic execution.
**How to use:** click **Refresh**. While loading, the icon turns into a spinning indicator.
**How it works / rules:** while a capture is in progress, the table already refreshes automatically.
### Run Manual Capture
**What it is:** button that triggers an immediate capture of all eligible models.
**What it is for:** measure again a model you have just optimized, or check the effect of adding the Service Principal to new workspaces, without waiting for the next daily execution.
**How to use:**
{% stepper %}
{% step %}
### Open the screen
Go to *Mapping › Models and reports › Model Size* as an **Administrator**.
{% endstep %}
{% step %}
### Trigger it
Click **Run Manual Capture**. There is no confirmation modal; the button shows **Starting...**. Possible responses:
* **Manual capture started. The history updates as it processes.**
* **There is already a capture running for this organization.**
* **This organization has no semantic models in workspaces with dedicated capacity (Fabric, Power BI Embedded, Premium, or PPU), so there is nothing to capture.**
* **Could not start the capture. Please try again.**
{% endstep %}
{% step %}
### Follow it
The **Running** row shows the "processed / total" bar, the live duration and the estimated time remaining.
{% endstep %}
{% step %}
### Check the results
When it finishes, check **Failures** and then the new size in *Governance › Semantic Models*.
{% endstep %}
{% endstepper %}
**How it works / rules:** while a capture is in progress, the button is disabled with the text **Capture running**. One capture per organization at a time.
### Executions table
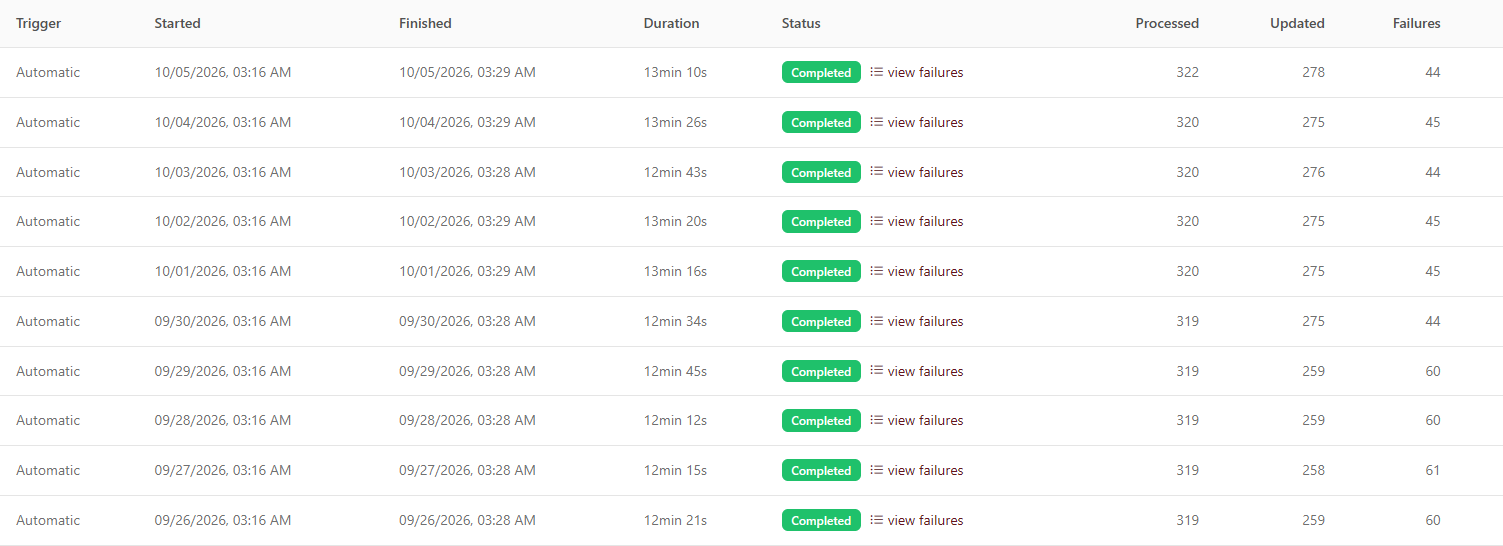
**What it is:** paginated table (10 per page by default; the **Items per page** selector in the footer lets you choose 10, 25, 50 or 100) with the capture executions, from newest to oldest.
**What it is for:** confirm that the daily capture ran, how many models were measured and how many failed.
Executions table
| Column | Content |
| ----------------------------------------- | ---------------------------------------------------------------------------------------------------------- |
| **Trigger** | **Automatic** or **Manual** |
| **Started** / **Finished** / **Duration** | Times; the duration is updated live during the execution |
| **Status** | **Running** (blue), **Completed** (green), **Failed** (red), **Canceled** (yellow), **Interrupted** (gray) |
| **Processed** | Models processed, with a progress bar and time estimate during the execution (**\~n min remaining**) |
| **Updated** | Models measured successfully |
| **Failures** | Models that could not be measured; the **view failures** link opens the detail |
{% hint style="info" %}
An execution in which some models failed ends as **Completed**; check the **Failures** column. The **Failed** status indicates a general problem (for example, the Service Principal token).
{% endhint %}
**How to use:**
1. Find the execution by the **Started** column.
2. Look at **Updated** and **Failures** to assess the capture coverage.
3. Navigate through pages with **Previous**, **Next** or the numbers below the table.
**How it works / rules:** with no executions, **No executions yet.** appears. An execution without eligible models shows **No eligible dataset for this organization.** instead of the progress bar.
### Stop a capture
**What it is:** **Stop** button that appears only on the **Running** row.
**What it is for:** interrupt a long capture triggered at an inconvenient time.
**How to use:**
1. Click **Stop** on the running row.
2. In **Stop the capture?**, confirm ("The current batch will still finish before stopping.").
3. The message **Stop request sent.** confirms it; the execution ends as **Canceled** after the current batch.
**How it works / rules:** if the capture has already finished, **There is no capture in progress to stop.** appears.
### view failures (failures modal)
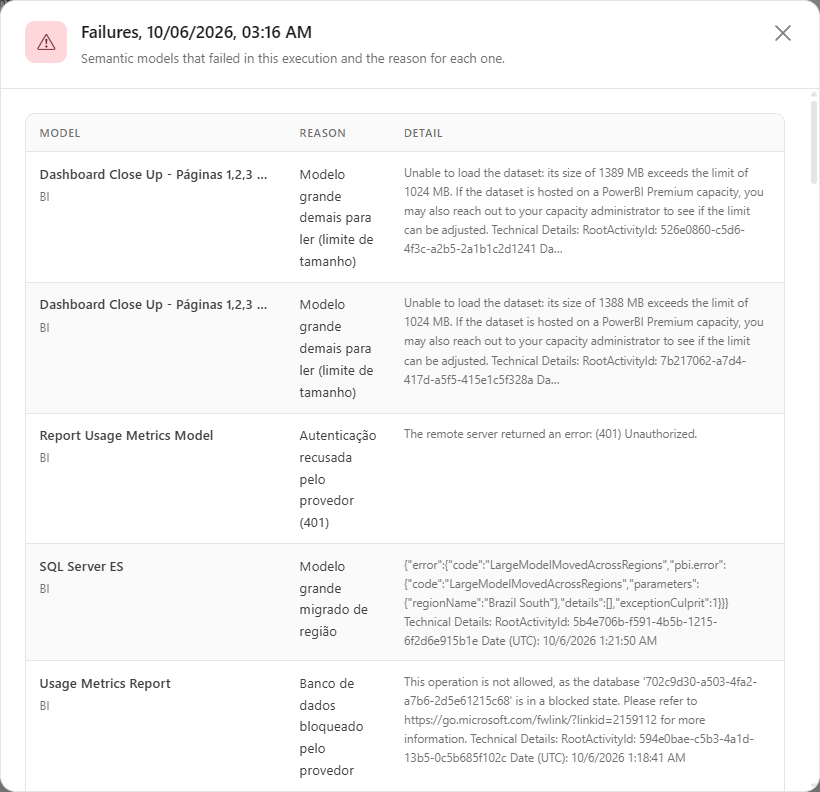
**What it is:** link in the status column that opens the **Failures, {date}** modal: "Semantic models that failed in this execution and the reason for each one", with the columns **Model** (with the workspace), **Reason** and **Detail**.
**What it is for:** find out why a model appears without a size or with an old size in Governance.
Models that could not be measured
**How to use:**
1. On the last execution, click **view failures**.
2. Find the model and read **Reason** and **Detail**.
3. Fix it according to [Common errors and how to fix them](#common-errors-and-how-to-fix-them) and trigger **Run Manual Capture**.
**How it works / rules:** when there are many failures, the end of the list shows **… and n more failure(s) not listed**.
## Rules and behavior
* **How it is measured:** XMLA connection with the Service Principal; the size is the sum of the dictionaries and segments of all columns (total VertiPaq size), and the rows are the sum of the rows of all tables.
* **Automatic frequency:** daily at **22:16** (Brasília time, UTC-3) by default. In *Settings › Monitoring › Scans and Collections*, **Enrichment** group (**Semantic Model Size**), you can turn the scan off or choose the **Frequency** **Daily**, **Weekly** or **Monthly**. With the weekly and monthly frequencies, the automatic run happens on a day distributed per organization, and the setting shows the **Next expected run** and the **Last run**. **Run Manual Capture** is not affected by the frequency and works even with the scan turned off.
* **Which models are included:** models from **monitored** workspaces that are on **dedicated capacity** (Fabric, Power BI Embedded, Premium or PPU). Left out:
* Pro / shared workspaces, which have no XMLA endpoint;
* models in **Live Connection** or **pure DirectQuery**, which have no VertiPaq storage.
* **Processing:** batches of 50 models, up to 5 connections in parallel. An execution with no sign of activity for 20 minutes is marked as **Interrupted**.
* **Workspace without access:** after the first access denial in a workspace, the remaining models of that workspace in the same batch are not attempted.
* **Last valid value is kept:** if the measurement of a model fails, Power Monitor keeps the last successfully measured size and shows the failure warning next to the value.
* **Concurrency:** one capture per organization at a time.
* **Capacity consumption:** the XMLA read is an interactive operation and uses CU from the capacity of each model read (metadata only, without querying the data). The consumption is **low to medium**, depending on the number and size of the models, and a model that was not in memory may be loaded by the connection. That is why the screen footer shows *This scan consumes Fabric capacity to update the data.*, with an **i** that explains the consumption. See [Fabric capacity consumption](/en/power-monitor/configuracoes/monitoramento.md#fabric-capacity-consumption).
### Where the data appears
* [Governance › Semantic Models](/en/power-monitor/governanca/modelos-semanticos.md): **Size** column (with the collection date and failure warning, when there is one) and the **Technical Details (VertiPaq)** section of the model detail: **Total Size**, **Total Rows**, **Compatibility Level**, **Partitions**, **Incremental Refresh** and **RLS Roles**.
* Size totals per workspace in [Governance › Workspaces](/en/power-monitor/governanca/workspaces.md) and in the [Workspace X-Ray](/en/power-monitor/qualidade-de-dados/raio-x-de-workspace.md).
* Model performance analyses.
### Required permissions
* The Service Principal must be a **member of each workspace** (there is no tenant-level XMLA access, so partial coverage is expected when it is not in all workspaces). Use **Add Service Principal** in the [Inventory](/en/power-monitor/mapeamento/inventarios.md#add-service-principal-to-workspaces).
* The capacity's XMLA endpoint must be enabled (at least **Read**) in the capacity settings, and the tenant setting that allows XMLA endpoints must be active.
## Common errors and how to fix them
| Reason | How to fix |
| ------------------------------------------------------------------------------------------------------------ | ---------------------------------------------------------------------------------------- |
| **SP without access to the workspace** / **Model not found or no permission** | Add the Service Principal as a member of the workspace. |
| **No dedicated capacity** | The workspace must be on a Fabric, Power BI Embedded, Premium or PPU capacity. |
| **Capacity is not active** | Resume the capacity (it may be paused) and capture again. |
| **No VertiPaq storage (DirectQuery/Live Connection)** | Expected behavior: these models have no in-memory size. |
| **Connection timeout** | Transient; try again later. |
| **Model too large to read (size limit)** | Capacity limitation; consider a larger capacity or optimizing the model. |
| **Authentication rejected by the provider (401)** | Check whether the XMLA endpoint is enabled on the capacity and the XMLA tenant settings. |
| **Large model migrated between regions** | Republish or restore the model in the capacity's current region. |
| **Expired data source credential** | Update the model's data source credentials in Power BI. |
| **Duplicate model name in the workspace** | Rename one of the models with the same name. |
| **Could not obtain the Service Principal token** / **AppId/AppSecret not configured for this organization.** | Review the Service Principal credentials. |
## Frequently asked questions
Why does a model appear as "Not collected"?
The model is in a workspace without dedicated capacity, is Live Connection/DirectQuery, the Service Principal is not a member of the workspace, or there has been no capture since it was published. Check **view failures** on the last execution.
Is the size shown the size of the .pbix file?
No. It is the in-memory size of the model (VertiPaq), which is what counts toward the capacity's memory limits. It is usually different from the file size.
Does the capture measure memory usage at query time?
No. The stored size of the model is measured; memory consumption during queries and refreshes is not collected by this scan.
## Related pages
* [Governance › Semantic Models](/en/power-monitor/governanca/modelos-semanticos.md)
* [Workspace X-Ray](/en/power-monitor/qualidade-de-dados/raio-x-de-workspace.md)
* [Model Mapping](/en/power-monitor/mapeamento/mapeamento-de-modelos.md)
* [Inventory](/en/power-monitor/mapeamento/inventarios.md)
---
# Agent Instructions
This documentation is published with GitBook. GitBook is the documentation platform designed so that both humans and AI agents can read, navigate, and reason over technical content effectively. Learn more at gitbook.com.
## Querying This Documentation
If you need additional information that is not directly available in this page, you can query the documentation by asking a question.
Perform an HTTP GET request on the following URL with the `ask` and `goal` query parameters:
```
GET https://docs.powermonitor.com.br/en/power-monitor/mapeamento/tamanho-de-modelos.md?ask=&goal=
```
`ask` is the immediate question: it should be specific, self-contained, and written in natural language.
`goal` is what the user is ultimately trying to achieve, the reason they need the answer. Sharing it helps GitBook give you a better, more relevant answer. A goal is most helpful when it describes the outcome the user wants rather than restating the question. For example, with `ask=how do I create an API token`, a goal like `automate deployments from our CI pipeline` lets GitBook tailor the answer to that use case.
The response will contain a direct answer to the question and relevant excerpts and sources from the documentation.
Use this mechanism when the answer is not explicitly present in the current page, you need clarification or additional context, or you want to retrieve related documentation sections.