> For the complete documentation index, see [llms.txt](https://docs.powermonitor.com.br/llms.txt). Markdown versions of documentation pages are available by appending `.md` to page URLs; this page is available as [Markdown](https://docs.powermonitor.com.br/en/power-monitor/monitoramento.md).
# Monitoring
Overview of the Power Monitor Monitoring module: capacities, consumption, data refreshes, Fabric items, Spark sessions, gateways, data source credentials, alerts and SLA report.
## Overview
The **Monitoring** module is the part of Power Monitor where you continuously track the **health**, **executions**, and **consumption** of your Microsoft Fabric and Power BI environment.
Instead of manually checking several Fabric screens or waiting for a user to report a problem, you have in one place: the state and consumption of capacities, semantic model refreshes, data freshness in tables, replication of mirrored databases, pipeline and notebook runs, gateways, and automatically generated alerts.
**How to access:** side menu **Monitoring**. The module's screens are available to all user profiles; actions that change configuration (turning on monitoring, creating monitors, reprocessing refreshes, requesting assessments) are restricted to **Administrators**. Users with visibility restricted to some workspaces see only the data of those workspaces on the screens that work with workspace items, and an administrator can block specific pages for each user (see [Users](/en/power-monitor/usuarios.md)).
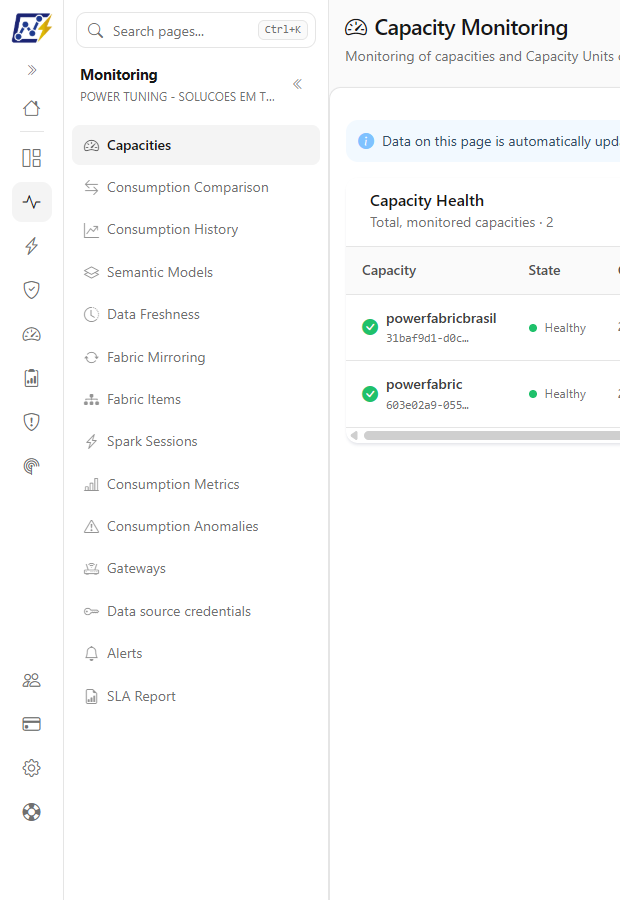
Monitoring menu with the module's areas
The menu has 14 items, in the order they appear in the side menu, each answering a different type of question:
| Area | What it answers |
| ------------------------------------------------------------------------------------------------ | ------------------------------------------------------------------------------------------------- |
| [**Capacities**](/en/power-monitor/monitoramento/capacidades.md) | What are the state and consumption of my capacities right now? |
| [**Consumption Comparison**](/en/power-monitor/monitoramento/comparativo-de-consumo.md) | What changed in consumption between two days? |
| [**Entity Comparison**](/en/power-monitor/monitoramento/comparativo-por-entidade.md) | Which of two workspaces, capacities, or items consumes more, and why? |
| [**Consumption History**](/en/power-monitor/monitoramento/historico-de-consumo.md) | How has consumption evolved over time? |
| [**Semantic Models**](/en/power-monitor/monitoramento/modelos-semanticos.md) | Are the model refreshes working? How do I reprocess the ones that failed? |
| [**Data Freshness**](/en/power-monitor/monitoramento/atualizacao-de-dados.md) | Are the model tables receiving new data within the expected time? |
| [**Fabric Mirroring**](/en/power-monitor/monitoramento/fabric-mirroring.md) | Are the mirrored databases replicating source data without delay? |
| [**Fabric Items**](/en/power-monitor/monitoramento/itens-do-microsoft-fabric.md) | Did the last run of my pipelines, Copy Jobs, notebooks and dataflows succeed? |
| [**Spark Sessions**](/en/power-monitor/monitoramento/sessoes-spark.md) | How long do Spark sessions wait in the queue, how long do they run and which items fail the most? |
| [**Consumption Metrics**](/en/power-monitor/monitoramento/metricas-de-consumo.md) | Which specific operation is consuming the capacity? |
| [**Consumption Anomalies**](/en/power-monitor/monitoramento/anomalias-de-consumo.md) *(Beta)* | Did any item or process leave the expected consumption pattern? |
| [**Gateways**](/en/power-monitor/monitoramento/gateways.md) | Are my gateways online and up to date? |
| [**Data source credentials**](/en/power-monitor/monitoramento/credenciais-de-fontes-de-dados.md) | Are the credentials of the gateway sources still valid, before refreshes start to fail? |
| [**Alerts**](/en/power-monitor/monitoramento/alertas.md) | Which incidents are open, which recurred and which have been resolved? |
| [**SLA Report**](/en/power-monitor/monitoramento/relatorio-de-sla.md) *(administrators only)* | How long did it take to acknowledge and resolve the month's incidents, and were the targets met? |
{% hint style="info" %}
The **Monitoring Dashboard** (TV view, with the summary of failures, gateways, capacities, Mirroring and Data Freshness) and **Artifact Refreshes** are in the **Dashboards** menu. See [Monitoring Dashboard](/en/power-monitor/dashboards/dashboard-de-monitoramento.md) and [Artifact Refreshes](/en/power-monitor/dashboards/atualizacoes-de-artefatos.md). The **Average Execution Time**, **Performance Assessment** and **Model Cleanup** screens are in the **Performance** menu (see [Performance](/en/power-monitor/performance.md)). The consumption screens (Capacities, Comparison, History, Metrics and Anomalies) also appear in the **Capacities** menu.
{% endhint %}
## Concepts you will come across
Some terms appear on several screens of the module.
**Capacity Units (CU)** is the processing unit consumed by a Fabric, Power BI Premium, or Embedded capacity. Every report opening, data refresh, or pipeline run consumes an amount of CU. **Capacity Units (s)** is the consumption accumulated during the execution of an operation, used in the more detailed analyses.
**Interactive consumption** is generated by user actions, such as opening a report. **Background consumption** is generated by automated processes, such as a scheduled refresh.
**Baseline** is the expected consumption behavior, used as a reference. When the observed consumption moves far away from the baseline, Power Monitor records an **anomaly**.
**Refresh** is the run that reloads the data of a semantic model. **Data freshness** is something else: it indicates whether the **content** of the tables is recent, a refresh can complete successfully and still bring old data if the source was not updated. That is why there are separate screens for [Semantic Models](/en/power-monitor/monitoramento/modelos-semanticos.md) and [Data Freshness](/en/power-monitor/monitoramento/atualizacao-de-dados.md).
**Health state** is the classification of a monitored resource at each check: **Healthy**, **Degraded**, **Unhealthy**, or **Unknown**.
**Incident** is the period during which a resource is out of the healthy state. It opens on the first failure, accumulates the **recurrences** while the problem persists, and is **resolved** when the resource returns to normal. Each incident appears as a single row on the [Alerts](/en/power-monitor/monitoramento/alertas.md) screen and generates one notification when it opens and another when it is resolved. Capacities that are unavailable or above the usage limit also receive reminders while the problem continues (see [Alerts › Notifications](/en/power-monitor/monitoramento/alertas.md#notifications)).
**Monitor** is a configuration created by an administrator to track a specific resource with its own rules, for example, which tables of a model to check, the delay tolerance, the time window, and the recipients. It is used in [Data Freshness](/en/power-monitor/monitoramento/atualizacao-de-dados.md) and [Fabric Mirroring](/en/power-monitor/monitoramento/fabric-mirroring.md).
## How monitoring is enabled
Part of the monitoring works as soon as Power Monitor is installed and the inventory is collected; another part depends on enablement or configuration done by an administrator:
| What | Where to enable or configure | Check frequency |
| ------------------------------------------------------------- | ----------------------------------------------------------------------------------------------------------------------------------------------------------------------- | ------------------------------------ |
| Semantic model refreshes | *Settings › Monitoring* › **Resource Monitoring** | Every 15 minutes |
| Fabric items (DataPipeline, CopyJob, Notebook, Dataflow Gen2) | *Settings › Monitoring* › **Resource Monitoring** | Every 2 hours |
| Gateways | *Settings › Monitoring* › **Resource Monitoring** | Every 5 minutes |
| Capacities | *Settings › Monitoring* (see [Enable Capacity Monitoring](/en/power-monitor/monitoramento/capacidades/ativar-monitoramento-de-capacidade.md)) | Every 5 minutes |
| Average execution time deviation | *Settings › Monitoring* (alert rule) and on the [Average Execution Time](/en/power-monitor/performance/tempo-medio-de-execucao.md) screen itself (items and workspaces) | Hourly |
| Table freshness | Monitors created in [Data Freshness](/en/power-monitor/monitoramento/atualizacao-de-dados.md) | According to each monitor's schedule |
| Mirrored databases | Monitors created in [Fabric Mirroring](/en/power-monitor/monitoramento/fabric-mirroring.md) | According to each monitor's schedule |
Notification channels and recipients are configured in *Settings › Notifications* and *Settings › Alerts*. See the details in [Alerts](/en/power-monitor/monitoramento/alertas.md#notifications) and in [Settings](/en/power-monitor/configuracoes.md).
## How the areas relate to each other
The areas were designed to support complete investigations, starting from a broad view and drilling down to the detail.
### How to investigate a consumption increase
{% stepper %}
{% step %}
#### Capacities
Identify which capacity has high consumption.
{% endstep %}
{% step %}
#### Consumption History
See when the increase started.
{% endstep %}
{% step %}
#### Consumption Comparison
Compare the day of the increase with an earlier reference day and see, in the top offenders, which items contributed the most.
{% endstep %}
{% step %}
#### Consumption Metrics
Drill down to the level of individual operations.
{% endstep %}
{% step %}
#### Consumption Anomalies
Confirm whether the behavior is above the baseline.
{% endstep %}
{% step %}
#### Performance Assessment
If the offender is a semantic model, request an assessment to get optimization recommendations. The screen is in *Performance › Performance Assessment*: see [Performance Assessment](/en/power-monitor/performance/avaliacao-de-performance.md).
{% endstep %}
{% endstepper %}
### How to investigate a refresh or run failure
{% stepper %}
{% step %}
#### Alerts
See which incidents are open, since when, and how many times the failure recurred.
{% endstep %}
{% step %}
#### Semantic Models or Fabric Items
Check the translated refresh error or the run state of the pipeline, notebook, or dataflow.
{% endstep %}
{% step %}
#### Gateways
Rule out or confirm connectivity problems with on-premises sources.
{% endstep %}
{% step %}
#### Semantic Models › Retry Queue
After fixing the cause, reprocess the models that failed.
{% endstep %}
{% endstepper %}
### How to investigate stale data in reports
{% stepper %}
{% step %}
#### Data Freshness
See which tables have their most recent data outside the expected time frame.
{% endstep %}
{% step %}
#### Semantic Models
Check whether the model refresh is failing or whether it completed but brought old data from the source.
{% endstep %}
{% step %}
#### Fabric Mirroring
If the source is a mirrored database, check whether replication is stopped or delayed.
{% endstep %}
{% step %}
#### Artifact Refreshes
Find other artifacts that have also stopped refreshing. The screen is in *Dashboards › Artifact Refreshes*: see [Artifact Refreshes](/en/power-monitor/dashboards/atualizacoes-de-artefatos.md).
{% endstep %}
{% endstepper %}
### How to investigate a load that became slow
{% stepper %}
{% step %}
#### Average Execution Time
Identify the items whose last run was above average and open the execution history. The screen is in *Performance › Average Execution Time*: see [Average Execution Time](/en/power-monitor/performance/tempo-medio-de-execucao.md).
{% endstep %}
{% step %}
#### Capacities and Consumption Metrics
Check whether there was contention on the capacity at the same time.
{% endstep %}
{% step %}
#### Performance Assessment
For semantic models, look for refresh, storage, and modeling recommendations in [Performance Assessment](/en/power-monitor/performance/avaliacao-de-performance.md).
{% endstep %}
{% endstepper %}
## Module areas and their features
Each area has its own page, with all the screen's features explained step by step. Below is a summary of what you will find in each one.
### Capacities
State and consumption of the monitored Fabric, Power BI Premium, and Embedded capacities.
* **Capacity Health** table, with health state, cumulative usage, interactive and background usage, 7-day trend, last measured point, and last sync.
* Automatic refresh of the list while the screen is open.
* Enabling monitoring for each capacity in [Enable Capacity Monitoring](/en/power-monitor/monitoramento/capacidades/ativar-monitoramento-de-capacidade.md).
See [Capacities](/en/power-monitor/monitoramento/capacidades.md).
### Consumption Comparison
Compares two days of your choice (Day X and Day Y).
* Capacity, workspace, and workload type filters, and ready-made comparison shortcuts.
* Change KPIs and the **Insights** card, with top offenders, improvements, and new processes.
* Workspaces, Items, Workloads, Users, and Operations dimensions, with sorting and CSV export.
See [Consumption Comparison](/en/power-monitor/monitoramento/comparativo-de-consumo.md).
### Consumption History
Evolution of Capacity Units consumption over time.
* Timeline by workspace, workload, or item, with capacity, period, workspace, and item filters.
* Period KPIs, **Biggest movers**, and **Consumption concentration**.
* **Lane detail** for an entity, CSV export, and AI explanation.
See [Consumption History](/en/power-monitor/monitoramento/historico-de-consumo.md).
### Semantic Models
History of semantic model refreshes.
* Day status banner, total cards, period, filters, and refreshes table.
* Incident details panel, with the translated error.
* **Retry Queue** to reprocess failed refreshes in bulk, and access to the refresh schedules.
See [Semantic Models](/en/power-monitor/monitoramento/modelos-semanticos.md).
### Data Freshness
Monitors that check the most recent value of a date column in chosen tables and notify you when the data falls behind beyond the tolerance.
* **New monitor** wizard (model, tables, column, tolerance, schedule, recipients, and resend).
* Immediate check, result of the last check, immediate alert sending, and enabling or disabling each monitor.
* Permission diagnostics to fix access failures.
See [Data Freshness](/en/power-monitor/monitoramento/atualizacao-de-dados.md).
### Fabric Mirroring
Monitors that track mirrored databases and each replicated table.
* Creating, editing, enabling, deleting, and immediately checking mirroring monitors.
* **Mirroring sync status** modal, with the database status and the delay of each table.
* Alerts when mirroring stops, fails, or falls behind.
See [Fabric Mirroring](/en/power-monitor/monitoramento/fabric-mirroring.md).
### Fabric Items
Health state of the last run of each DataPipeline, CopyJob, Notebook, and Dataflow Gen2.
* Total cards (healthy, degraded, unhealthy, and open incidents).
* Type and state filters, search by name, and a paginated table with the last incident duration.
See [Fabric Items](/en/power-monitor/monitoramento/itens-do-microsoft-fabric.md).
### Spark Sessions
Queue time, run time and failures of the Spark sessions of Lakehouses, Notebooks and Spark Job Definitions.
* Period selector and **Sessions**, **Failure rate**, **Queue time** and **Run time** cards (median P50 and P90).
* **Failure rate per day** chart, **Items that run the most** and **Items with the most failures** rankings, and a sessions table with filters.
* Sessions are collected every 6 hours and kept for 90 days.
See [Spark Sessions](/en/power-monitor/monitoramento/sessoes-spark.md).
### Consumption Metrics
The most granular view of consumption: each individual operation.
* Date selector, KPIs, and **Metrics Detail** table (user, item, capacity, Capacity Units (s), duration, and status).
* **Reload today + 7 days**, for administrators.
See [Consumption Metrics](/en/power-monitor/monitoramento/metricas-de-consumo.md).
### Consumption Anomalies
Consumption behaviors that deviate significantly from the baseline.
* **Anomalies** tab: summary by severity, filters, per-operation detail, and AI explanation.
* **New Items** tab (items in quarantine), **Settings** tab (notifications and detection sensitivity), and **Reprocessing** tab.
See [Consumption Anomalies](/en/power-monitor/monitoramento/anomalias-de-consumo.md).
### Gateways
Availability of data gateways.
* Summary cards (total, online, offline, and open incidents) and the **Gateway Status** list, with last check and incident duration.
* Enabling monitoring in [Enable Gateway Monitoring](/en/power-monitor/monitoramento/gateways/ativar-monitoramento-de-gateways.md).
See [Gateways](/en/power-monitor/monitoramento/gateways.md).
### Data source credentials
Health of the credentials of the gateway data sources, so you can fix them before model refreshes start to fail.
* **Data sources**, **Valid credentials**, **Failing credentials**, **Not verifiable** and **Last check** cards.
* Table with the status of each source (**Valid**, **Failing** or **Unknown**), filters and an **Open alerts** shortcut.
* Check every 6 hours and a **Check now** button (administrators).
See [Data source credentials](/en/power-monitor/monitoramento/credenciais-de-fontes-de-dados.md).
### Alerts
Incident center of the environment.
* Two tabs: **Overview**, with the incident summary and the **Operations metrics** (MTTA, MTTR and recurrence), and **Alert List**.
* Alert list with **Open**, **Recurrence**, **Resolved** and **Data unavailable** statuses, with filters by period, status, resource type, severity, workspace and capacity, and search.
* Operation actions: **Acknowledge**, **Assign alert**, **Comment** and alert silencing; administrators define silencing and escalation rules.
* **Incident failures** modal, with each occurrence, and the **Investigate** (AI) action in the actions menu.
See [Alerts](/en/power-monitor/monitoramento/alertas.md).
### SLA Report
Incidents, response times and capacity availability over a month, for accountability (administrators only).
* **Report month** selector and **Incidents**, **Response times** (MTTA and MTTR) and **Target compliance** cards.
* **Incidents by type**, **Noisiest sources** and **Capacity availability** sections.
* Editable **SLA targets**, **Export CSV** and e-mailed **Scheduled reports** (weekly executive summary and monthly SLA), with a test send.
See [SLA Report](/en/power-monitor/monitoramento/relatorio-de-sla.md).
---
# Agent Instructions
This documentation is published with GitBook. GitBook is the documentation platform designed so that both humans and AI agents can read, navigate, and reason over technical content effectively. Learn more at gitbook.com.
## Querying This Documentation
If you need additional information that is not directly available in this page, you can query the documentation by asking a question.
Perform an HTTP GET request on the following URL with the `ask` and `goal` query parameters:
```
GET https://docs.powermonitor.com.br/en/power-monitor/monitoramento.md?ask=&goal=
```
`ask` is the immediate question: it should be specific, self-contained, and written in natural language.
`goal` is what the user is ultimately trying to achieve, the reason they need the answer. Sharing it helps GitBook give you a better, more relevant answer. A goal is most helpful when it describes the outcome the user wants rather than restating the question. For example, with `ask=how do I create an API token`, a goal like `automate deployments from our CI pipeline` lets GitBook tailor the answer to that use case.
The response will contain a direct answer to the question and relevant excerpts and sources from the documentation.
Use this mechanism when the answer is not explicitly present in the current page, you need clarification or additional context, or you want to retrieve related documentation sections.