> For the complete documentation index, see [llms.txt](https://docs.powermonitor.com.br/llms.txt). Markdown versions of documentation pages are available by appending `.md` to page URLs; this page is available as [Markdown](https://docs.powermonitor.com.br/en/power-monitor/monitoramento/alertas.md).

# Alerts

Power Monitor's incident center: what opened, what reoccurred and what was resolved, with acknowledgement, assignment, comments, silencing, escalation and operations metrics (MTTA and MTTR).

The **Alerts** screen brings together, in one place, the incidents detected by Power Monitor's continuous monitoring: gateways that are down, capacities that are unavailable or under high usage, failed semantic model refreshes, Fabric item runs with errors, mirrored databases (Mirroring) that are stopped or delayed, tables with outdated data and data source credentials with problems.

Each incident appears as **a single row**, which is created with the **Open** status, accumulates the **reoccurrences** while the problem persists and changes to **Resolved** when the resource becomes healthy again. Besides following the incident, the team can **acknowledge it**, **assign it** to someone, **comment**, **silence it** temporarily and measure the response time (MTTA and MTTR).

**How to access:** *Monitoring › Alerts*. The screen is available to all user profiles (some actions are exclusive to Administrators and are indicated throughout the page). Users with visibility restricted to some workspaces see only the alerts of those workspaces, plus the alerts that do not belong to a specific workspace (such as gateways and capacities).

The screen has **two tabs**, which can be opened directly from the address (the `?tab=` parameter):

| Tab                    | What it shows                                                                                                                |
| ---------------------- | ---------------------------------------------------------------------------------------------------------------------------- |
| **Overview** (default) | Failure cards, totals of open incidents and the **Operations metrics** card (MTTA, MTTR, reoccurrence and noisiest sources). |
| **Alert List**         | The incident table with filters, bulk selection, action menu, details and the failures modal.                                |

The list tab shows, next to its name, a badge with the number of open incidents. When you arrive at the screen through a link with a filter (for example, the **View alerts** shortcut of [Data source credentials](/en/power-monitor/monitoramento/credenciais-de-fontes-de-dados.md)), the **Alert List** tab opens directly, already filtered.

<figure><picture><source srcset="/files/9c3yxfyawfzsBo2Td5hQ" media="(prefers-color-scheme: dark)"><img src="https://3938213054-files.gitbook.io/~/files/v0/b/gitbook-x-prod.appspot.com/o/spaces%2FH2bFRBmIfyK3kwVKbldl%2Fuploads%2Fgit-blob-16ed6bd34da0bd52399b29777374219b93143417%2Fpm-monitoramento-alertas-visao-geral-en.png?alt=media" alt="Alerts Overview tab with the failure cards, the totals and the Operations metrics card"></picture><figcaption><p>Overview tab: failure cards, totals and operations metrics</p></figcaption></figure>

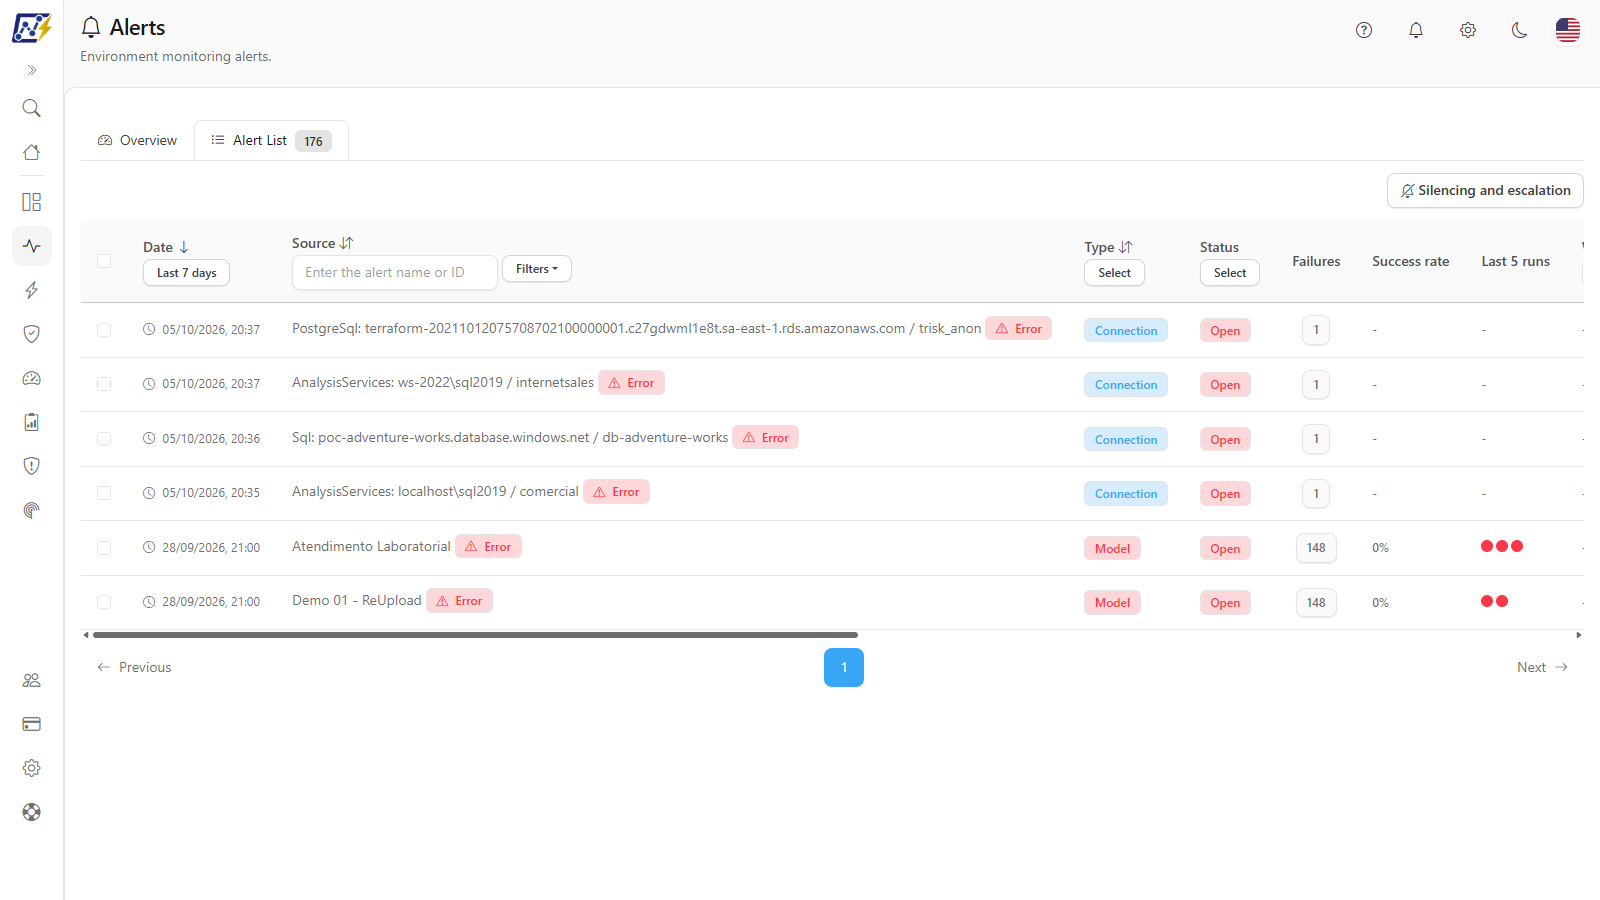
<figure><picture><source srcset="/files/FVAFgmTaiZ9ED4UFX1O0" media="(prefers-color-scheme: dark)"><img src="https://3938213054-files.gitbook.io/~/files/v0/b/gitbook-x-prod.appspot.com/o/spaces%2FH2bFRBmIfyK3kwVKbldl%2Fuploads%2Fgit-blob-8175b7c421ca784d98ec87203dbc8e5a5e31b793%2Fpm-monitoramento-alertas-lista-en.png?alt=media" alt="Alert List tab with the incident table and the filters in the column headers"></picture><figcaption><p>Alert List tab: incident table with filters</p></figcaption></figure>

## What it is for

* **Answer "is everything fine now?"**: the cards on the **Overview** tab show how many new failures appeared in the last hour, today and yesterday, and how many incidents are still open.
* **Investigate an incident**: see when it opened, how many times the failure repeated, what error message Power BI or Fabric returned on each occurrence and, if AI is configured, request an analysis with **Investigate**.
* **Organize the response**: acknowledge the incident ("I'm looking at it"), assign it to someone, record comments and silence an item that is under maintenance.
* **Measure operations**: follow the mean time to acknowledge (MTTA) and to resolve (MTTR), the reoccurrence and the sources that generate the most incidents.
* **Audit what happened**: for example, check in the morning everything that opened and was resolved overnight, filtering by the **Resolved** status and by period.
* **Correlate problems**: filter by capacity or workspace to check whether several failures have a common cause. When the relationship is unambiguous, Power Monitor itself already correlates the incidents (see [Correlation of incidents](#correlation-of-incidents)).

## Overview tab

### Failure cards (last hour, today and yesterday)

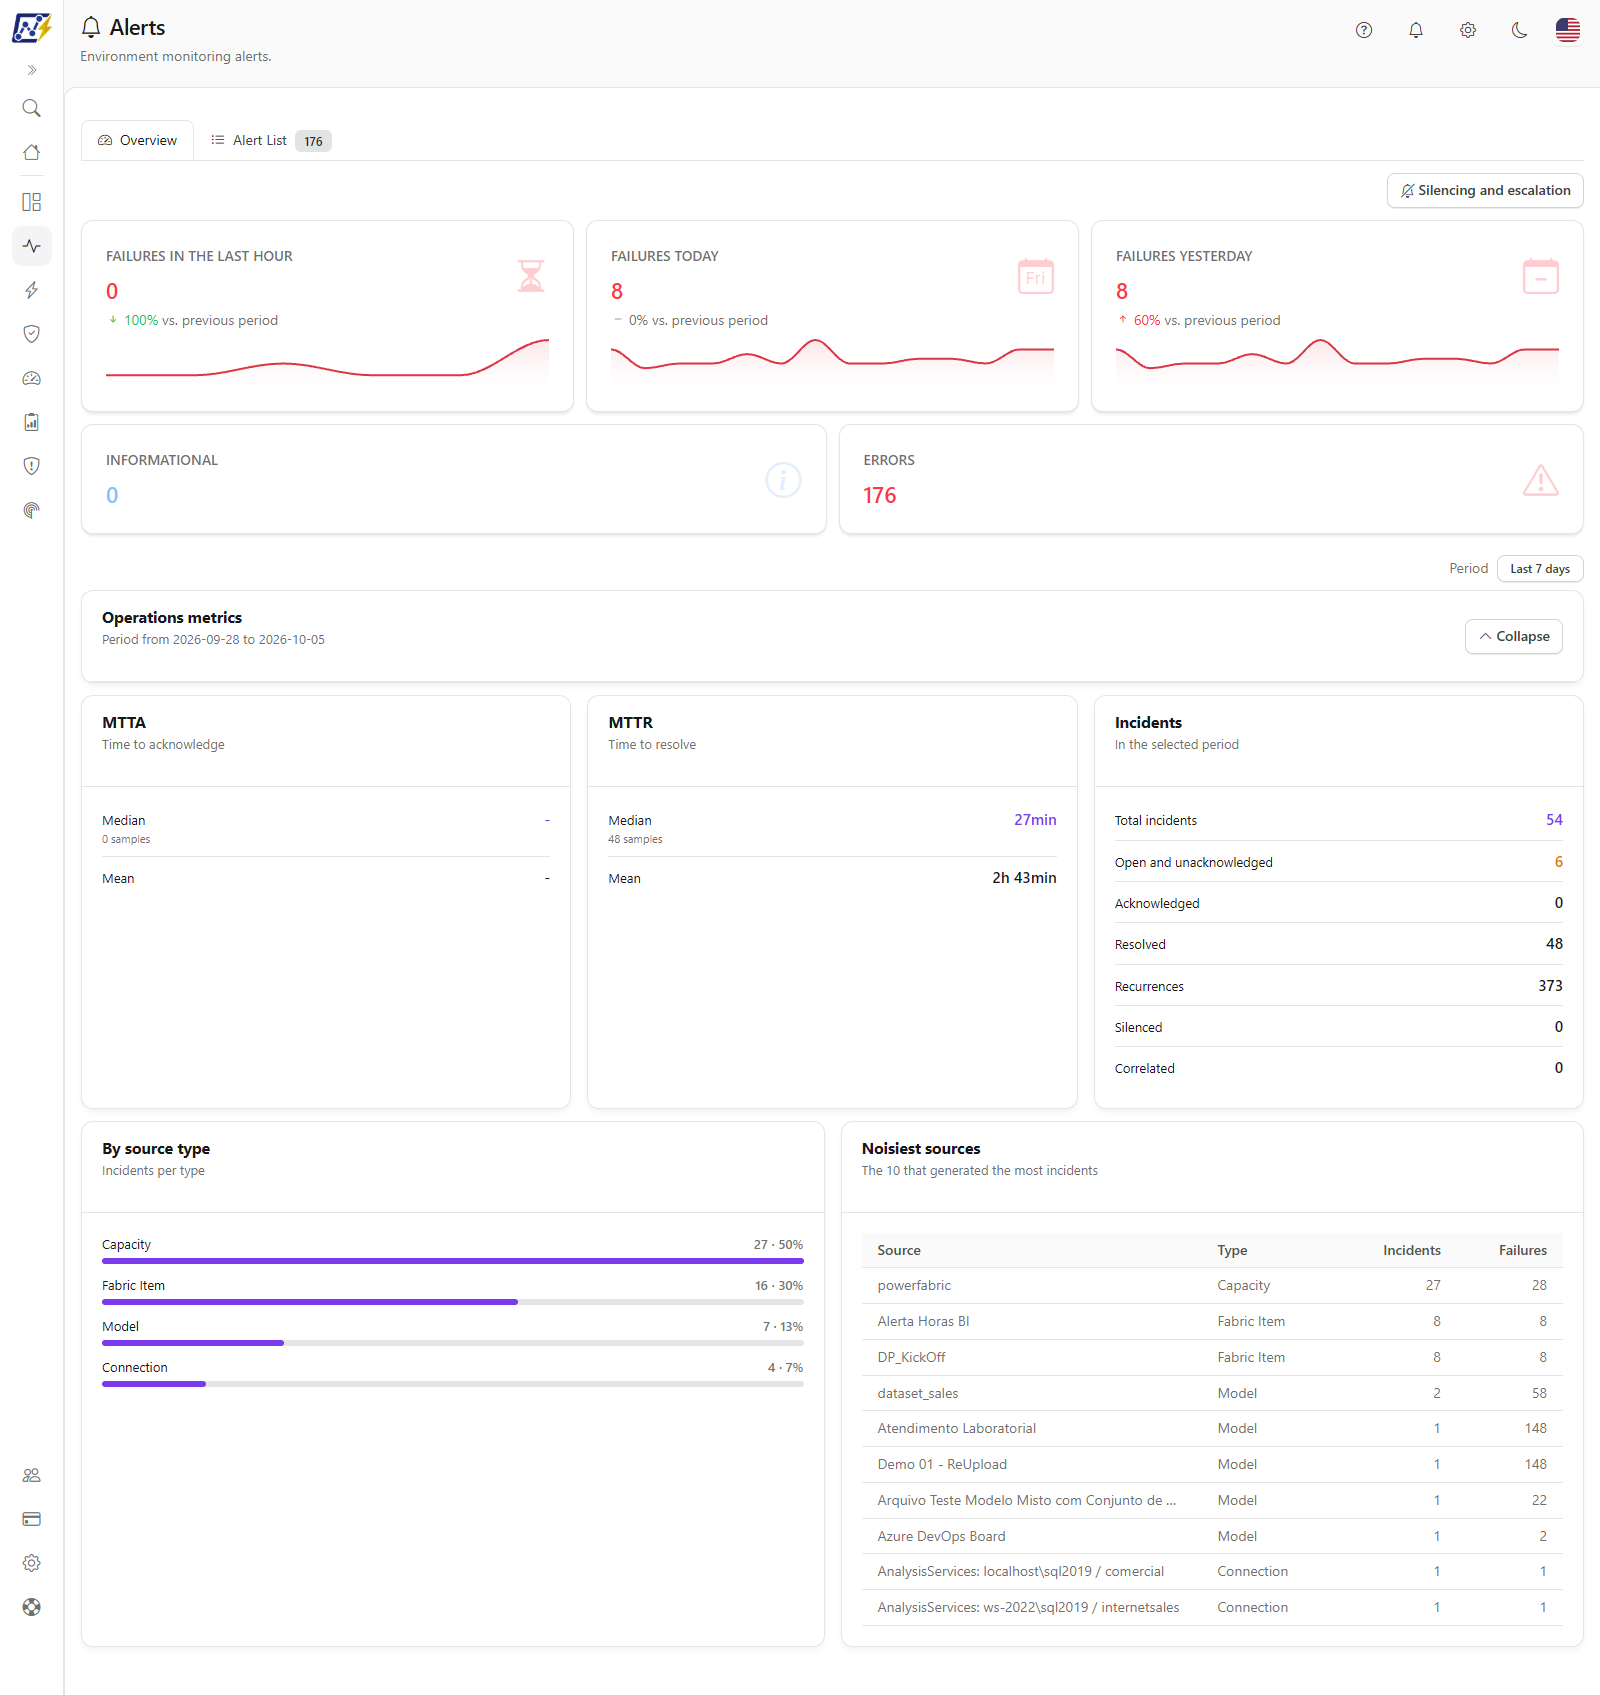
**What it is.** Three cards at the top of the screen, **Failures in the Last Hour**, **Failures Today** and **Failures Yesterday**, with the number of error incidents that opened in each period, the change compared with the previous period and a trend sparkline.

**What it is for.** Answering in seconds whether the environment got worse or better, without having to filter the list. It is the first reading of the day or during an on-call shift.

<figure><picture><source srcset="/files/XV17KJmuTzyRMWfAlAKV" media="(prefers-color-scheme: dark)"><img src="https://3938213054-files.gitbook.io/~/files/v0/b/gitbook-x-prod.appspot.com/o/spaces%2FH2bFRBmIfyK3kwVKbldl%2Fuploads%2Fgit-blob-334951f52d2ab494f660491c10f41ddba491dd66%2Fpm-monitoramento-alertas-cards-falhas-en.png?alt=media" alt="Cards Failures in the Last Hour, Failures Today and Failures Yesterday with change and sparkline"></picture><figcaption><p>Failure cards with comparison to the previous period</p></figcaption></figure>

**How to use**

1. Go to *Monitoring › Alerts* (the **Overview** tab opens by default).
2. Read the big number on each card: it is the number of error incidents that **opened** in the period.
3. Read the indicator below the number: an arrow up in **red** means more failures than in the previous period; an arrow down in **green**, fewer failures; a neutral dash, the same amount. When the previous period had no failures, the card shows **New** instead of a percentage.
4. Use the sparkline to see the trend: on the **Failures in the Last Hour** card it covers the last 24 hours; on the **Failures Today** and **Failures Yesterday** cards, the last 14 days.

**How it works**

| Card                          | What it counts                                                                                       | Comparison                        |
| ----------------------------- | ---------------------------------------------------------------------------------------------------- | --------------------------------- |
| **Failures in the Last Hour** | Incidents with error severity that opened in the current hour (from minute :00 of the current hour). | Against the previous hour.        |
| **Failures Today**            | Incidents with error severity that opened today.                                                     | Against yesterday.                |
| **Failures Yesterday**        | Incidents with error severity that opened yesterday.                                                 | Against the day before yesterday. |

* Each incident is counted **only once**, in the period in which it opened. Reoccurrences of the same incident do not inflate the numbers. An incident that has already been resolved keeps counting in the period in which it opened.
* The cards are a **snapshot of the environment** (within your access scope) and do not change with the period or with the list filters.

{% hint style="info" %}
"Today" and "yesterday" follow the **organization's time zone**, not UTC. This way the cards and the charts agree on what "today" is even close to midnight.
{% endhint %}

### Informational and Errors totals

**What it is.** Two totals right below the failure cards, with how many incidents are **open right now**, separated by severity.

**What it is for.** Knowing the size of the current "backlog": how many problems are still unresolved, regardless of when they opened. Each card is also a **shortcut**: when you click **Informational** or **Errors**, the **Alert List** tab opens already filtered by that severity.

<figure><picture><source srcset="/files/WxdvdSuwQscD3vfre0C5" media="(prefers-color-scheme: dark)"><img src="https://3938213054-files.gitbook.io/~/files/v0/b/gitbook-x-prod.appspot.com/o/spaces%2FH2bFRBmIfyK3kwVKbldl%2Fuploads%2Fgit-blob-597be971673f4b487bec68fb36eccab3eb6a89cb%2Fpm-monitoramento-alertas-totalizadores-en.png?alt=media" alt="Informational and Errors totals with the number of open incidents"></picture><figcaption><p>Totals of open incidents by severity</p></figcaption></figure>

**How to use**

1. Read **Informational** (in blue) for the informational alerts not yet resolved.
2. Read **Errors** (in red) for the error incidents not yet resolved.
3. Click the card to see which ones they are, on the **Alert List** tab.

**How it works.** Like the failure cards, these numbers represent the current state of the environment and **do not change** with the period or with the list filters.

### Operations metrics (MTTA, MTTR and reoccurrence)

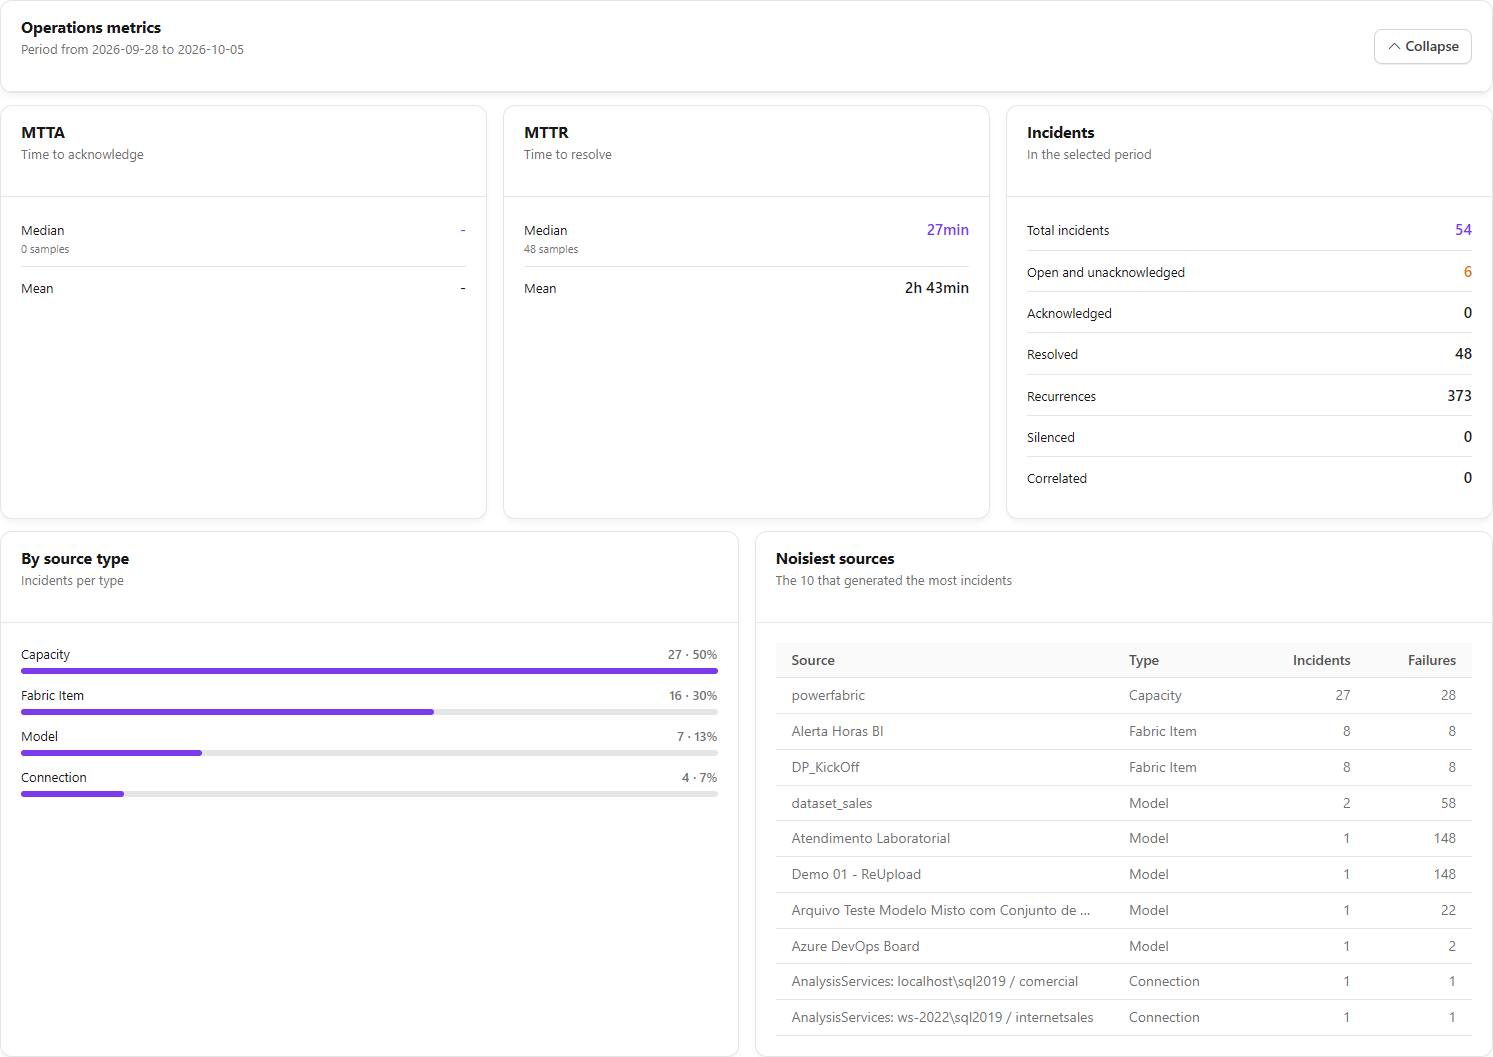
**What it is.** The **Operations metrics** card, on the **Overview** tab, which summarizes how the team is handling incidents in the period chosen in the **Period** selector above it (the same period used in the **Date** column of the list). The card can be collapsed with the **Collapse** button (and reopened with **Show**); while collapsed, it queries nothing.

**What it is for.** Measuring the quality of the response (speed to acknowledge and resolve), seeing the reoccurrence and finding out which sources generate the most noise, so you can treat the cause instead of just putting out fires.

<figure><picture><source srcset="/files/QoDtU0yZFikTfuefi3Vz" media="(prefers-color-scheme: dark)"><img src="https://3938213054-files.gitbook.io/~/files/v0/b/gitbook-x-prod.appspot.com/o/spaces%2FH2bFRBmIfyK3kwVKbldl%2Fuploads%2Fgit-blob-1b5aa21e0263ee395250e974a326bfa244b79190%2Fpm-monitoramento-alertas-metricas-operacao-en.png?alt=media" alt="Operations metrics card with MTTA, MTTR, incidents, incidents by source type and noisiest sources"></picture><figcaption><p>Operations metrics of the selected period</p></figcaption></figure>

**How it works**

| Block                          | What it shows                                                                                                                                  |
| ------------------------------ | ---------------------------------------------------------------------------------------------------------------------------------------------- |
| **MTTA** (Time to acknowledge) | **Median** and **Mean** of the time between the incident opening and its acknowledgement, with the number of samples (acknowledged incidents). |
| **MTTR** (Time to resolve)     | **Median** and **Mean** of the time between opening and resolution, with the number of samples (resolved incidents).                           |
| **Incidents**                  | **Total incidents**, **Open and unacknowledged**, **Acknowledged**, **Resolved**, **Recurrences**, **Silenced** and **Correlated**.            |
| **By source type**             | Number of incidents per type (Gateway, Capacity, Model and so on), in proportional bars.                                                       |
| **Noisiest sources**           | The 10 sources that generated the most incidents, with the columns **Source**, **Type**, **Incidents** and **Failures**.                       |

* **MTTA** is the time between the incident opening and its **first** acknowledgement (acknowledged incidents only); **MTTR** is the time between opening and resolution (resolved incidents only). The **median** is the main number and the **mean** the secondary one. **Recurrences** adds up the repetitions of each incident (the failure counter minus the opening). In **Noisiest sources**, **Failures** adds up the failure counters of the source's incidents and the ranking sorts by incidents and, on ties, by failures.
* Times are shown as seconds, minutes or hours and minutes (for example, `42min` or `3h 20min`). Without samples, "-" appears.
* The period can be at most 366 days. If there are more incidents than the calculation limit, the card warns that the numbers cover only part of the period.

## Alert List tab

The list filters are applied automatically, with no confirm button: when you change a field, the list reloads and goes back to the first page. The failure cards and the totals of the **Overview** do **not** change with the filters.

### Period

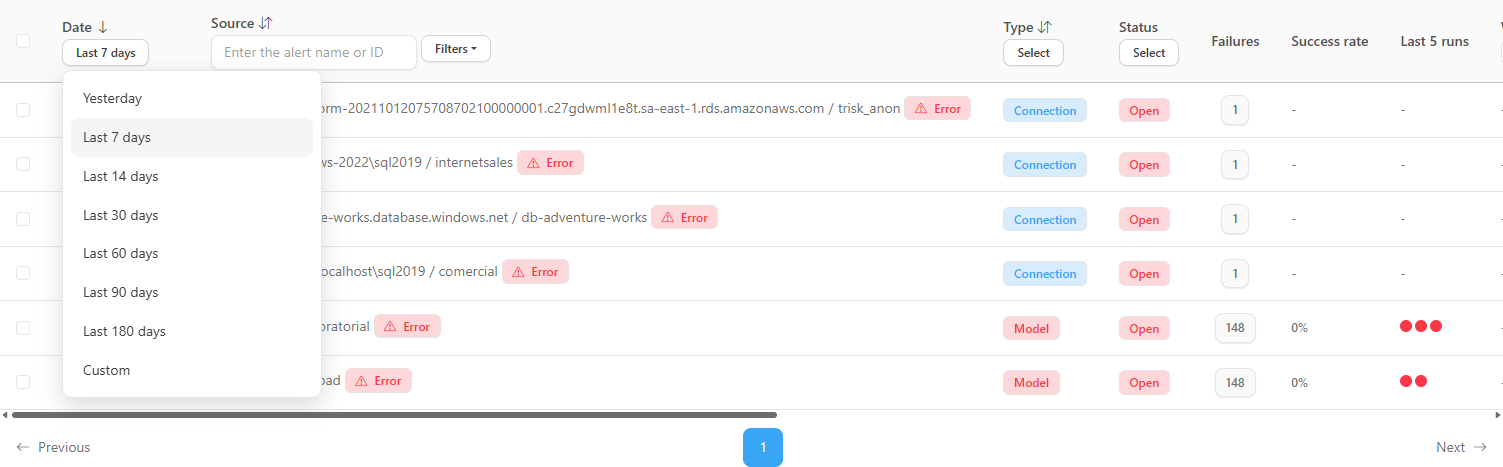
**What it is.** A button in the header of the **Date** column (and, on mobile, at the top of the list) that opens the ready-made periods: **Yesterday**, **Last 7 days**, **Last 14 days**, **Last 30 days**, **Last 60 days**, **Last 90 days**, **Last 180 days** and **Custom** (with the **From** and **To** dates).

**What it is for.** Restricting the list to an interval, for example the previous month for an audit.

<figure><picture><source srcset="/files/cScBOpbK5VhFcxEPvMEN" media="(prefers-color-scheme: dark)"><img src="https://3938213054-files.gitbook.io/~/files/v0/b/gitbook-x-prod.appspot.com/o/spaces%2FH2bFRBmIfyK3kwVKbldl%2Fuploads%2Fgit-blob-cac315bdeb5a2f6ac882ed0a8326b5210263df67%2Fpm-monitoramento-alertas-filtro-periodo-en.png?alt=media" alt="Menu of ready-made periods opened from the Date column header"></picture><figcaption><p>Period selector of the alert list</p></figcaption></figure>

**How to use**

1. Click the period button (by default, **Last 7 days**) and choose an option.
2. For your own interval, choose **Custom** and enter the dates.
3. The list reloads automatically.

**How it works**

* The chosen period is **shared** between the two tabs: the **Overview** metrics use the same range as the list.
* The dates correspond to the calendar days of your browser.
* When you change the period, the list is sorted from the **oldest to the newest** date. To see the most recent first, click the **Date** column title until the arrow points down.

### List columns and filters

**What it is.** The table with the alerts of the chosen period and filters. Each incident appears as a row, with the affected resource, the type, the status, the failure counter, the success rate, the workspace, the capacity and the message.

**What it is for.** Investigating incidents: what is open, when it opened, in which workspace or capacity and what error Power BI or Fabric returned.

**How to use**

1. Go through the rows: the default view shows the **Open** incidents of the last 7 days, from the most recent to the oldest.
2. Use the filters in each column header to refine (described in the following sections).
3. Use the pagination below the table to move forward or back; the **Items per page** selector offers 10, 25, 50 or 100 rows (the default is 10). When no alert matches the filters, the screen shows **No alerts found.**

**How it works**

| Column           | What it shows                                                                                                                                                                                                                              | Header filter                                                        |
| ---------------- | ------------------------------------------------------------------------------------------------------------------------------------------------------------------------------------------------------------------------------------------ | -------------------------------------------------------------------- |
| Checkbox         | Selects incidents not yet resolved for bulk actions.                                                                                                                                                                                       | The header checkbox selects all open alerts on the page.             |
| **Date**         | Date and time when the alert was recorded.                                                                                                                                                                                                 | Period selector.                                                     |
| **Source**       | Name of the affected resource (gateway, capacity, model, item and so on), a severity badge (**Error** or **Informative**) and operational workflow badges (see [Badges of the operational workflow](#badges-of-the-operational-workflow)). | Text field (alert name or ID) and **Filters** menu (severity).       |
| **Type**         | Resource category: **Gateway**, **Capacity**, **Integration**, **Connection**, **Model**, **Fabric Item**, **Mirroring** or **Data Freshness**.                                                                                            | Multiple selection.                                                  |
| **Status**       | **Open**, **Reoccurred**, **Resolved** or **Data unavailable**.                                                                                                                                                                            | Multiple selection. When the screen opens, only **Open** is checked. |
| **Failures**     | How many times the failure occurred within the incident (the opening plus each reoccurrence). Appears only on rows with the **Open** status.                                                                                               | -                                                                    |
| **Success rate** | Percentage of runs completed successfully in the last days, for alerts of items that have a run history (the tooltip gives the window and the total number of runs).                                                                       | -                                                                    |
| **Last 5 runs**  | Colored squares with the result of the resource's last 5 runs.                                                                                                                                                                             | -                                                                    |
| **Workspace**    | The resource's workspace, when there is one. Gateways and capacities do not belong to a workspace and show "-".                                                                                                                            | List with the organization's workspaces.                             |
| **Capacity**     | Related capacity, when there is one.                                                                                                                                                                                                       | List with the organization's capacities.                             |
| **Message**      | Technical description of the alert. For semantic models and Fabric items, it includes the **error code** and the message returned by Microsoft.                                                                                            | Text field (partial search).                                         |

### Severity badge and alert status

**What it is.** Two badges on each row: in the **Source** column, the severity badge (**Error**, in red, or **Informative**, in blue); in the **Status** column, the badge of the incident situation (**Open**, **Reoccurred**, **Resolved** or **Data unavailable**).

**What it is for.** Telling at a glance what is a failure and what is a notice, and what is still in progress and what has already been closed.

<figure><picture><source srcset="/files/VkC95LtoaCfSumFJ3tjL" media="(prefers-color-scheme: dark)"><img src="https://3938213054-files.gitbook.io/~/files/v0/b/gitbook-x-prod.appspot.com/o/spaces%2FH2bFRBmIfyK3kwVKbldl%2Fuploads%2Fgit-blob-ae1adc4c3e004ad6994900eb5322a2f976ac8d4b%2Fpm-monitoramento-alertas-selo-severidade-en.png?alt=media" alt="Tooltip with the alert message shown when hovering over the severity badge"></picture><figcaption><p>Alert message shown over the severity badge</p></figcaption></figure>

**How to use**

1. Hover over the **Error** or **Informative** badge in the **Source** column to see the alert message without scrolling to the **Message** column.
2. Read the badge in the **Status** column according to the table below.

**How it works**

| Status               | Color  | Meaning                                                                                                                                                                                                                                                                 |
| -------------------- | ------ | ----------------------------------------------------------------------------------------------------------------------------------------------------------------------------------------------------------------------------------------------------------------------- |
| **Open**             | Red    | Incident in progress: the resource has a problem and has not recovered yet. It is the main row of the incident and accumulates the **Failures** counter.                                                                                                                |
| **Reoccurred**       | Yellow | Record of a new occurrence of an incident that was already open. It is not a new incident: each reoccurrence adds 1 to the **Failures** counter of the corresponding **Open** row.                                                                                      |
| **Resolved**         | Green  | The resource became healthy again (or someone used **Mark as resolved**) and the incident was closed. The incident's own row changes from **Open** to **Resolved**.                                                                                                     |
| **Data unavailable** | Blue   | Power Monitor could not read recent consumption data of a capacity for more than 45 minutes (for example, a paused capacity or a metrics source temporarily without data). It is a single notice per episode, closed automatically when the data starts arriving again. |

Old alerts, created before the classification by status, show "-" in the **Status** column.

### Status filter

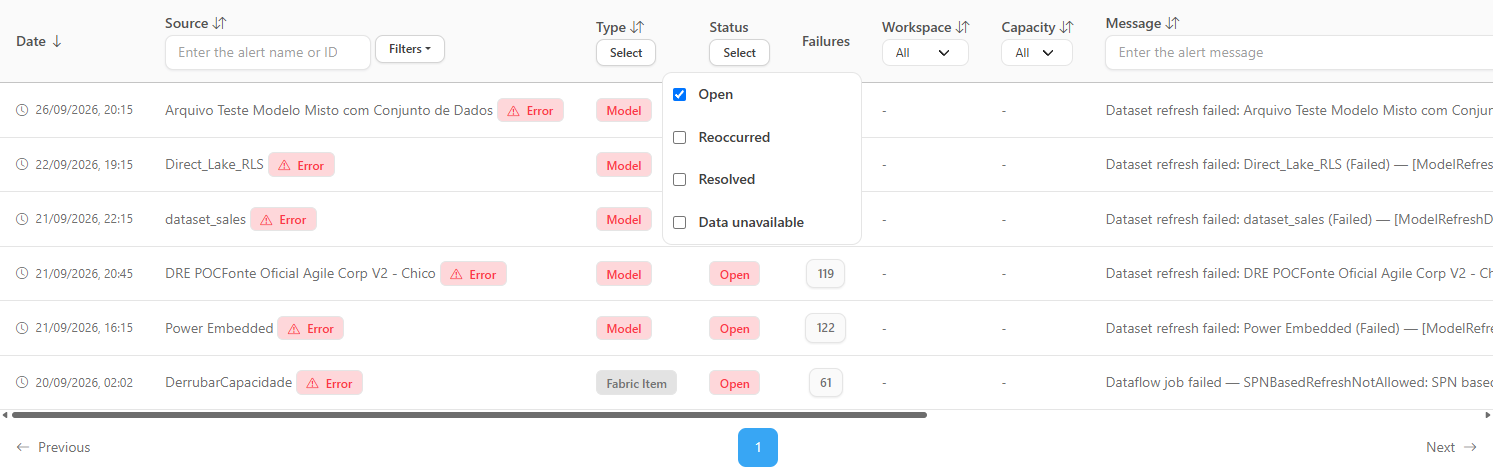
**What it is.** The **Select** selector in the header of the **Status** column, with the options **Open**, **Reoccurred**, **Resolved** and **Data unavailable** (multiple selection).

**What it is for.** Switching between "what has a problem now" (default), "what has already been resolved" (audit) and "all occurrences of an incident" (reoccurrences).

<figure><picture><source srcset="/files/HEXJPLJ8Smgyuu9Ubt7H" media="(prefers-color-scheme: dark)"><img src="https://3938213054-files.gitbook.io/~/files/v0/b/gitbook-x-prod.appspot.com/o/spaces%2FH2bFRBmIfyK3kwVKbldl%2Fuploads%2Fgit-blob-8042115d5b458245619c690ff97414c01ceee254%2Fpm-monitoramento-alertas-filtro-status-en.png?alt=media" alt="Open status selector with the options Open, Reoccurred, Resolved and Data unavailable"></picture><figcaption><p>Status selector of the alert list</p></figcaption></figure>

**How to use**

1. In the header of the **Status** column, click **Select**.
2. Click each status to check or uncheck it. You can check several at once.
3. Click anywhere outside the selector to close it. The list shows only the alerts with the checked statuses, within the chosen period.

**How it works**

* When the screen opens, only **Open** is checked.
* Resolved alerts **do not appear** in the default view: to see them, check **Resolved**.
* If you uncheck all statuses, the list shows all **unresolved** alerts, including old records created before the classification by status.

#### Example: see what was resolved overnight

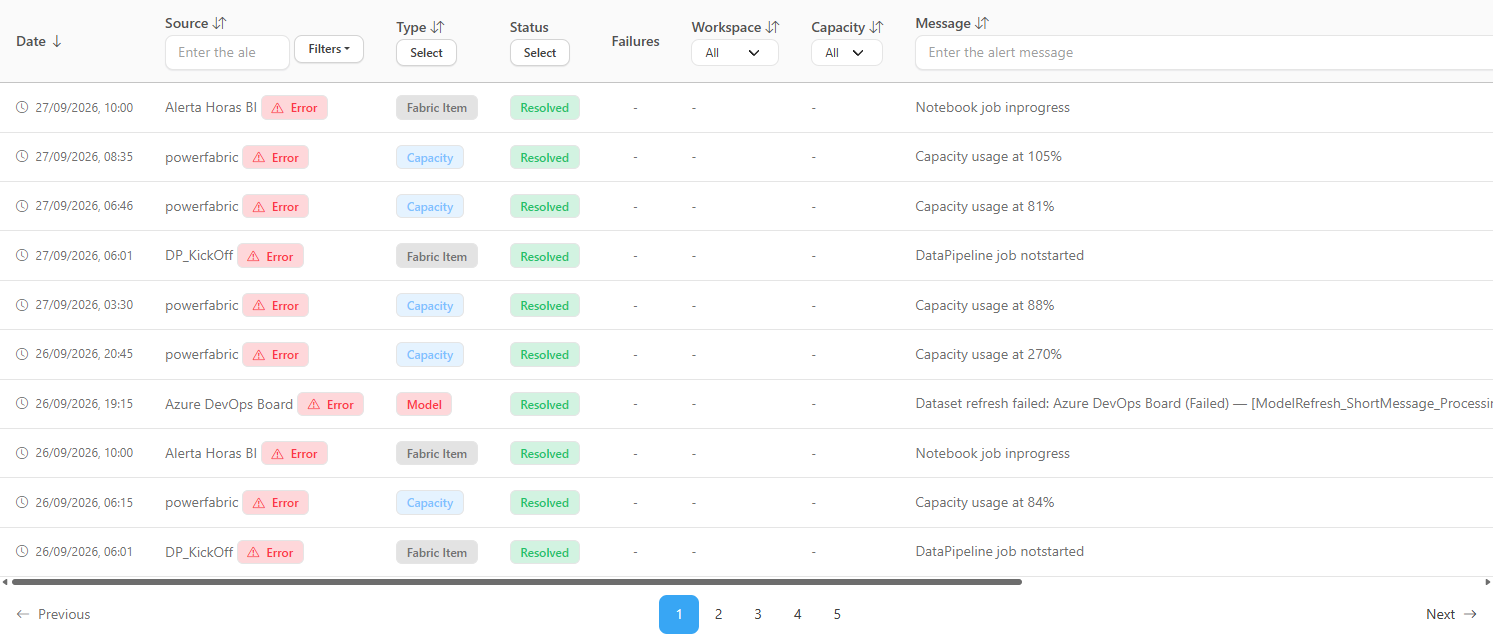
<figure><picture><source srcset="/files/XiNgFhu2dk00AJgVDmGl" media="(prefers-color-scheme: dark)"><img src="https://3938213054-files.gitbook.io/~/files/v0/b/gitbook-x-prod.appspot.com/o/spaces%2FH2bFRBmIfyK3kwVKbldl%2Fuploads%2Fgit-blob-ebeb76378f1fc208721c12dbb16f6097a4bef1b5%2Fpm-monitoramento-alertas-resolvidos-en.png?alt=media" alt="Alert list filtered by the Resolved status"></picture><figcaption><p>List filtered to show only resolved incidents</p></figcaption></figure>

1. In the period selector, choose **Yesterday** or the desired interval (under **Custom**, enter the dates).
2. In the header of the **Status** column, click **Select**, uncheck **Open** and check **Resolved**.
3. Read the list: each row shows the resource, the type, the time and the resolution message. To also see what is still open, check **Open** again.

### Resource type filter

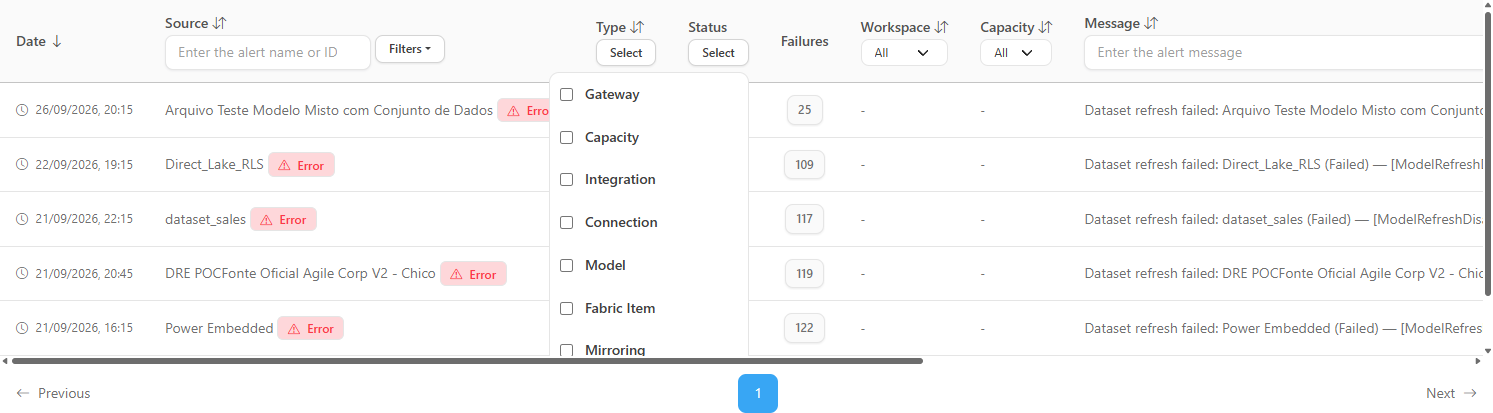
**What it is.** The **Select** selector in the header of the **Type** column, with multiple selection of resource types.

**What it is for.** Focusing on an area of responsibility, for example only **Gateway** for the infrastructure team, or only **Model** and **Fabric Item** for the data engineering team.

<figure><picture><source srcset="/files/B9jPpvRuYPijysRFf96x" media="(prefers-color-scheme: dark)"><img src="https://3938213054-files.gitbook.io/~/files/v0/b/gitbook-x-prod.appspot.com/o/spaces%2FH2bFRBmIfyK3kwVKbldl%2Fuploads%2Fgit-blob-c5684be1e81b39572da2ebce1b768515be5fb611%2Fpm-monitoramento-alertas-filtro-tipo-en.png?alt=media" alt="Type selector open with Gateway, Capacity, Integration, Connection, Model, Fabric Item, Mirroring and Data Freshness"></picture><figcaption><p>Resource type selector</p></figcaption></figure>

**How to use**

1. In the header of the **Type** column, click **Select**.
2. Check one or more types: **Gateway**, **Capacity**, **Integration**, **Connection**, **Model**, **Fabric Item**, **Mirroring** or **Data Freshness**.
3. Click outside the selector to close it. To see all types again, uncheck all options.

**How it works.** With no type checked, all types are shown. The **Connection** type groups the alerts of [Data source credentials](/en/power-monitor/monitoramento/credenciais-de-fontes-de-dados.md); the **Integration** type remains available to look up existing records.

### Severity filter (Errors or Informational)

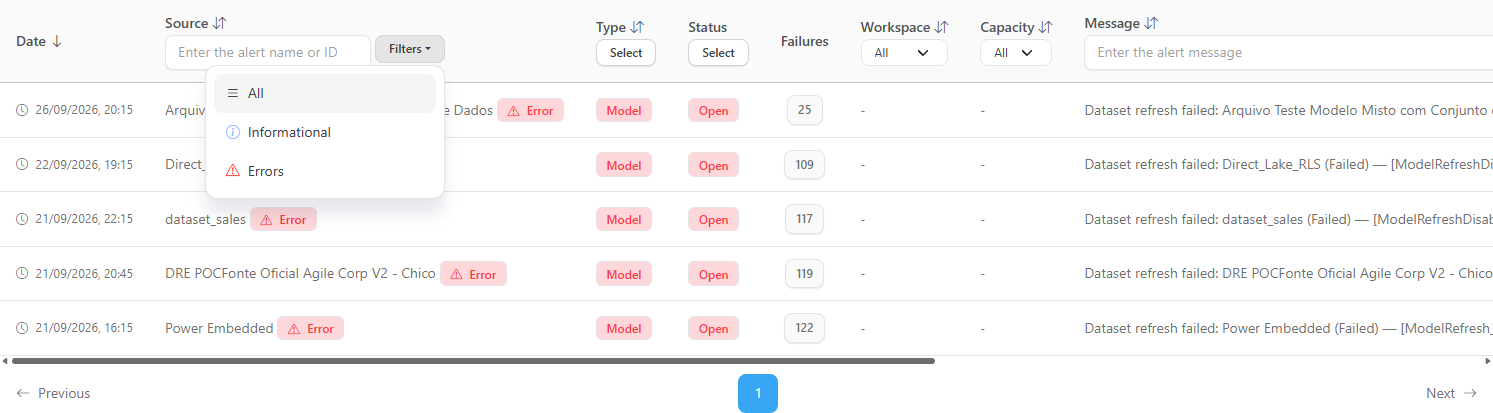
**What it is.** The **Filters** menu, next to the search field in the header of the **Source** column, with the options **All**, **Informational** and **Errors**.

**What it is for.** Separating the failures that require action (errors) from the informational notices.

<figure><picture><source srcset="/files/0RMBQwyHqBGm8hvXUPKW" media="(prefers-color-scheme: dark)"><img src="https://3938213054-files.gitbook.io/~/files/v0/b/gitbook-x-prod.appspot.com/o/spaces%2FH2bFRBmIfyK3kwVKbldl%2Fuploads%2Fgit-blob-c3a3c6adf567ce0186b51378d073ad5fac4dbcbc%2Fpm-monitoramento-alertas-filtro-severidade-en.png?alt=media" alt="Filters menu open with the options All, Informational and Errors"></picture><figcaption><p>Severity menu of the Source column</p></figcaption></figure>

**How to use**

1. In the header of the **Source** column, click the **Filters** button.
2. Choose **Errors** to see only error incidents, **Informational** to see only informational ones, or **All** to remove the filter. The active option is highlighted.

### Search by resource and by message

**What it is.** Two text fields in the list header: **Enter the alert name or ID** (**Source** column) and **Enter the alert message** (**Message** column).

**What it is for.** Quickly finding the alerts of a specific resource or all alerts with the same error code.

**How to use**

1. To find by the affected resource, type part of the name or the alert ID in the **Enter the alert name or ID** field.
2. To find by the content of the error (an error code, for example), type in the **Enter the alert message** field. The search is partial.
3. To undo the search, clear the text in the field.

### Workspace and capacity filters

**What it is.** Two lists in the headers of the **Workspace** and **Capacity** columns, filled with the real names of the organization's workspaces and capacities.

**What it is for.** Finding out whether several failures (models, pipelines, gateways) have a common cause, for example an overloaded capacity.

**How to use**

1. In the header of the **Workspace** column, choose the workspace from the list. The **All** option removes the filter.
2. If you also want to restrict by capacity, choose the capacity from the list in the header of the **Capacity** column.

**How it works.** The selection filters by workspace or capacity name (the comparison is partial: choosing a name also brings those that contain it). Gateway and capacity alerts do not belong to a workspace; therefore, when you filter by workspace, they stop appearing.

### Column sorting

**What it is.** The **Date**, **Source**, **Type**, **Workspace**, **Capacity** and **Message** columns can be sorted with a click on the title. An arrow indicates the current column and direction.

**What it is for.** Visually grouping the alerts of the same resource, type or workspace, or bringing the most recent ones to the top.

**How to use**

1. Click the column title. The first click sorts in descending order (arrow down).
2. Click the same column again to reverse the order (arrow up).

**How it works.** By default, the list is sorted by **Date**, from the most recent to the oldest. The **Status**, **Failures**, **Success rate** and **Last 5 runs** columns cannot be sorted.

### Failure counter and the "Incident failures" modal

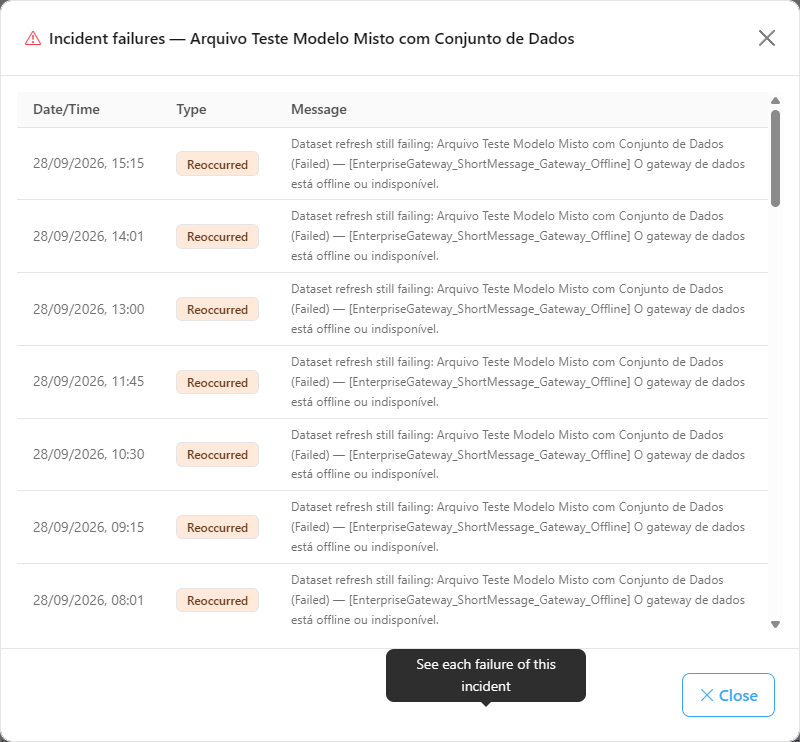
**What it is.** The number in the **Failures** column indicates how many times the failure occurred within the incident. Clicking it opens the **Incident failures** modal, with the timeline of each occurrence (the opening and each reoccurrence).

**What it is for.** Understanding the history of an incident: since when the problem exists, how often it repeats and whether the error message changed over time (for example, from "invalid credential" to "timeout exceeded").

<figure><picture><source srcset="/files/VsGDi8z86Xsd7vgB1aYT" media="(prefers-color-scheme: dark)"><img src="https://3938213054-files.gitbook.io/~/files/v0/b/gitbook-x-prod.appspot.com/o/spaces%2FH2bFRBmIfyK3kwVKbldl%2Fuploads%2Fgit-blob-4623fb332c870e9829cec59fdc862b9fa34dd9ed%2Fpm-monitoramento-alertas-modal-falhas-en.png?alt=media" alt="Incident failures modal with the list of occurrences"></picture><figcaption><p>"Incident failures" modal: opening and reoccurrences of the same incident</p></figcaption></figure>

**How to use**

{% stepper %}
{% step %}

#### Locate the open incident

With the default status filter (**Open**), use the **Type** and **Workspace** filters or the **Source** search to find the resource.
{% endstep %}

{% step %}

#### Click the number in the Failures column

The number appears only on rows with the **Open** status; when you hover over it, the tooltip **See each failure of this incident** is shown. The click opens the **Incident failures** modal, with the resource name in the title.
{% endstep %}

{% step %}

#### Analyze the timeline

The modal lists each occurrence with **Date/Time**, **Type** (**Open** for the first failure, **Reoccurred** for the following ones) and **Message**. Compare the messages to see whether the error changed during the incident.
{% endstep %}

{% step %}

#### Go deeper on the resource screen

Click **Close** and go to the specific screen: [Semantic Models](/en/power-monitor/monitoramento/modelos-semanticos.md) for refreshes, [Fabric Items](/en/power-monitor/monitoramento/itens-do-microsoft-fabric.md) for pipelines and notebooks, [Gateways](/en/power-monitor/monitoramento/gateways.md) for connectivity, [Capacities](/en/power-monitor/monitoramento/capacidades.md) for consumption, [Fabric Mirroring](/en/power-monitor/monitoramento/fabric-mirroring.md) or [Data Freshness](/en/power-monitor/monitoramento/atualizacao-de-dados.md) for the monitors, [Data source credentials](/en/power-monitor/monitoramento/credenciais-de-fontes-de-dados.md) for the connections.
{% endstep %}
{% endstepper %}

**How it works**

| Modal column  | What it shows                                                              |
| ------------- | -------------------------------------------------------------------------- |
| **Date/Time** | Moment of the occurrence.                                                  |
| **Type**      | **Open** (the first failure, which opened the incident) or **Reoccurred**. |
| **Message**   | Error message of that occurrence.                                          |

* On the **Reoccurred**, **Resolved** and **Data unavailable** rows, the **Failures** column shows "-", because the counter belongs to the incident's **Open** row.
* If loading fails, the modal shows **Could not load this incident's failures.** and the **Retry** button. With no recorded occurrences, it shows **No failure recorded.**

## Actions on an incident

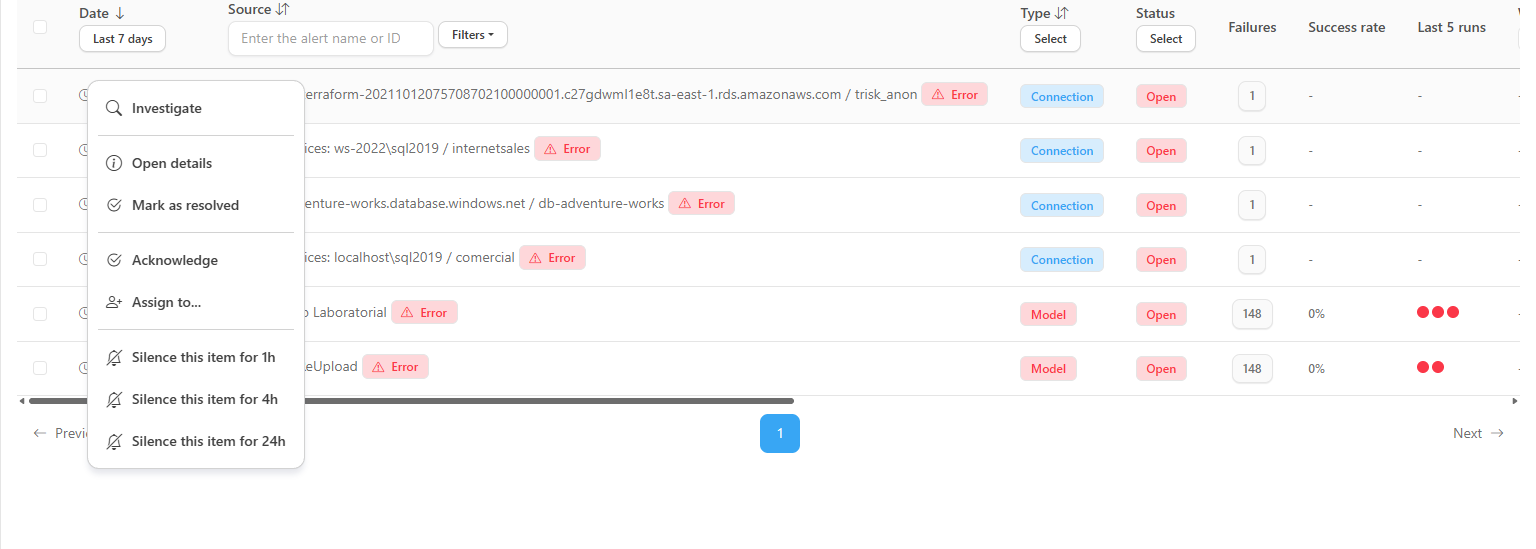
The actions are in the row's **action menu**: **right-click** the alert (on mobile, tap the three-dot button at the end of the row). **Acknowledge**, **Remove acknowledgement**, **Assign to...** and **Remove assignee** also appear in the details modal, in the **Operational workflow** section. Silencing and marking as resolved are only in the row menu and in the bulk action bar.

<figure><picture><source srcset="/files/uTyyPwMMa2HQdH7vniOm" media="(prefers-color-scheme: dark)"><img src="https://3938213054-files.gitbook.io/~/files/v0/b/gitbook-x-prod.appspot.com/o/spaces%2FH2bFRBmIfyK3kwVKbldl%2Fuploads%2Fgit-blob-42863315764cb6d73756cdfa68f306a939827604%2Fpm-monitoramento-alertas-menu-acoes-en.png?alt=media" alt="Action menu of an open error alert with Investigate, Open details, Mark as resolved, Acknowledge, Assign and Silence"></picture><figcaption><p>Action menu (right-click) of an open incident</p></figcaption></figure>

| Menu item                               | When it appears                                                                  | Who can                                      |
| --------------------------------------- | -------------------------------------------------------------------------------- | -------------------------------------------- |
| **Investigate**                         | Alerts with **Error** severity. See [Investigate with AI](#investigate-with-ai). | All profiles (requires AI to be configured). |
| **Open details**                        | Always.                                                                          | Everyone.                                    |
| **Mark as resolved**                    | Incidents not yet resolved.                                                      | Everyone.                                    |
| **Acknowledge**                         | Open incident not yet acknowledged.                                              | Everyone.                                    |
| **Remove acknowledgement**              | Open incident already acknowledged.                                              | Everyone.                                    |
| **Assign to...**                        | Whenever the user is an Administrator. Opens the user search.                    | Administrators.                              |
| **Assign to me**                        | For those who are not Administrators (and are not yet the assignee).             | Everyone.                                    |
| **Remove assignee**                     | When the incident already has an assignee.                                       | Whoever can assign.                          |
| **Silence this item for 1h / 4h / 24h** | Unresolved incidents.                                                            | Administrators.                              |

### Acknowledge and remove the acknowledgement

**What it is.** The **acknowledgement** is the "I'm looking at this": it records who took notice of the incident and when. The incident remains **Open** (only the resolution of the resource closes it), but it starts to show the **Acknowledged** badge.

**What it is for.** Avoiding duplicated work during an on-call shift, feeding the **MTTA** and preventing the **escalation** of the incident (see [Escalation](#escalation)).

**How to use**

1. Right-click the open alert and choose **Acknowledge**.
2. To acknowledge several at once, check the row checkboxes and use **Acknowledge selected (N)** in the bar that appears above the table (or in the right-click menu on a selected row).
3. To undo, use **Remove acknowledgement** in the alert menu.

**How it works.** Only open incidents can be acknowledged. When configured, acknowledging triggers the "alert acknowledged" event for the [Webhooks and ITSM](/en/power-monitor/configuracoes/alertas.md#webhooks-and-itsm) endpoints.

### Assign an assignee

**What it is.** Indicates who is handling the incident. The assignee appears in the **Assignee: e-mail** badge of the row and in the **Operational workflow** section of the details modal.

**How to use**

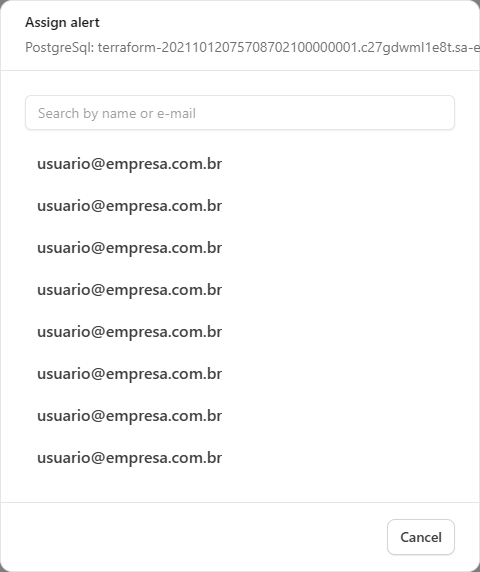
1. **Administrators:** right-click the alert and choose **Assign to...**; in the **Assign alert** modal, search for the user by name or e-mail and click on it. There is also **Remove assignee**.
2. **Other profiles:** use **Assign to me** (takes over the incident) or **Remove assignee**.

<figure><picture><source srcset="/files/wXC5W1AqzOOmU9fiIZas" media="(prefers-color-scheme: dark)"><img src="https://3938213054-files.gitbook.io/~/files/v0/b/gitbook-x-prod.appspot.com/o/spaces%2FH2bFRBmIfyK3kwVKbldl%2Fuploads%2Fgit-blob-e5c7267d07f589e6c876cb9c3825842878a46c3a%2Fpm-monitoramento-alertas-atribuir-en.png?alt=media" alt="Assign alert modal with the Search by name or e-mail field and the user list"></picture><figcaption><p>"Assign alert" modal</p></figcaption></figure>

### Mark as resolved

**What it is.** Manually closes one or several incidents. A confirmation box explains that the alert will leave the open list and that, if the problem happens again, it will be recorded as a **new incident**.

**How to use.** Use **Mark as resolved** in the alert menu or, for several, check the row checkboxes and click **Mark as resolved** in the bulk actions bar (**Clear selection** undoes the selection).

### Comment

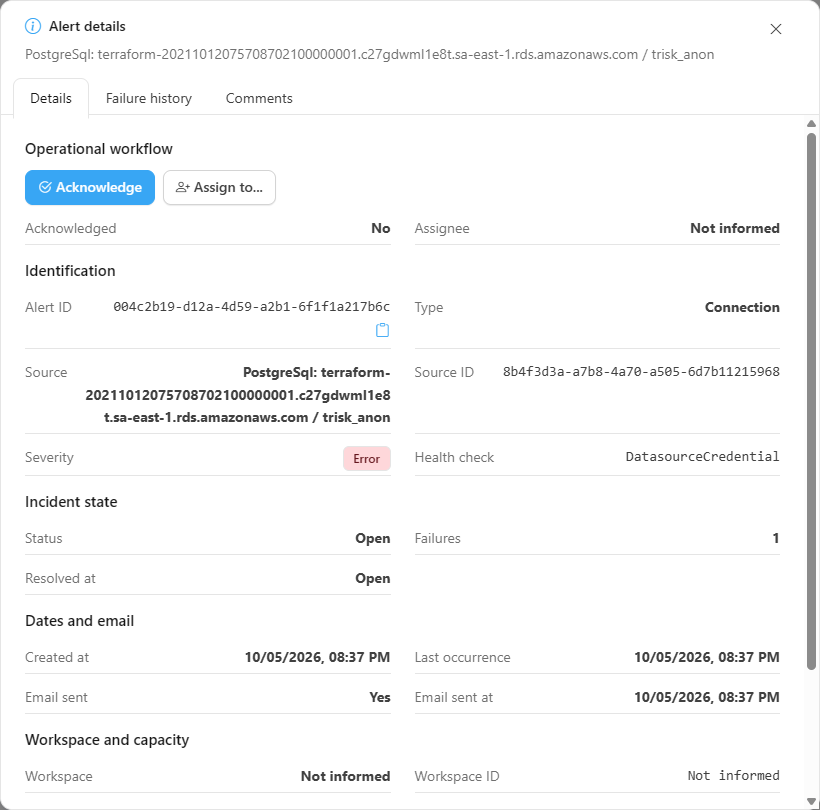
**What it is.** The **Comments** tab of the **Alert details** modal lets you record notes (up to 2000 characters) visible to those who access the alert, with author and date. The number of comments appears as a badge on the row.

**How to use**

1. Open the modal with **Open details** (alert menu).
2. On the **Comments** tab, write in the field and click **Comment**.

The modal also has the **Details** tab (operational workflow, identification, incident state, dates and email, workspace and capacity, message with a **Copy** button and the list of **Incident occurrences**), the **Failure history** tab (since when it fails, number of failures, last successful run, success rate and consecutive failed runs) and, when there are correlated alerts, **Correlated**.

<figure><picture><source srcset="/files/dsCNvYGWoIKvSVSvCdi1" media="(prefers-color-scheme: dark)"><img src="https://3938213054-files.gitbook.io/~/files/v0/b/gitbook-x-prod.appspot.com/o/spaces%2FH2bFRBmIfyK3kwVKbldl%2Fuploads%2Fgit-blob-0352207362428ea6552c9d79adda16b3d2a4dbb8%2Fpm-monitoramento-alertas-detalhes-en.png?alt=media" alt="Alert details modal with the tabs Details, Failure history, Comments and Correlated"></picture><figcaption><p>"Alert details" modal</p></figcaption></figure>

### Badges of the operational workflow

Next to the source name, the list shows badges that summarize the handling: **Acknowledged** (with who acknowledged and when, in the tooltip), **Assignee**, **Silenced** (with the rule, in the tooltip), **Escalated**, the number of **comments** and of **correlated** alerts and, on child alerts, **View root cause**.

### Silence

**What it is.** A silence suspends, for a period, the e-mails and external notifications (Teams, Slack, Telegram, webhooks and ITSM) of the alerts that match a rule. The alerts **are still recorded** on the screen; they just stop notifying.

**What it is for.** Avoiding noise during planned maintenance or while a known failure is being handled. **Exclusive to Administrators.**

**How to use**

* **Quick silence:** in the alert menu, choose **Silence this item for 1h**, **for 4h** or **for 24h**. It creates a rule for that item (source), starting now.
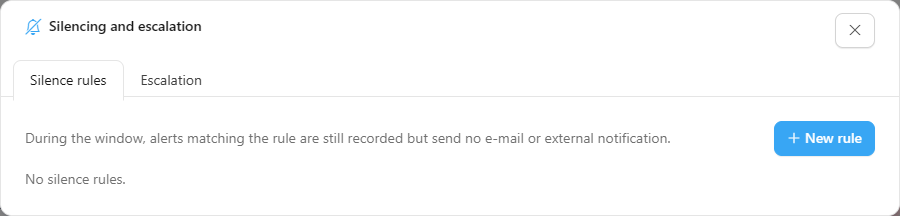
* **Full rules:** click **Silencing and escalation** (right below the tabs, on the right, visible on both) and use the **Silence rules** tab.

<figure><picture><source srcset="/files/AGFutwAgFtWnz52m7WzQ" media="(prefers-color-scheme: dark)"><img src="https://3938213054-files.gitbook.io/~/files/v0/b/gitbook-x-prod.appspot.com/o/spaces%2FH2bFRBmIfyK3kwVKbldl%2Fuploads%2Fgit-blob-5f2222339e3bc9fdd96ba4ce76f532797fe22b23%2Fpm-monitoramento-alertas-silenciamento-en.png?alt=media" alt="Silencing and escalation modal on the Silence rules tab"></picture><figcaption><p>"Silencing and escalation" modal: silence rules</p></figcaption></figure>

**Rule fields**

| Field                 | Description                                                                                                                                                                                                   |
| --------------------- | ------------------------------------------------------------------------------------------------------------------------------------------------------------------------------------------------------------- |
| **Name**              | Rule identification (up to 200 characters).                                                                                                                                                                   |
| **Scope**             | **All alerts** or a **Specific item** (when created by the quick silence). Under **All alerts**, you can restrict by **Source type** (default **Any type**) and by **Workspace** (default **Any workspace**). |
| **Period**            | Start and end of the window (local date and time). The end must be after the start.                                                                                                                           |
| **Reason (optional)** | Justification (up to 1000 characters).                                                                                                                                                                        |
| **Rule enabled**      | Turns the rule on or off without deleting it.                                                                                                                                                                 |

The list shows the **Status** of each rule: **Active now**, **Scheduled**, **Expired** or **Disabled**, with the actions **Edit rule** and **Delete rule** (deleting makes the covered alerts notify again).

**How it works**

* A rule is valid between the start and the end, as long as it is enabled. All filled filters must match; an empty filter means "any". A workspace rule never matches alerts without a workspace (gateways and capacities).
* If several rules match, the most specific one (with more filters) wins.
* An incident that was already silenced when it opened stays silent until the end (with no resolution notice), and a silenced alert **is not escalated**.

### Escalation

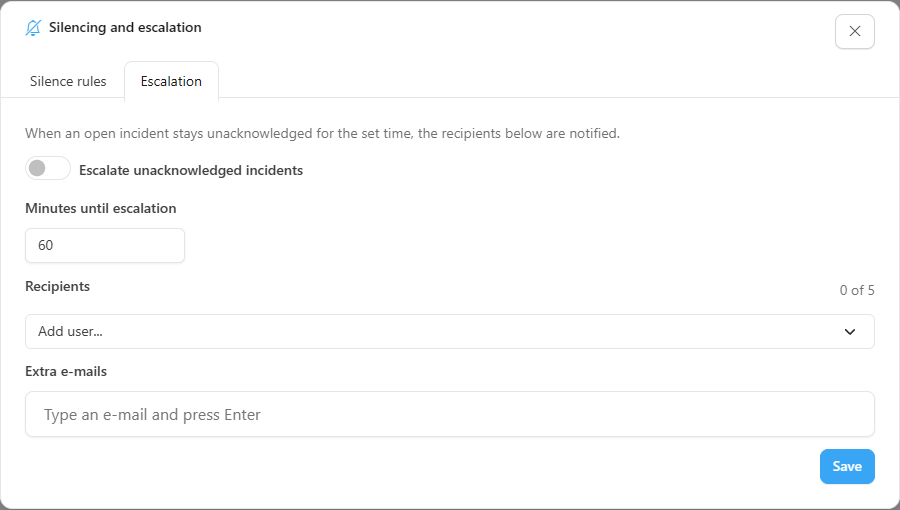
**What it is.** An organization policy that notifies specific people when an open **error** incident stays unacknowledged for a defined time. **Exclusive to Administrators**, on the **Escalation** tab of the **Silencing and escalation** modal.

**How to configure**

1. Open **Silencing and escalation** and go to the **Escalation** tab.
2. Turn on **Escalate unacknowledged incidents**.
3. Enter the **Minutes until escalation** (between 5 and 10080; the default is 60).
4. Choose the **Recipients**: organization users (**Add user...**) and **Extra e-mails** (type and press Enter). At most **5 recipients**, users and e-mails combined.
5. Save. To enable it, at least one recipient is required.

<figure><picture><source srcset="/files/wxBthSbxmICejaebULjN" media="(prefers-color-scheme: dark)"><img src="https://3938213054-files.gitbook.io/~/files/v0/b/gitbook-x-prod.appspot.com/o/spaces%2FH2bFRBmIfyK3kwVKbldl%2Fuploads%2Fgit-blob-4b1d278419996317bb1b8430033fbaab3fda9e94%2Fpm-monitoramento-alertas-escalonamento-en.png?alt=media" alt="Escalation tab with the enable option, the minutes until escalation and the recipients"></picture><figcaption><p>Escalation policy</p></figcaption></figure>

**How it works**

* The check runs every 5 minutes. An incident is escalated **only once**: if it has **Error** severity, has been open for at least the defined time, and has not been acknowledged or silenced.
* The escalation sends an e-mail to the policy recipients (with the time open and the number of correlated alerts), marks the incident as **Escalated** and triggers the "alert escalated" event of the [Webhooks and ITSM](/en/power-monitor/configuracoes/alertas.md#webhooks-and-itsm) endpoints.
* **Acknowledging** the incident before the deadline prevents the escalation. Child alerts of a root-cause incident that is still open do not escalate: the cause is the one that escalates (see the next section).

### Correlation of incidents

To avoid a flood of notices for a single cause, Power Monitor conservatively links a new incident to a root-cause incident that is still open when there is a definitive relationship:

* **Gateway offline** and refresh failure of a **semantic model** that uses that gateway.
* **Capacity offline** (or **Data unavailable**) and failure of a **semantic model** or **Fabric item** in a workspace of that capacity.

The root-cause incident must be open and must have opened before (or together with) the child. The child **does not send its own e-mail** (the cause's notice already covers the incident), shows the **View root cause** badge and appears on the **Correlated** tab of the cause's details modal, which shows the number of correlated alerts. When in doubt, Power Monitor does **not** correlate.

### Investigate with AI

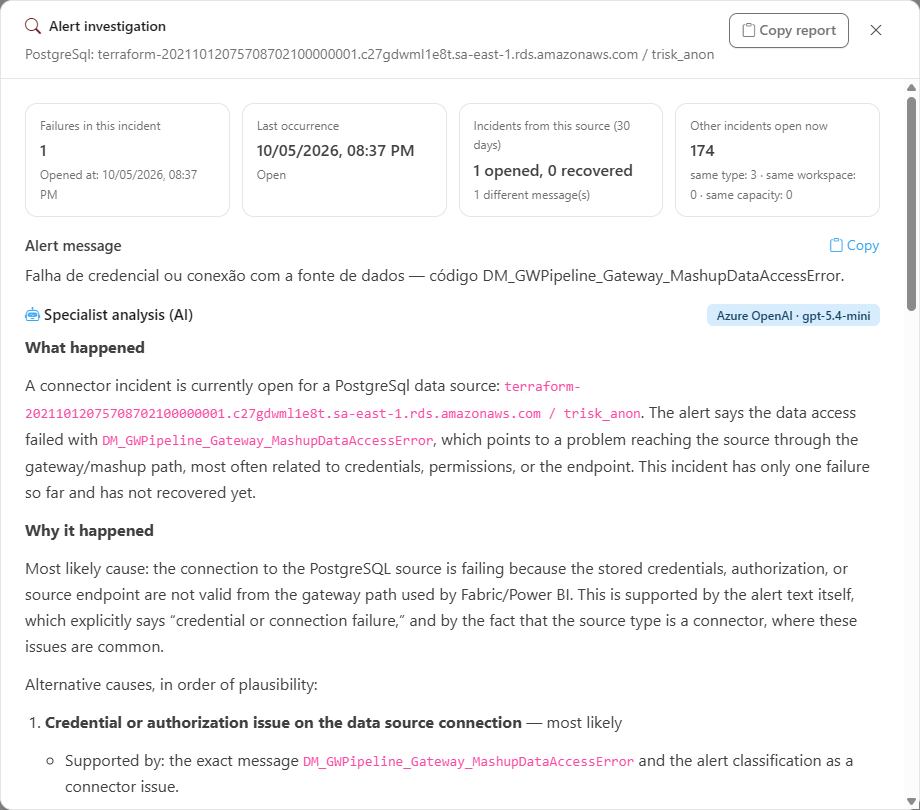
**What it is.** The **Investigate** item in the right-click menu of an **Error** alert opens the **Alert investigation** modal, with the technical dossier (message, incident occurrences, history of the source over the last days, average recovery time, other incidents open on the same type, workspace or capacity) and an AI analysis that explains the probable cause and suggests next steps.

**How to use.** Right-click an error alert and choose **Investigate**. If AI is not yet configured (see [Settings › AI](/en/power-monitor/configuracoes/ia.md)) or the spending limit has been reached, the item appears disabled and the tooltip explains why. Informational alerts do not have **Investigate**.

<figure><picture><source srcset="/files/i5ciZhl2iL1r4D6oVrwz" media="(prefers-color-scheme: dark)"><img src="https://3938213054-files.gitbook.io/~/files/v0/b/gitbook-x-prod.appspot.com/o/spaces%2FH2bFRBmIfyK3kwVKbldl%2Fuploads%2Fgit-blob-5ad0580b9ce9fdd0a39de57a38cb46c925e5e385%2Fpm-monitoramento-alertas-investigar-en.png?alt=media" alt="Alert investigation modal with the technical dossier and the AI analysis"></picture><figcaption><p>"Alert investigation" modal</p></figcaption></figure>

## Notifications and channels

### Configuring who receives notifications

The notifications for opening, reoccurrence and resolution are not configured on this screen, but in *Settings*. An **Administrator** defines the channels (e-mail, Microsoft Teams, Slack, Telegram, plus webhooks and ITSM) in [Settings › Alerts](/en/power-monitor/configuracoes/alertas.md) and, in *Settings › Notifications*, turns each notification type on or off, filters the failures of semantic models and Fabric items by criticality, turns on the notice to the artifact creator and sends a test e-mail. See [Notifications](#notifications), [Settings › Notifications](/en/power-monitor/configuracoes/notificacoes.md) and [Settings](/en/power-monitor/configuracoes.md).

## Rules and behavior

### Where alerts come from

| Type               | When an incident opens                                                                                                                                                                                                                       | When it is resolved                           | Check frequency                                                                         |
| ------------------ | -------------------------------------------------------------------------------------------------------------------------------------------------------------------------------------------------------------------------------------------- | --------------------------------------------- | --------------------------------------------------------------------------------------- |
| **Gateway**        | The gateway goes offline or becomes unreachable.                                                                                                                                                                                             | The gateway comes back online.                | Every 5 minutes (when gateway monitoring is on).                                        |
| **Capacity**       | The capacity becomes unavailable, usage reaches the configured limit, background usage is high, the capacity is on outside the expected window or the daily cost exceeds the defined limit. It also records the **Data unavailable** notice. | The capacity returns to the normal state.     | Every 5 minutes, together with consumption collection (when capacity monitoring is on). |
| **Model**          | The most recent refresh of a semantic model fails, is canceled or the refresh is disabled.                                                                                                                                                   | A later refresh completes successfully.       | Every 15 minutes (when semantic model monitoring is on).                                |
| **Fabric Item**    | The most recent run of a DataPipeline, CopyJob, Notebook or Dataflow Gen2 did not complete successfully (failed, was canceled or was still running at the time of the check).                                                                | A later run completes successfully.           | Every 2 hours (when Fabric item monitoring is on).                                      |
| **Mirroring**      | A monitored mirrored database becomes stopped or delayed.                                                                                                                                                                                    | Replication returns to normal.                | According to each monitor's schedule.                                                   |
| **Data Freshness** | A monitored table has data outdated beyond the configured limit.                                                                                                                                                                             | The data is up to date again.                 | According to each monitor's schedule.                                                   |
| **Connection**     | A data source credential is checked and has a failure (see [Data source credentials](/en/power-monitor/monitoramento/credenciais-de-fontes-de-dados.md)).                                                                                    | The credential works again in the next check. | According to the credentials collection (when enabled).                                 |

The **Integration** type remains available in the filter to look up existing records.

{% hint style="info" %}
**Consumption anomalies** and **execution time deviations** do not appear in this list: they have their own screens ([Consumption Anomalies](/en/power-monitor/monitoramento/anomalias-de-consumo.md) and [Average Execution Time](/en/power-monitor/performance/tempo-medio-de-execucao.md)) and their own notifications. To follow availability and response time over the months, see the [SLA Report](/en/power-monitor/monitoramento/relatorio-de-sla.md).
{% endhint %}

### One row per incident

While a resource keeps having a problem, Power Monitor **does not open a new alert** at each check. Instead:

1. The first failure creates the row with the **Open** status and a **Failures** counter equal to 1.
2. If the problem persists, a **reoccurrence** is recorded (for gateways, capacities, models and Fabric items, the first after 30 minutes and the following ones every 1 hour) and the counter of the **Open** row increases.
3. When the resource recovers, the row changes to **Resolved** and stops appearing in the default view.
4. A failure that happens **after** the resolution opens a new incident.

### Notifications

Besides appearing on this screen, an incident generates notifications:

* **Opening**: a notification when the incident opens.
* **Resolution**: an **Alert Resolved** notification when the incident is closed.
* **Reoccurrences**:
  * **Gateways, semantic models and Fabric items**: reoccurrences **do not generate a new e-mail**; they add to the **Failures** counter and appear in the **Hourly Checklist**.
  * **Capacities** (unavailable or with usage above the limit): reoccurrences **generate e-mail reminders** (and on the configured channels) while the problem continues: the first about 30 minutes after opening and, after that, at most one per hour. For **background usage**, at most one is sent per day for each usage band (50–69%, 70–79%, 80–98% and 100% or more).
  * **Mirroring** and **Data Freshness**: each monitor has its own resend interval (from 1 to 24 hours); resends arrive identified as **Reminder**.
* **Data unavailable**: a single notice per episode, with no resolution notification.
* **Escalation**: e-mail to the policy recipients, when the incident stays unacknowledged (see [Escalation](#escalation)).
* **Silencing and correlation**: incidents that are silenced or correlated to an open cause do not send e-mail or messages on the channels, but remain on the screen.
* **Criticality filters**: for failures of **semantic models** and **Fabric items**, the administrator can limit notifications by workspace criticality, item criticality, Fabric item type or specific items. A **filtered incident still appears on this screen** normally; it just stops generating e-mail and messages in Teams, Slack and Telegram.
* **Creator notice**: optionally, the creator of the semantic model or Fabric item receives an e-mail when the failure incident opens, even if not a recipient of the alerts.
* **Webhooks and ITSM**: endpoints configured in *Settings › Alerts* receive the events of alert opened, recovered, escalated and acknowledged (see [Webhooks and ITSM](/en/power-monitor/configuracoes/alertas.md#webhooks-and-itsm)).

**Channels.** Notifications are sent by e-mail (through Power Monitor's default server or through the organization's own SMTP server) and can also be sent to **Microsoft Teams** channels, **Slack** channels and **Telegram** chats. By default, each channel receives all alert types; you can uncheck the unwanted types per channel. This configuration is in *Settings › Alerts* (administrators only).

**E-mail recipients.** By default, administrators receive the alerts. When there are user links with workspaces marked **Receives alerts**, the alerts of that workspace go to the linked people (including users who are not administrators); alerts without a workspace, such as gateway and capacity alerts, go to all eligible recipients. See [Settings › Notifications](/en/power-monitor/configuracoes/notificacoes.md).

{% hint style="warning" %}
Turning off a notification type or filtering it in *Settings › Notifications* only stops the **sending** of messages. Incidents continue to be recorded and shown on this screen.
{% endhint %}

### Error messages

For **semantic models**, the message includes the error code returned by Power BI followed by an explanation (for example, expired credentials, unreachable gateway or capacity limit exceeded). For **Fabric items**, the message includes the error code and text returned by Fabric, limited to 300 characters in the list. **Resolution** messages carry no error.

## Frequently asked questions

<details>

<summary>An error happened in Fabric, but no alert appears here. Why?</summary>

Check:

* whether monitoring for that resource type is turned on in *Settings › Monitoring* (**Resource Monitoring** section, for semantic models, Fabric items and gateways);
* whether the item's workspace is marked as monitored and whether Power Monitor has access to it;
* the check interval: Fabric items are checked every 2 hours, so a recent failure may not have been read yet;
* the screen filters: by default, only the **Open** alerts of the last 7 days appear. If the resource has already recovered, the alert will be **Resolved**;
* your workspace scope: users with restricted visibility do not see alerts from workspaces outside their scope.

</details>

<details>

<summary>Why does the Failures column show a number greater than 1?</summary>

Because the same incident repeated. Instead of creating a new row at each check, Power Monitor adds the reoccurrences to the open incident's row. Click the number to see each occurrence.

</details>

<details>

<summary>I received the opening e-mail, but no more e-mails while the problem continued. Is that correct?</summary>

For gateways, semantic models and Fabric items, yes: the e-mail is sent once on opening and once on resolution (**Alert Resolved**). Reoccurrences are recorded on this screen and appear in the **Hourly Checklist**. The exceptions are:

* **Capacities** unavailable or with usage above the limit: they receive e-mail reminders while the problem continues (the first about 30 minutes after opening and then at most one per hour); background usage generates at most one e-mail per day for each usage band.
* **Mirroring** and **Data Freshness**: resend reminders according to the interval configured in each monitor.
* **Escalation**: if enabled and nobody acknowledges the incident in time, the policy recipients receive an additional e-mail.

</details>

<details>

<summary>The incident appears here, but I did not receive any e-mail. Why?</summary>

Check in *Settings › Notifications* whether the alert type is turned on for you and whether the card has the **Filter active** badge: failures of semantic models and Fabric items that do not meet the criticality filters still appear on this screen, but do not generate e-mail or messages on the channels. Also check whether the alert has the **Silenced** badge (a silence rule was active), whether it was **correlated** to an open cause (the notice is the cause's) and whether the resource's workspace is in your **Receives alerts** scope (see [Settings › Notifications](/en/power-monitor/configuracoes/notificacoes.md)).

</details>

<details>

<summary>The cards at the top do not change when I apply filters. Is that a problem?</summary>

No. The failure cards and the **Informational** and **Errors** totals show the current state of the whole environment (within your access scope), on purpose. The filters affect only the list, and the period affects the list and the **Operations metrics** card.

</details>

<details>

<summary>What does the "Data unavailable" status mean?</summary>

That Power Monitor went more than 45 minutes without being able to read recent consumption data of a capacity, usually because it was paused or because the metrics source is temporarily without data. It is not necessarily a capacity failure. The notice is closed automatically when the data starts arriving again.

</details>

<details>

<summary>Does acknowledging an alert resolve it?</summary>

No. The acknowledgement only indicates that someone is aware and handling it (and prevents escalation). The incident only becomes **Resolved** when the resource recovers or when someone uses **Mark as resolved**.

</details>

<details>

<summary>I do not see the silencing and escalation buttons. Why?</summary>

Silencing, creating rules and configuring escalation are actions exclusive to **Administrators**. Other profiles can acknowledge, comment, assign to themselves and mark as resolved.

</details>

<details>

<summary>The "Investigate" item is disabled.</summary>

The AI analysis requires AI to be configured in the organization and the spending limit not to have been reached. Hover over the item to see the reason. See [Settings › AI](/en/power-monitor/configuracoes/ia.md).

</details>

## Related pages

* [Monitoring overview](/en/power-monitor/monitoramento.md)
* [SLA Report](/en/power-monitor/monitoramento/relatorio-de-sla.md)
* [Data source credentials](/en/power-monitor/monitoramento/credenciais-de-fontes-de-dados.md)
* [Semantic Models](/en/power-monitor/monitoramento/modelos-semanticos.md)
* [Fabric Items](/en/power-monitor/monitoramento/itens-do-microsoft-fabric.md)
* [Gateways](/en/power-monitor/monitoramento/gateways.md)
* [Capacities](/en/power-monitor/monitoramento/capacidades.md)
* [Data Freshness](/en/power-monitor/monitoramento/atualizacao-de-dados.md)
* [Fabric Mirroring](/en/power-monitor/monitoramento/fabric-mirroring.md)
* [Settings › Alerts (channels, webhooks and API keys)](/en/power-monitor/configuracoes/alertas.md)
* [Settings › Notifications](/en/power-monitor/configuracoes/notificacoes.md)
* [Settings](/en/power-monitor/configuracoes.md)
* [Monitoring Dashboard](/en/power-monitor/dashboards/dashboard-de-monitoramento.md)


---

# Agent Instructions
This documentation is published with GitBook. GitBook is the documentation platform designed so that both humans and AI agents can read, navigate, and reason over technical content effectively. Learn more at gitbook.com.

## Querying This Documentation
If you need additional information that is not directly available in this page, you can query the documentation by asking a question.

Perform an HTTP GET request on the following URL with the `ask` and `goal` query parameters:

```
GET https://docs.powermonitor.com.br/en/power-monitor/monitoramento/alertas.md?ask=<question>&goal=<user_goal>
```

`ask` is the immediate question: it should be specific, self-contained, and written in natural language.
`goal` is what the user is ultimately trying to achieve, the reason they need the answer. Sharing it helps GitBook give you a better, more relevant answer. A goal is most helpful when it describes the outcome the user wants rather than restating the question. For example, with `ask=how do I create an API token`, a goal like `automate deployments from our CI pipeline` lets GitBook tailor the answer to that use case.

The response will contain a direct answer to the question and relevant excerpts and sources from the documentation.

Use this mechanism when the answer is not explicitly present in the current page, you need clarification or additional context, or you want to retrieve related documentation sections.