> For the complete documentation index, see [llms.txt](https://docs.powermonitor.com.br/llms.txt). Markdown versions of documentation pages are available by appending `.md` to page URLs; this page is available as [Markdown](https://docs.powermonitor.com.br/en/power-monitor/monitoramento/anomalias-de-consumo.md).

# Consumption Anomalies

Automatic detection of items and operations that consumed more Capacity Units than usual, comparing the current day with the average of the last 7 complete days (or 30, when 7 are not enough).

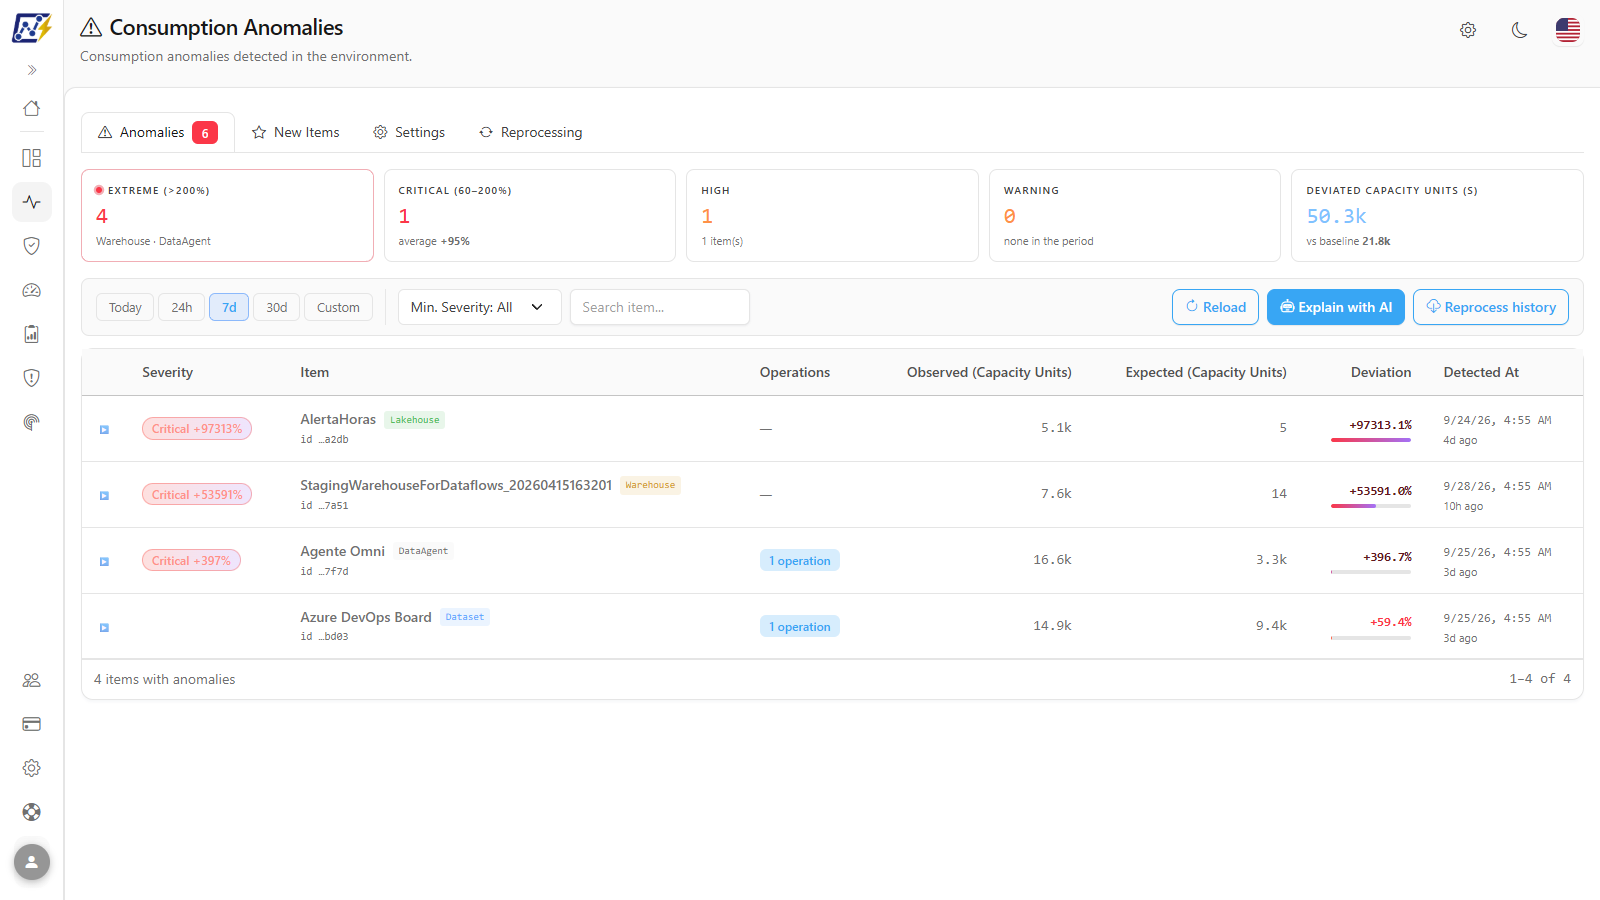
The **Consumption Anomalies** screen lists the items (and the operations of those items) whose Capacity Units (s) consumption for the day was **above** the expected pattern. The pattern (*baseline*) is the item's average daily consumption over the **last 7 complete days**; when the item does not have enough days with data in those 7 days, the average of the **last 30 complete days** is used. An item without enough history in either window is not evaluated. Detection runs continuously throughout the day and can send email notifications.

**How to access:**

* *Monitoring › Consumption Anomalies*; or
* *Capacities › Consumption Anomalies* (same screen; see [Capacities (menu)](/en/power-monitor/capacidades.md)).

The screen is available to **all profiles** and respects the user's workspace scope. Saving the detection settings and reprocessing the history are actions exclusive to **Administrators** (for other profiles, the buttons do not appear).

<figure><picture><source srcset="/files/Dvstc3chfcUp2oQaGUf7" media="(prefers-color-scheme: dark)"><img src="https://3938213054-files.gitbook.io/~/files/v0/b/gitbook-x-prod.appspot.com/o/spaces%2FH2bFRBmIfyK3kwVKbldl%2Fuploads%2Fgit-blob-0d84ee77836bd548d1332c4b9ec2f3014eeb7e07%2Fpm-monitoramento-anomalias-consumo-en.png?alt=media" alt="Consumption Anomalies screen with the summary by severity and the anomalies table"></picture><figcaption><p>Consumption Anomalies, Anomalies tab</p></figcaption></figure>

## What it is for

* **Be warned before the bill arrives:** a refresh that normally consumes 50 thousand Capacity Units (s) and today has already consumed 300 thousand appears as an anomaly and can generate an email.
* **Find the culprit operation:** the item row expands to show which of its operations are outside the pattern.
* **Track new items** that do not have enough history yet (**New Items** tab).
* **Adjust the sensitivity** to the size of your environment, avoiding noise on small items.

The screen has four tabs: **Anomalies**, **New Items**, **Settings** and **Reprocessing**. The tabs show a counter: how many anomalies were loaded, how many new items exist and how many reprocessing jobs are in progress.

## Features

### Summary by severity

**What it is:** the strip of five cards at the top of the **Anomalies** tab, calculated over the anomalies of the loaded period and minimum severity.

**What it is for:** know at a glance how many serious anomalies exist and how much excess consumption they represent, before looking item by item.

<figure><picture><source srcset="/files/zDLU7bI1IetHfWUFpRtI" media="(prefers-color-scheme: dark)"><img src="https://3938213054-files.gitbook.io/~/files/v0/b/gitbook-x-prod.appspot.com/o/spaces%2FH2bFRBmIfyK3kwVKbldl%2Fuploads%2Fgit-blob-8cc5833bd902197c13f37967d9aef4489ce6ad1a%2Fpm-monitoramento-anomalias-consumo-resumo-severidade-en.png?alt=media" alt="Cards Extreme (above 200%), Critical (60–200%), High, Warning and Deviated Capacity Units (s)"></picture><figcaption><p>Summary by severity</p></figcaption></figure>

| Card                            | What it counts                                                                                                  |
| ------------------------------- | --------------------------------------------------------------------------------------------------------------- |
| **Extreme (>200%)**             | *Critical* anomalies with a deviation above 200%, with up to two item types involved (or *none in the period*). |
| **Critical (60–200%)**          | *Critical* anomalies with a deviation of up to 200% and their average deviation.                                |
| **High**                        | Number of anomalies with *High* severity.                                                                       |
| **Warning**                     | Number of anomalies with *Warning* severity.                                                                    |
| **Deviated Capacity Units (s)** | Sum of the consumption above expected, compared to the total expected (*vs baseline*).                          |

**How to use:** choose the period and the minimum severity in the toolbar; the cards follow what was loaded. The name search does not change the cards.

**How it works:** Capacity Units values are abbreviated (*k* for thousands, *M* for millions). *Info* and *Observation* anomalies do not have their own card, but are included in the **Deviated Capacity Units (s)** total.

### Period

**What it is:** the **Today**, **24h**, **7d**, **30d** and **Custom** buttons in the toolbar.

**What it is for:** look only at the current day during an incident, or at the week and month to understand how often anomalies recur.

<figure><picture><source srcset="/files/c6r4qWSlZJ0nAIg1AMcV" media="(prefers-color-scheme: dark)"><img src="https://3938213054-files.gitbook.io/~/files/v0/b/gitbook-x-prod.appspot.com/o/spaces%2FH2bFRBmIfyK3kwVKbldl%2Fuploads%2Fgit-blob-b3ad97fefa4fc178d01a582b7edb9e630f555d9f%2Fpm-monitoramento-anomalias-consumo-periodo-personalizado-en.png?alt=media" alt="Toolbar with the Custom period selected and the From and To fields"></picture><figcaption><p>Custom period</p></figcaption></figure>

**How to use:**

1. Click **Today**, **24h**, **7d** or **30d**. The list is reloaded immediately.
2. For a specific range, click **Custom**, fill in the **From** and **To** fields and click **Apply**.

**How it works:** the screen opens with **7d** (today and the previous 6 days). **24h** considers yesterday and today; **30d**, today and the previous 29 days. The days follow the organization's calendar: the "today" of the buttons comes from the organization's time zone, not from your browser's clock, so the current day is not cut off near midnight.

### Minimum severity

**What it is:** the **Min. Severity** list, which starts at **All**.

**What it is for:** hide the mild anomalies and focus on what requires action.

**How to use:**

1. Open the **Min. Severity: All** list and choose the minimum severity (*Info*, *Observation*, *Warning*, *High* or *Critical*).
2. Click **Reload** to apply the choice (changing the period also applies the filter).

**How it works:** the screen starts considering the chosen severity and the higher ones. The change only takes effect on the next query, which is why you need to reload.

### Item search and Reload

**What it is:** the **Search item...** field and the **Reload** button in the toolbar.

**What it is for:** quickly find a known item in the list and query the server again to see anomalies detected after the screen was opened.

<figure><picture><source srcset="/files/uzUVTLt5OaxNqihuF07C" media="(prefers-color-scheme: dark)"><img src="https://3938213054-files.gitbook.io/~/files/v0/b/gitbook-x-prod.appspot.com/o/spaces%2FH2bFRBmIfyK3kwVKbldl%2Fuploads%2Fgit-blob-75c5a38ba30798be11a9572061b5e7159a4689f8%2Fpm-monitoramento-anomalias-consumo-barra-ferramentas-en.png?alt=media" alt="Toolbar with the periods, Min. Severity, Search item..., Reload, Explain with AI and Reprocess history"></picture><figcaption><p>Anomalies tab toolbar</p></figcaption></figure>

**How to use:**

1. Type part of the name in the **Search item...** field. The table is filtered instantly.
2. Click **Reload** to query the chosen period and severity again.

**How it works:** the search is done within the result already loaded, by item name, and does not change the summary cards. While a search is active, the table footer shows *(filtered from N records)*.

### Anomalies table

**What it is:** the list of items with consumption above expected in the period, sorted from the largest to the smallest deviation.

**What it is for:** see which items exceeded the pattern, by how much and when this was detected.

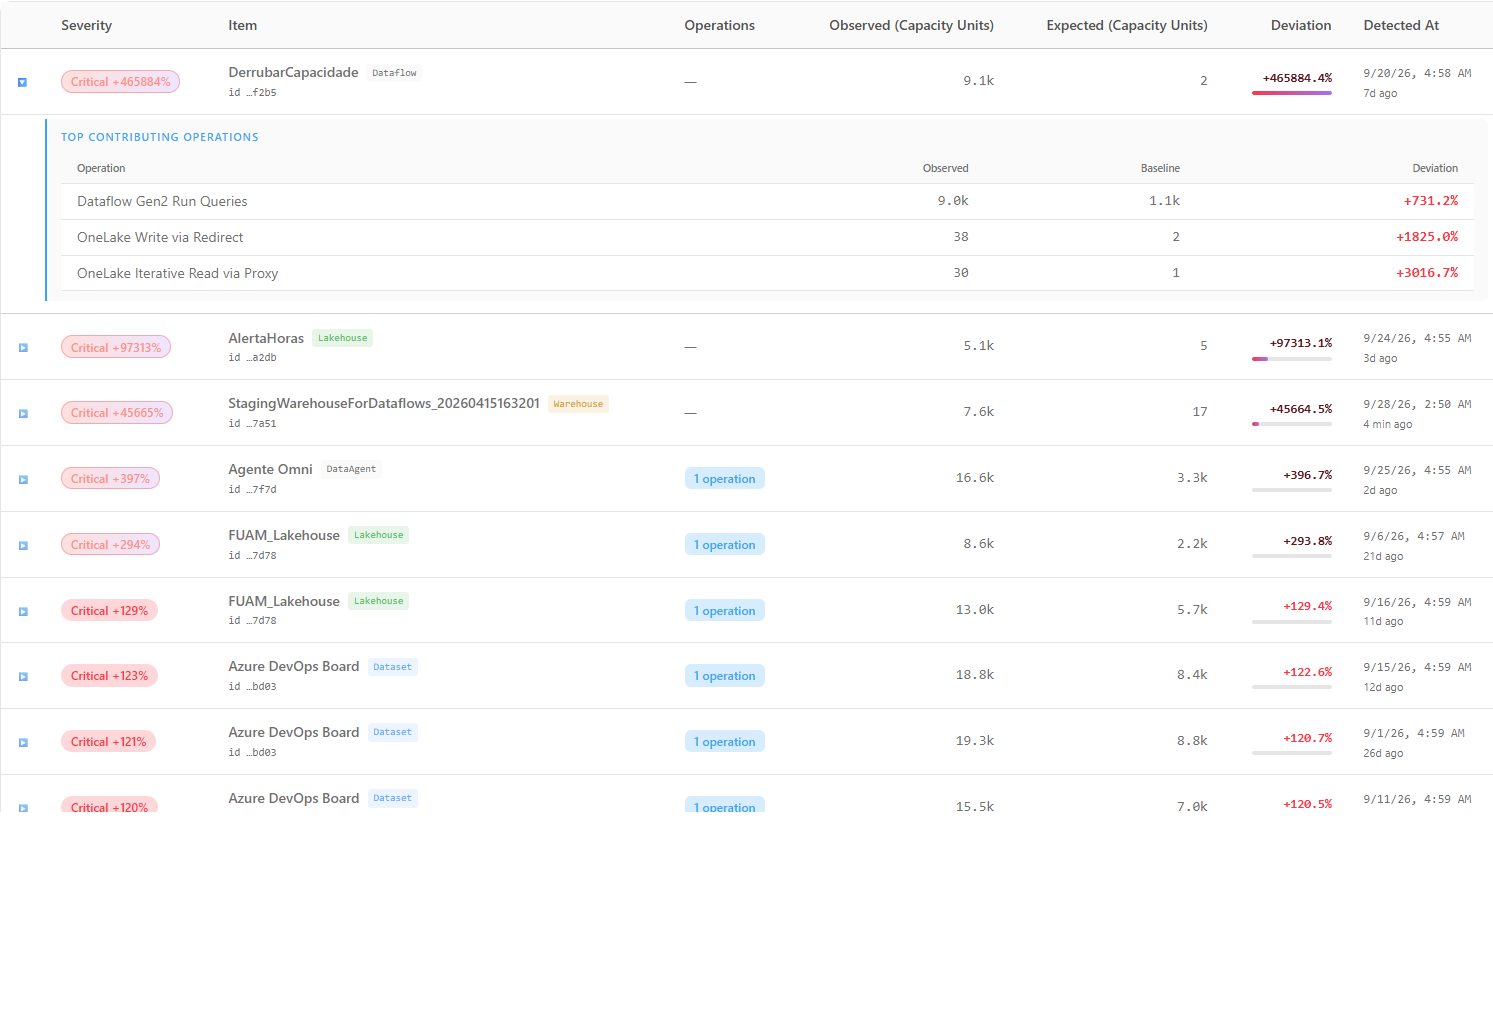
| Column                        | Description                                                                                                                                                    |
| ----------------------------- | -------------------------------------------------------------------------------------------------------------------------------------------------------------- |
| **Severity**                  | Colored badge with the severity and the deviation (for example, *High +52%*). *Critical* deviations above 200% get a highlighted badge.                        |
| **Item**                      | Name and type of the item, with the last characters of the identifier.                                                                                         |
| **Operations**                | How many operations of this item also have an anomaly (for example, *2 operations*). When the anomaly is from a single operation, it shows the operation name. |
| **Observed (Capacity Units)** | Accumulated consumption for the day.                                                                                                                           |
| **Expected (Capacity Units)** | Baseline: daily average over the last 7 complete days or, when they are not enough, over the last 30.                                                          |
| **Deviation**                 | Percentage above expected, with a bar proportional to the largest deviation in the list (highlighted above 200%).                                              |
| **Detected At**               | Date and time the anomaly was recorded, and how long ago (for example, *2h ago*).                                                                              |

**How to use:** read the first rows (those with the largest deviation) and compare **Observed** with **Expected** to size the impact. When there is nothing in the period, the table displays **No anomalies found for this period.**

**How it works:** the footer shows how many items have anomalies in the current view (for example, *3 items with anomalies*). Each row is an item; the anomalies of operations of the same item on the same day are grouped within it.

### Operation details (expanded row)

**What it is:** the panel that opens when you click a row in the table.

**What it is for:** find out which operation of the item (a query, a refresh, a run) caused the excess.

<figure><picture><source srcset="/files/iOHqEwMEO6Pky4UMS8tC" media="(prefers-color-scheme: dark)"><img src="https://3938213054-files.gitbook.io/~/files/v0/b/gitbook-x-prod.appspot.com/o/spaces%2FH2bFRBmIfyK3kwVKbldl%2Fuploads%2Fgit-blob-98da3856d6036eb158a8156d98c9d376e8b85e3d%2Fpm-monitoramento-anomalias-consumo-linha-expandida-en.png?alt=media" alt="Anomalies table row expanded with the operations panel"></picture><figcaption><p>Expanded row with the item's operations</p></figcaption></figure>

**How to use:**

1. Click the item row (the **▶** arrow on the left indicates it can be expanded).
2. Read the panel that appears right below.
3. Click the same row again to collapse it. Only one row is expanded at a time.

**How it works:** at the top of the panel, the line *Baseline: average of the last 7 days (7 days with data)* (or *of the last 30 days*) tells which window produced the **Expected** value and how many days with data it had. Below it, the panel shows one of three things:

* **Operations with anomaly**: when operations of the item were also classified as anomalies, with the **Operation**, **Severity**, **Observed**, **Expected** and **Deviation** of each one;
* **Top Contributing Operations**: when only the item had an anomaly, the up to 5 operations that contributed most to the excess, with **Observed**, **Baseline** and **Deviation**;
* *No contributing operations recorded.*, when there is no per-operation detail.

### Explain with AI

**What it is:** the **Explain with AI** button, which generates a natural-language analysis of all anomalies in the current view, with patterns, likely causes and what to do.

**What it is for:** save time when triaging many anomalies or prepare a summary for the team.

**How to use:**

{% stepper %}
{% step %}

### Define the view

Choose the period and the minimum severity (and click **Reload**). The analysis considers all loaded anomalies; the name search does not interfere.
{% endstep %}

{% step %}

### Click Explain with AI

The button is disabled when there are no anomalies in the view or when AI features are not available (no provider configured in *Settings › AI* or monthly AI spending limit reached); hover over it to see the reason.
{% endstep %}

{% step %}

### Read the analysis

The **Anomaly analysis** modal opens immediately and the button displays **Analyzing…** while the response is generated, which can take a few dozen seconds. If generation fails, the error appears inside the modal itself.
{% endstep %}
{% endstepper %}

**How it works:** it uses the AI provider configured in [Settings](/en/power-monitor/configuracoes.md) (**AI** tab) and consumes the organization's monthly AI budget. The analysis is generated in the interface language. The text is generated by AI: review it before acting.

### Reprocess history (Administrators)

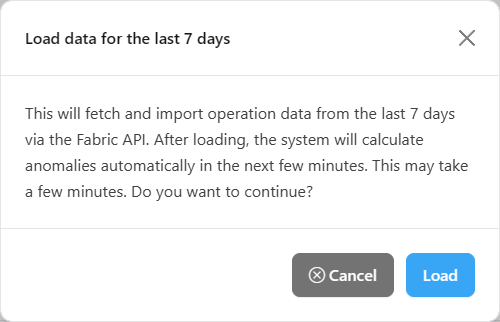
**What it is:** the **Reprocess history** button, in the **Anomalies** tab toolbar, which fetches the operations from the last 7 days again from the Capacity Metrics App and then recalculates the anomalies.

**What it is for:** feed detection in newly configured environments or when consumption data is missing for the last few days.

<figure><picture><source srcset="/files/OcdHQj51mYXNVQTRk1gS" media="(prefers-color-scheme: dark)"><img src="https://3938213054-files.gitbook.io/~/files/v0/b/gitbook-x-prod.appspot.com/o/spaces%2FH2bFRBmIfyK3kwVKbldl%2Fuploads%2Fgit-blob-b0373f06fc9aa068bea3754b7c578a9143346ff8%2Fpm-monitoramento-anomalias-consumo-modal-reprocessar-historico-en.png?alt=media" alt="Load data for the last 7 days modal with the Load and Cancel buttons"></picture><figcaption><p>Confirmation of the load of the last 7 days</p></figcaption></figure>

**How to use:** prerequisite: **Administrator** profile.

{% stepper %}
{% step %}

### Click Reprocess history

In the **Anomalies** tab toolbar, click **Reprocess history**.
{% endstep %}

{% step %}

### Confirm the load

The **Load data for the last 7 days** modal explains that the operations from the last 7 days will be imported and that the anomalies will be recalculated afterward. Click **Load** to confirm or **Cancel** to give up.
{% endstep %}

{% step %}

### Follow the processing

The message **Load started in background. You can navigate freely.** confirms the start. Progress appears on the **Reprocessing** tab.
{% endstep %}
{% endstepper %}

**How it works:** the load runs in the background; you can leave the screen. Users without an administrator profile receive *Permission denied. Only administrators can perform this action.*

### New Items tab

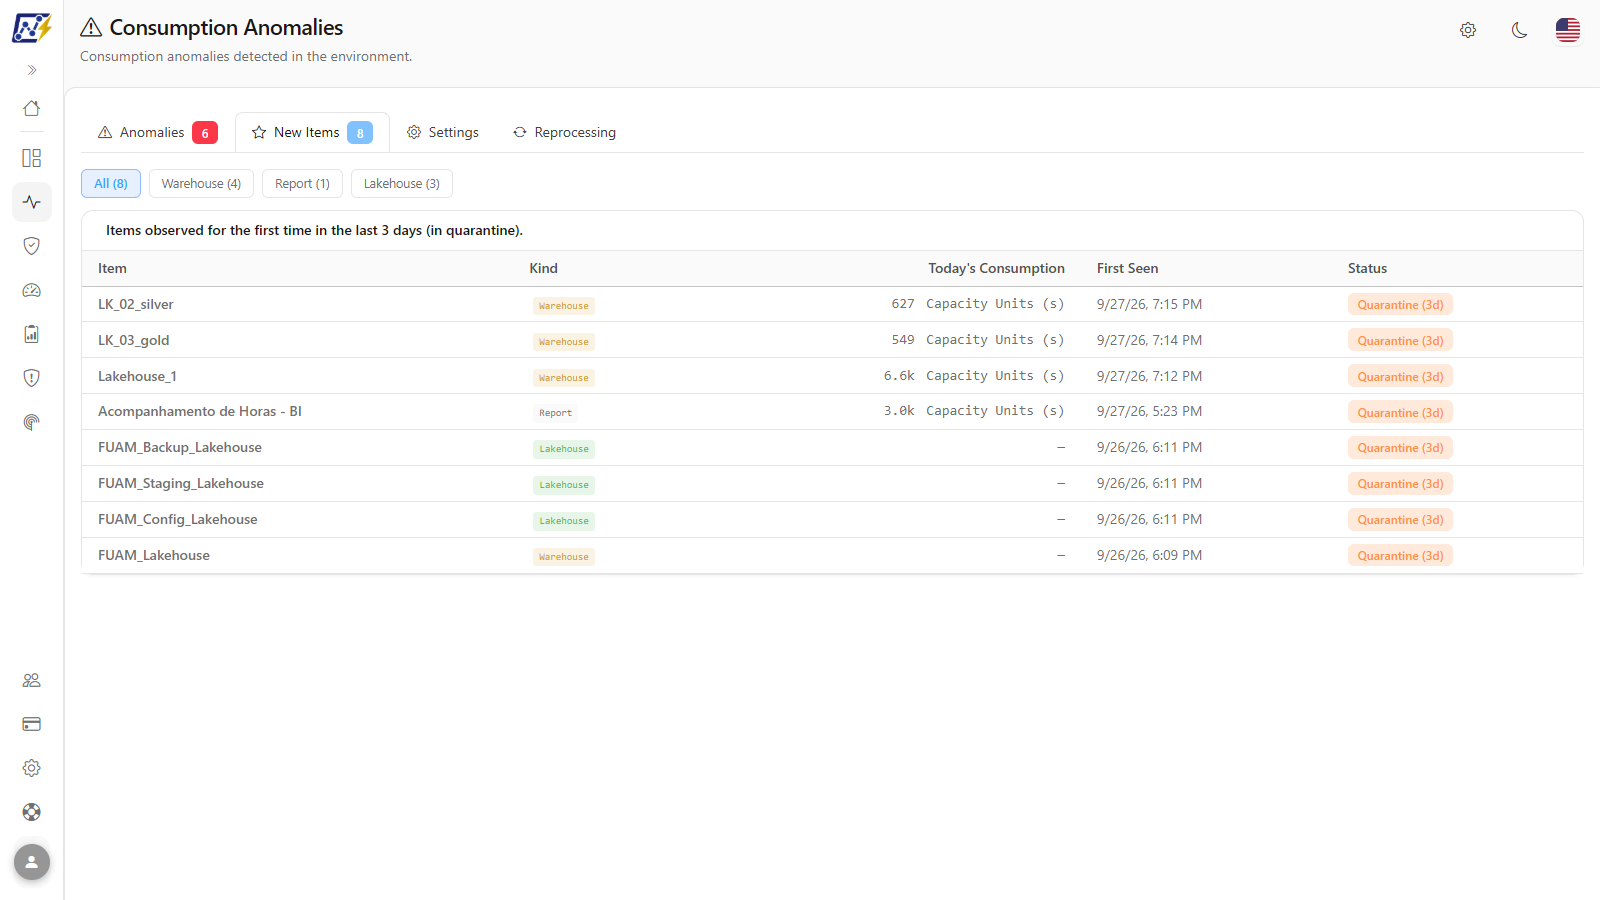
**What it is:** the list of items observed for the first time recently that are still in (or have just left) **quarantine**, a period during which they are not evaluated because they do not have history to compare with yet.

**What it is for:** track the consumption of newly published items, which do not generate anomalies yet.

<figure><picture><source srcset="/files/ngkx4tvh4g507f3ATd4O" media="(prefers-color-scheme: dark)"><img src="https://3938213054-files.gitbook.io/~/files/v0/b/gitbook-x-prod.appspot.com/o/spaces%2FH2bFRBmIfyK3kwVKbldl%2Fuploads%2Fgit-blob-99fdf3856337fd93eeee0bc3a5d263bad54fa467%2Fpm-monitoramento-anomalias-consumo-itens-novos-en.png?alt=media" alt="New Items tab with the type filter buttons and the table of items in quarantine"></picture><figcaption><p>New Items tab</p></figcaption></figure>

**How to use:**

1. Click the **New Items** tab.
2. Use the type buttons (**All (n)** and one button per item type, with the count) to filter the list.
3. Check **Item**, **Kind**, **Today's Consumption**, **First Seen** and **Status**: *Quarantine (Nd)* while the item is not yet evaluated, or *Active* when it is already part of detection.

**How it works:** the list header states the configured quarantine period (for example, *Items observed for the first time in the last 3 days (in quarantine).*). The period is defined on the **Settings** tab.

### Settings tab: notifications

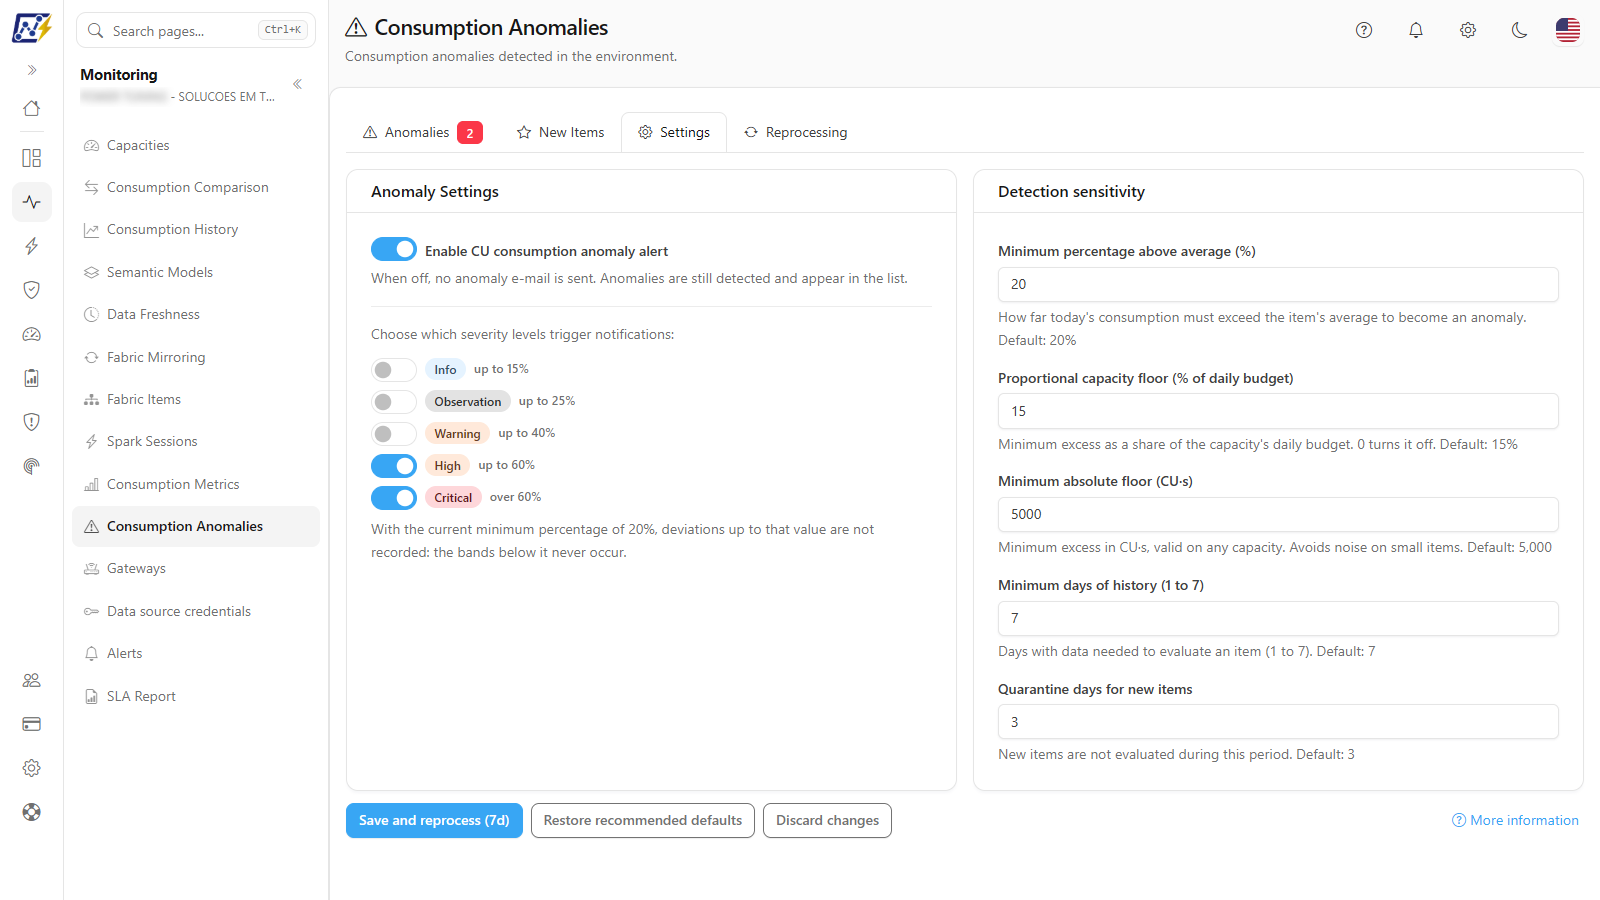
**What it is:** the **Anomaly Settings** panel, with the **Enable CU consumption anomaly alert** switch and the choice of **which levels trigger notifications**.

**What it is for:** decide whether anomalies generate emails and from which severity, so as not to flood the team with minor notices.

<figure><picture><source srcset="/files/WjRJZjeEDulfqHUtznst" media="(prefers-color-scheme: dark)"><img src="https://3938213054-files.gitbook.io/~/files/v0/b/gitbook-x-prod.appspot.com/o/spaces%2FH2bFRBmIfyK3kwVKbldl%2Fuploads%2Fgit-blob-4d3d16943987f8bcbb51c39703a4f2c4e5d0d38a%2Fpm-monitoramento-anomalias-consumo-configuracoes-en.png?alt=media" alt="Settings tab of Consumption Anomalies"></picture><figcaption><p>Anomaly Settings and Detection sensitivity</p></figcaption></figure>

**How to use:** prerequisite for saving: **Administrator** profile. Other profiles see the notice *Only organization administrators can change these settings...* and can review the values and use the simulator in **More information**.

1. Click the **Settings** tab.
2. Turn on **Enable CU consumption anomaly alert**.
3. In **Choose which severity levels trigger notifications:**, turn on the severities that should generate email: *Info* (up to 15%), *Observation* (up to 25%), *Warning* (up to 40%), *High* (up to 60%) and *Critical* (over 60%). The severities are only available with the alert enabled.
4. Click **Save and reprocess (7d)** (see below).

**How it works:** by default, only **High** and **Critical** notify. With the alert off, no anomaly email is sent, but anomalies are still detected and appear in the list. The emails go to the organization's alert recipients (see *Frequency and notifications*, below). If the **Minimum percentage above average** is greater than 15%, a note warns that the bands below it never occur.

### Settings tab: detection sensitivity

**What it is:** the **Detection sensitivity** panel, with the parameters that decide when an excess becomes an anomaly. Each field shows a short hint and the default value right below it.

**What it is for:** adapt detection to the size of the environment and of the capacities, avoiding noise on small items, irrelevant deviations on large capacities and false alarms on newly created items.

| Parameter                                           | Default | Description                                                                                                                                                                                                                                          |
| --------------------------------------------------- | ------- | ---------------------------------------------------------------------------------------------------------------------------------------------------------------------------------------------------------------------------------------------------- |
| **Minimum percentage above average (%)**            | 20      | How far today's consumption must exceed the item's average to become an anomaly. Raising it makes the alert more selective; lowering it makes it more sensitive and adds noise. Range from 1 to 1000.                                                |
| **Proportional capacity floor (% of daily budget)** | 15      | Minimum excess, as a share of the capacity daily budget (SKU CU units × 86,400 s). It is the minimum excess, not the total consumption of the item. **0** turns the proportional floor off and only the absolute floor applies. Range from 0 to 100. |
| **Minimum absolute floor (CU·s)**                   | 5,000   | Minimum excess in CU·s, valid on any capacity, including small ones or those with an unknown SKU. Avoids noise on small items. Minimum of 0.                                                                                                         |
| **Minimum days of history (1 to 7)**                | 7       | Days with data needed for the average to be reliable. The rule applies to the last 7 days and, if that is not enough, to the last 30. Without that many days in either window, the item is not evaluated.                                            |
| **Quarantine days for new items**                   | 3       | Days during which a newly discovered item is not evaluated. **0** evaluates new items immediately. Minimum of 0.                                                                                                                                     |

The **effective floor** of each capacity is the larger of the absolute floor and the proportional floor. With the defaults, the proportional floor is 25,920 CU·s on an F2, 103,680 on an F8, 829,440 on an F64 and 3,317,760 on an F256; the 5,000 absolute floor only prevails when the SKU is unknown or the proportional floor is off.

**How to use:** prerequisite: **Administrator** profile.

{% stepper %}
{% step %}

### Adjust the parameters

Change the fields according to the size of your environment. Invalid fields are highlighted with the accepted range, and saving is blocked with *Fix the highlighted fields before saving.* To go back to the recommended values, click **Restore recommended defaults** (the fields are filled in, but only take effect after saving). To undo what has not been saved yet, click **Discard changes**.
{% endstep %}

{% step %}

### Check More information (optional)

Click **More information** to open the **How the consumption anomaly alert works** modal (see below) and test the typed values in the simulator before saving.
{% endstep %}

{% step %}

### Save and reprocess

Click **Save and reprocess (7d)**. The screen confirms with **Settings saved.** and **Reprocessing started. Anomalies will be recalculated in the background.**
{% endstep %}

{% step %}

### Follow the recalculation

While the recalculation runs, the tab shows the **Recalculating anomalies** panel with the status and the estimated progress. Click **Track process** to go to the **Reprocessing** tab.
{% endstep %}
{% endstepper %}

**How it works:** saving stores the notification and sensitivity settings together and recalculates the anomalies of the last 7 days with the new parameters. When it finishes, the **Recalculating anomalies** panel reports that the list was updated (or that the recalculation failed, pointing to the reprocessing tab). The same form appears in *Settings › Monitoring*, in the [Consumption anomalies](/en/power-monitor/configuracoes/monitoramento.md#consumption-anomalies) card.

### More information

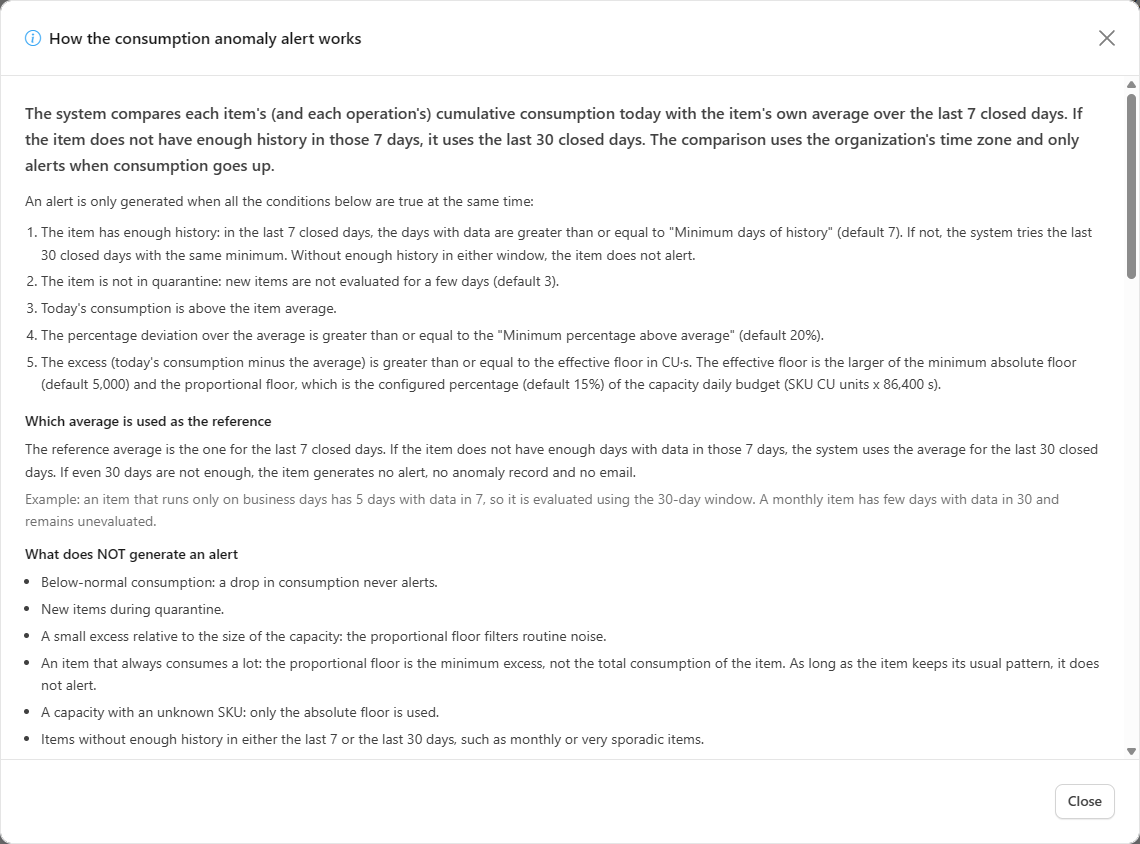
**What it is:** the **More information** button, next to the save buttons, which opens the **How the consumption anomaly alert works** modal.

**What it is for:** understanding the full rule and simulating the effect of the typed values before saving, without sending anything to the server.

<figure><picture><source srcset="/files/h9KhcGyvTnCF60seKfwk" media="(prefers-color-scheme: dark)"><img src="https://3938213054-files.gitbook.io/~/files/v0/b/gitbook-x-prod.appspot.com/o/spaces%2FH2bFRBmIfyK3kwVKbldl%2Fuploads%2Fgit-blob-d2748e4647cea0a387c56527e7b7e829e875953e%2Fpm-monitoramento-anomalias-consumo-mais-informacoes-en.png?alt=media" alt="How the consumption anomaly alert works modal with the explanation, the Effective floor by SKU and the Example simulator"></picture><figcaption><p>More information modal</p></figcaption></figure>

**How it works:** the modal brings together:

* **How the alert works**: the conditions that must be true at the same time, **Which average is used as the reference** (7 complete days, or 30 when 7 are not enough), **What does NOT generate an alert** and the **Severity by percentage above average** table;
* **What each parameter does**: the long explanation of each field, with the default value;
* **Effective floor by SKU**: for F2 to F256, the **Daily budget (CU·s)**, the **Proportional floor (CU·s)**, the **Effective floor (CU·s)** and the **Floor source** (**Proportional** or **Absolute**), calculated with the typed values, not yet saved;
* **Example simulator**: choose the **Capacity SKU** and enter the **Item average (CU·s)** and **Today's consumption (CU·s)**. The result says *YES: this consumption would generate an alert.* or *NO: this consumption would not generate an alert.*, shows each condition as **Passed** or **Failed**, the resulting severity and whether an email would be sent.

### Reprocessing tab

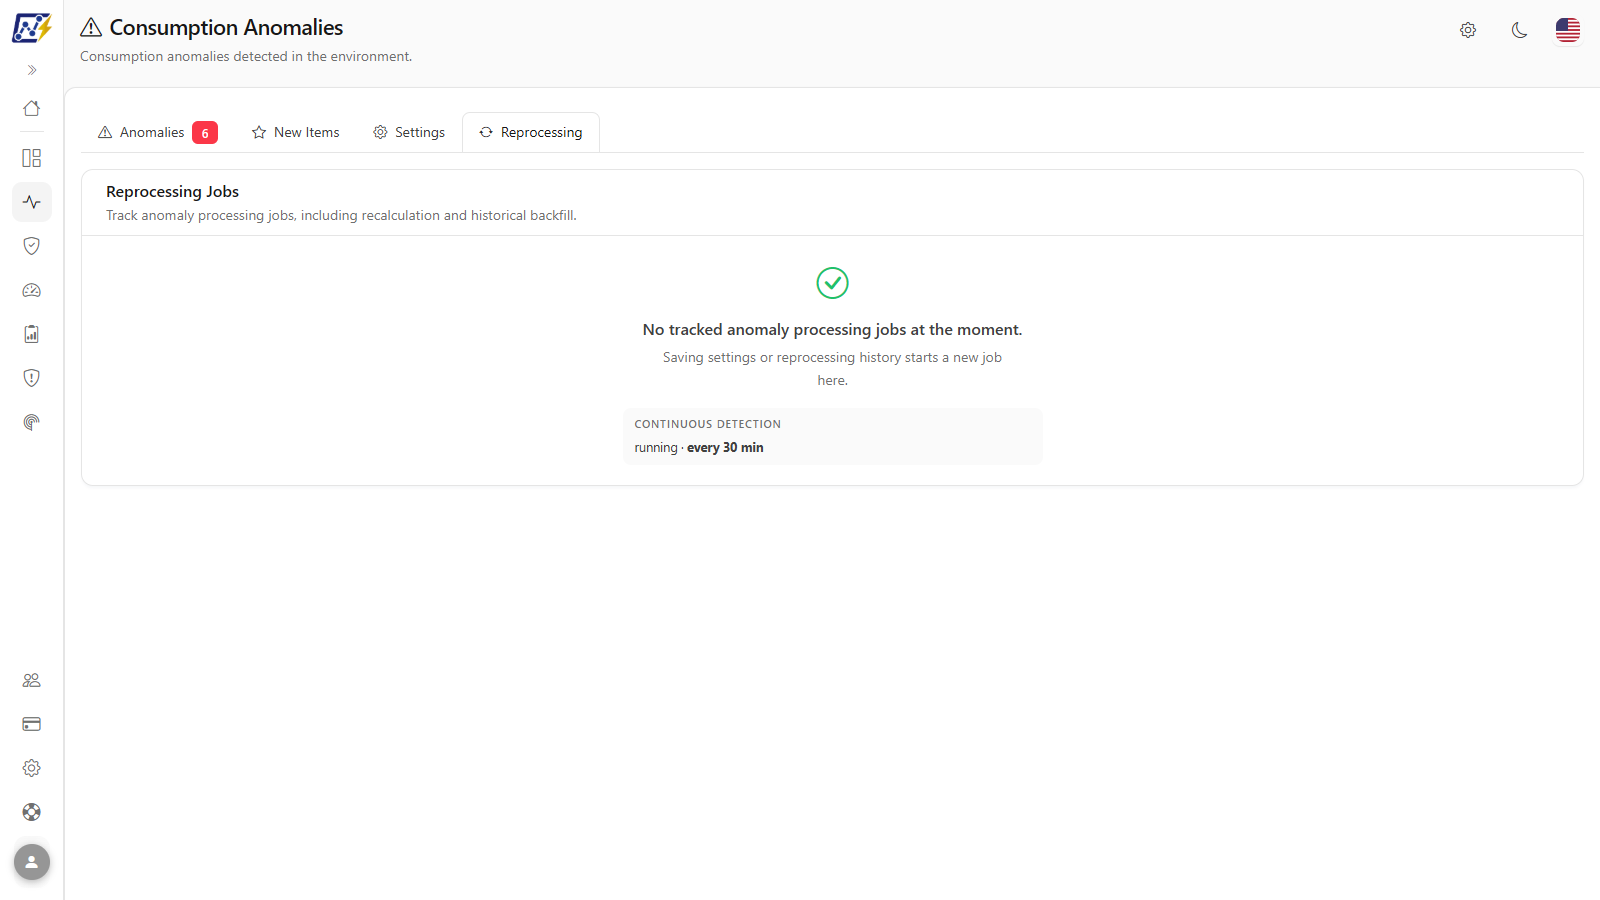
**What it is:** the **Reprocessing Jobs** panel, with the tracked anomaly recalculations (after saving settings or reprocessing the history).

**What it is for:** know whether a recalculation or a historical load has already finished and whether it succeeded.

<figure><picture><source srcset="/files/dutYnGVhbKCTSsq4MhVi" media="(prefers-color-scheme: dark)"><img src="https://3938213054-files.gitbook.io/~/files/v0/b/gitbook-x-prod.appspot.com/o/spaces%2FH2bFRBmIfyK3kwVKbldl%2Fuploads%2Fgit-blob-56671dea7af08865774ddbc88044bd7f1cb89742%2Fpm-monitoramento-anomalias-consumo-reprocessamento-en.png?alt=media" alt="Reprocessing tab with the list of anomaly recalculation jobs"></picture><figcaption><p>Reprocessing Jobs</p></figcaption></figure>

**How to use:**

1. Click the **Reprocessing** tab (the tab counter indicates how many jobs are in progress).
2. Each job shows the state (*Queued*, *Running*, *Completed*, *Failed* or *Cancelled*), **Started**, **Finished** and the estimated progress, with a progress bar while it runs.
3. If the state is *Failed*, read the error message displayed on the item itself and, if necessary, trigger a new reprocessing.

**How it works:** the list refreshes on its own while a job is in progress. When no job is being tracked, the tab shows *No tracked anomaly processing jobs at the moment.* and the **Continuous detection** panel (*every 5 min*), reminding you that periodic detection keeps running regardless of reprocessing.

## Rules and behavior

### How an anomaly is detected

For each item (and for each operation of the item), today's accumulated consumption is compared with the item's own baseline. The anomaly is only recorded when **all** the conditions below are met:

1. The item has **enough history**: in the last 7 complete days, the days with data are at least the **Minimum days of history** (7 by default). If not, the same requirement applies to the last 30 complete days.
2. The item is not in new item **quarantine** (3 days by default).
3. Today's consumption is **above** the baseline (below-normal consumption never generates an anomaly).
4. The deviation over the baseline is greater than or equal to the **Minimum percentage above average** (20% by default).
5. The excess (today's consumption minus the baseline) is greater than or equal to the **effective floor**: the larger of the **Minimum absolute floor** (5,000 CU·s by default) and the **Proportional capacity floor** (15% of the daily budget by default). On a capacity with an unknown SKU, only the absolute floor applies.

### Which average is used as the baseline

* The baseline is the average of the **last 7 complete days**, in the organization's time zone (the current day never counts).
* If the item does not have enough days with data in those 7 days, the baseline becomes the average of the **last 30 complete days**, with the same day requirement.
* If even 30 days are not enough, the item **generates no alert, no anomaly record and no email**. This is the case for monthly or very sporadic items.
* Example: an item that runs only on business days has 5 days with data in 7, so, with the default of 7 minimum days, it is evaluated using the 30-day window.

### Severity

| Deviation over the baseline | Severity                                                         |
| --------------------------- | ---------------------------------------------------------------- |
| Up to 15%                   | **Info**                                                         |
| Up to 25%                   | **Observation**                                                  |
| Up to 40%                   | **Warning**                                                      |
| Up to 60%                   | **High**                                                         |
| Over 60%                    | **Critical** (above 200% is counted as *Extreme* in the summary) |

With the default **Minimum percentage above average** of 20%, deviations of up to 20% are not recorded: the *Info* band and part of *Observation* no longer appear.

### Frequency and notifications

* **Baseline:** recalculated once a day (overnight), with the 7 complete days before the current day (or the 30, when the 7 are not enough).
* **Detection:** automatically reevaluated **every 5 minutes** for the current day, as new operations arrive from the Capacity Metrics App.
* **Notifications:** when enabled, each anomaly of the checked severities generates **one email**, sent to the organization's alert recipients (*Settings › Notifications*), respecting each recipient's per-workspace alert scope. If the same anomaly **escalates in severity** on the same day (for example, from *Warning* to *High*), a new notice is sent.
* **Local day:** "today", the baseline and the quarantine use the organization's time zone.
* **New installations:** the consumption anomaly alert is already on in organizations created from October 7, 2026 onwards.

{% hint style="info" %}
An anomaly indicates consumption outside the pattern, not necessarily an error. Increased data volume, new users or an extraordinary load also generate anomalies. If the change is permanent, the baseline adjusts itself within 7 days.
{% endhint %}

## Frequently asked questions

<details>

<summary>A model had its data volume doubled on purpose and is generating anomalies every day.</summary>

The baseline is the average of the last 7 complete days: as the days with the new volume enter the window, the deviation decreases and the anomalies stop. To reduce the noise in the meantime, an administrator can increase the **Minimum percentage above average** or the **Minimum absolute floor**, or turn off the lower severities in the notifications.

</details>

<details>

<summary>A new item consumed a lot and did not appear as an anomaly.</summary>

New items stay in quarantine (3 days by default) and need enough days with data in the last 7 complete days (or in the last 30). Track them on the **New Items** tab.

</details>

<details>

<summary>I changed the Min. Severity and the list did not change.</summary>

The severity is applied on the next query. Click **Reload** or choose a period.

</details>

<details>

<summary>The screen shows nothing.</summary>

Confirm that there are capacities with active monitoring and at least a few days of collected history. In newly configured environments, an administrator can use **Reprocess history** to load the last 7 days.

</details>

## Related pages

* [Consumption History](/en/power-monitor/monitoramento/historico-de-consumo.md)
* [Consumption Comparison](/en/power-monitor/monitoramento/comparativo-de-consumo.md)
* [Consumption Metrics](/en/power-monitor/monitoramento/metricas-de-consumo.md)
* [Alerts](/en/power-monitor/monitoramento/alertas.md)
* [Settings](/en/power-monitor/configuracoes.md)
* [Capacities (menu)](/en/power-monitor/capacidades.md)


---

# Agent Instructions
This documentation is published with GitBook. GitBook is the documentation platform designed so that both humans and AI agents can read, navigate, and reason over technical content effectively. Learn more at gitbook.com.

## Querying This Documentation
If you need additional information that is not directly available in this page, you can query the documentation by asking a question.

Perform an HTTP GET request on the following URL with the `ask` and `goal` query parameters:

```
GET https://docs.powermonitor.com.br/en/power-monitor/monitoramento/anomalias-de-consumo.md?ask=<question>&goal=<user_goal>
```

`ask` is the immediate question: it should be specific, self-contained, and written in natural language.
`goal` is what the user is ultimately trying to achieve, the reason they need the answer. Sharing it helps GitBook give you a better, more relevant answer. A goal is most helpful when it describes the outcome the user wants rather than restating the question. For example, with `ask=how do I create an API token`, a goal like `automate deployments from our CI pipeline` lets GitBook tailor the answer to that use case.

The response will contain a direct answer to the question and relevant excerpts and sources from the documentation.

Use this mechanism when the answer is not explicitly present in the current page, you need clarification or additional context, or you want to retrieve related documentation sections.