> For the complete documentation index, see [llms.txt](https://docs.powermonitor.com.br/llms.txt). Markdown versions of documentation pages are available by appending `.md` to page URLs; this page is available as [Markdown](https://docs.powermonitor.com.br/en/power-monitor/monitoramento/atualizacao-de-dados.md).

# Data Freshness

Monitor whether the tables of your semantic models are receiving new data within the expected time and get an email when they fall behind or lose row volume.

The **Data Freshness** screen checks whether the **content** of your semantic models is up to date, not just whether the refresh finished. For each chosen table, Power Monitor queries the **most recent value of a date/time column** (for example, `SaleDate` or `LoadDate`), compares that value with the current time and notifies the recipients when the difference exceeds the defined tolerance.

**How to access:** menu *Monitoring › Data Freshness*.

**Who can access:** all profiles see the screen and the results. **Creating, editing, enabling/disabling, deleting, "Check now" (single or bulk), "Send alert" and the permission diagnostic are actions exclusive to Administrators.** Users with visibility restricted to some workspaces only see the monitors for models in those workspaces. Like the other screens, this page can also be blocked for specific users in user management.

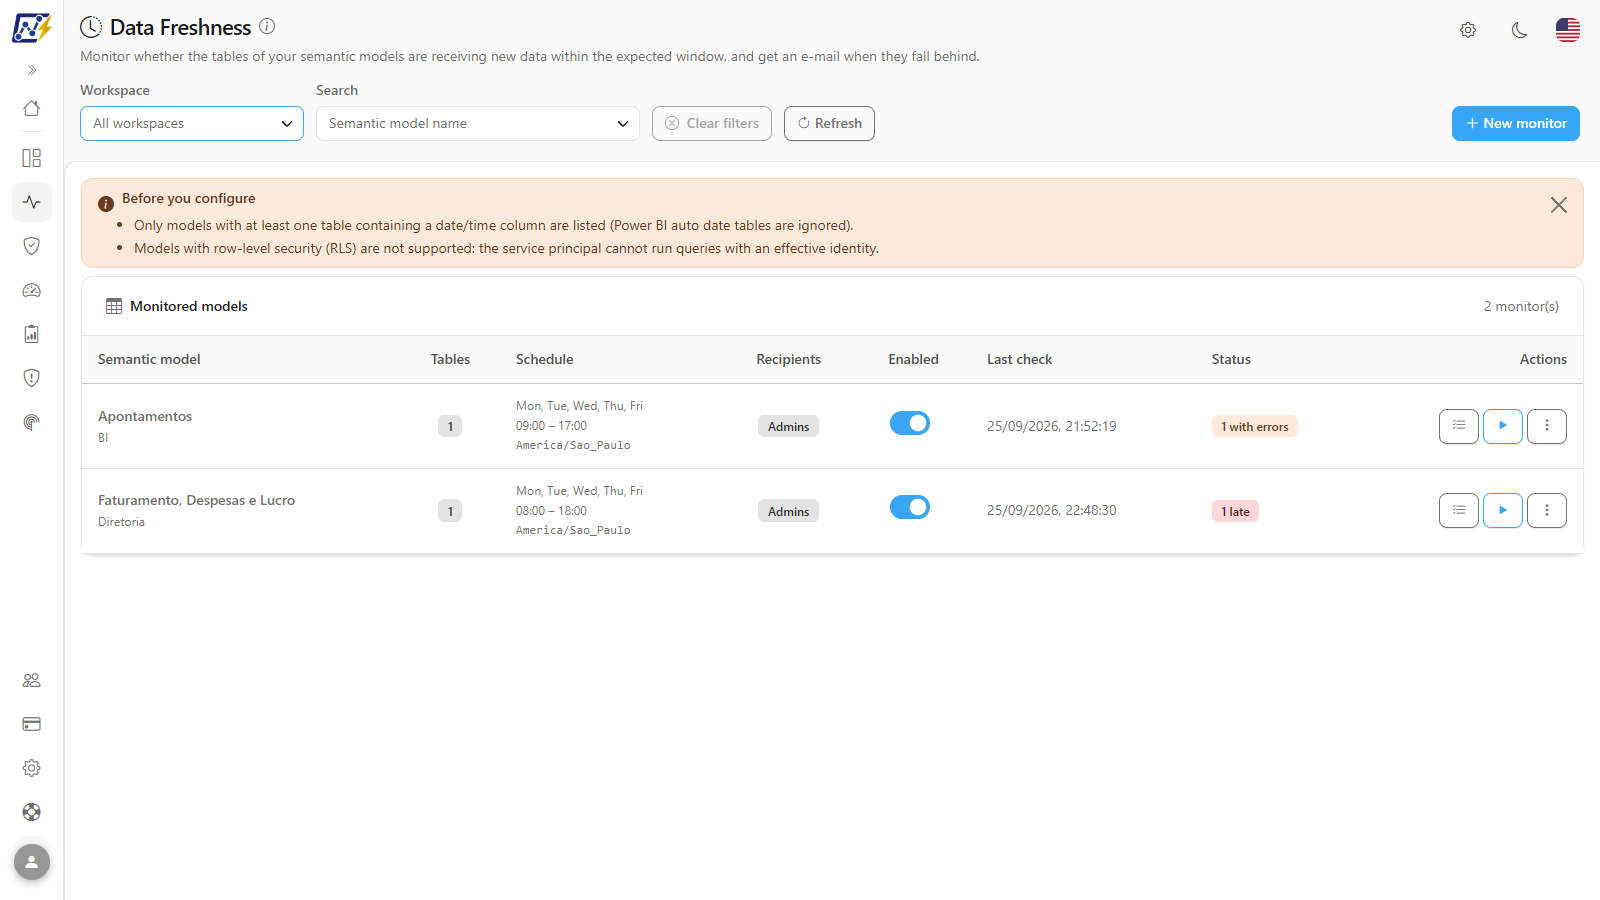
<figure><picture><source srcset="/files/DBnTmia1OfMhPAQITSi6" media="(prefers-color-scheme: dark)"><img src="https://3938213054-files.gitbook.io/~/files/v0/b/gitbook-x-prod.appspot.com/o/spaces%2FH2bFRBmIfyK3kwVKbldl%2Fuploads%2Fgit-blob-760a640b725f15f6f421ffdc298f96c39600a490%2Fpm-monitoramento-atualizacao-dados-visao-geral-en.png?alt=media" alt="Data Freshness screen with the Before you configure notice and the list of monitored models"></picture><figcaption><p>Data Freshness screen with the list of monitored models</p></figcaption></figure>

## What it is for

A refresh can finish **successfully** and still bring old data: the source was not loaded, an upstream pipeline failed silently, a partition was not processed or a date filter cut off the new records. In these cases, the [Semantic Models](/en/power-monitor/monitoramento/modelos-semanticos.md) screen shows everything green, but the report still displays yesterday's numbers.

Data Freshness answers the business question: **"is the newest data in this table recent enough?"**

Common use cases:

* **Sales fact table** that needs to have records from up to 1 hour ago during business hours.
* **Nightly load** of a data warehouse: confirm, at the start of the workday, that the table received the overnight load.
* **Detect incomplete loads**: with the optional [row volume check](#row-volume-check-optional), get notified when a table receives far fewer rows than usual, even if the date is up to date.
* **Models with multiple sources**: watch each table fed by a different process separately, each with its own tolerance.
* **Notify the business area** (the contacts registered on the workspace or the model) before someone makes a decision with outdated data.

{% hint style="info" %}
This screen complements the [Semantic Models](/en/power-monitor/monitoramento/modelos-semanticos.md) and [Artifact Refreshes](/en/power-monitor/dashboards/atualizacoes-de-artefatos.md) screens, which track the **execution** of refreshes. Here the focus is the **result**: the date of the most recent data inside the model.
{% endhint %}

## Features

### "Before you configure" notice

**What it is:** a fixed notice at the top of the page with the two limitations that determine which models can be monitored.

**What it is for:** explain, before you look for a model that does not appear in the wizard, why it is not there, and avoid configuring a model that will never respond.

<figure><picture><source srcset="/files/Z8Tft6ty7xRHhZiqjjgk" media="(prefers-color-scheme: dark)"><img src="https://3938213054-files.gitbook.io/~/files/v0/b/gitbook-x-prod.appspot.com/o/spaces%2FH2bFRBmIfyK3kwVKbldl%2Fuploads%2Fgit-blob-a94cecd689a31135bea72ffc066cc5f83b0d7950%2Fpm-monitoramento-atualizacao-dados-aviso-en.png?alt=media" alt="Before you configure notice with the two model eligibility rules"></picture><figcaption><p>"Before you configure" notice</p></figcaption></figure>

The notice says that:

* **Only models with at least one table containing a date/time column are listed.** The automatic date tables created by Power BI (*LocalDateTable* / *DateTableTemplate*) are ignored.
* **Models with row-level security (RLS) are not supported**, because the Power Monitor service principal cannot run queries with an effective identity.

**How to use:** read the notice and, if you want, click the **X** (**Dismiss notice**) to hide it.

**How it works:** dismissing applies only to the current visit. The notice appears again the next time you open the page, because the two rules still apply.

### Filters, search and list refresh

**What it is:** the bar at the top of the page, with the **Workspace** and **Search** filters and the **Clear filters**, **Refresh** and **New monitor** buttons. The information icon (ⓘ) next to the title summarizes how the check works.

**What it is for:** quickly find the monitor of a model or a set of workspaces when the list grows.

<figure><picture><source srcset="/files/HE2KpvAEr8iujcIqXE3p" media="(prefers-color-scheme: dark)"><img src="https://3938213054-files.gitbook.io/~/files/v0/b/gitbook-x-prod.appspot.com/o/spaces%2FH2bFRBmIfyK3kwVKbldl%2Fuploads%2Fgit-blob-63f9e62da0b7ee362d9c0cd10261477df2736c08%2Fpm-monitoramento-atualizacao-dados-filtros-en.png?alt=media" alt="Screen header with the Workspace and Search filters and the Clear filters, Refresh and New monitor buttons"></picture><figcaption><p>Header filters and buttons</p></figcaption></figure>

| Element           | Description                                                                                                                                    |
| ----------------- | ---------------------------------------------------------------------------------------------------------------------------------------------- |
| **Workspace**     | Multiple-selection filter with search. Restricts the list to the models of the chosen workspaces. With no selection, shows **All workspaces**. |
| **Search**        | Multiple-selection filter by semantic model name. Type at least 2 characters to see the suggestions and check one or more models.              |
| **Clear filters** | Removes the applied filters. It is highlighted and shows how many filters are active; with no filters, it is disabled.                         |
| **Refresh**       | Reloads the list without changing the filters.                                                                                                 |
| **New monitor**   | Opens the creation wizard. Visible only to Administrators.                                                                                     |

<figure><picture><source srcset="/files/ISM5eth3PsbzGheCGURP" media="(prefers-color-scheme: dark)"><img src="https://3938213054-files.gitbook.io/~/files/v0/b/gitbook-x-prod.appspot.com/o/spaces%2FH2bFRBmIfyK3kwVKbldl%2Fuploads%2Fgit-blob-5d6db270d427093a6ab29be924852cf122319d86%2Fpm-monitoramento-atualizacao-dados-filtro-workspace-en.png?alt=media" alt="Workspace filter open with a search field and a list of workspaces to check"></picture><figcaption><p>Workspace filter open</p></figcaption></figure>

**How to use:**

1. In the **Workspace** filter, open the list, search if necessary and check one or more workspaces.
2. In the **Search** filter, type at least 2 characters of the semantic model name and check one or more suggested models.
3. To remove the filters, click **Clear filters**. To reload the list without changing the filters, click **Refresh**.

**How it works:** the list is reloaded automatically right after you check or uncheck an option, and returns to the first page. When no monitor matches the filters, the screen displays **No monitors found** with the hint **Adjust the filters or clear the search.** If the list cannot be loaded, an error message appears with the **Try again** button.

### "Monitored models" list

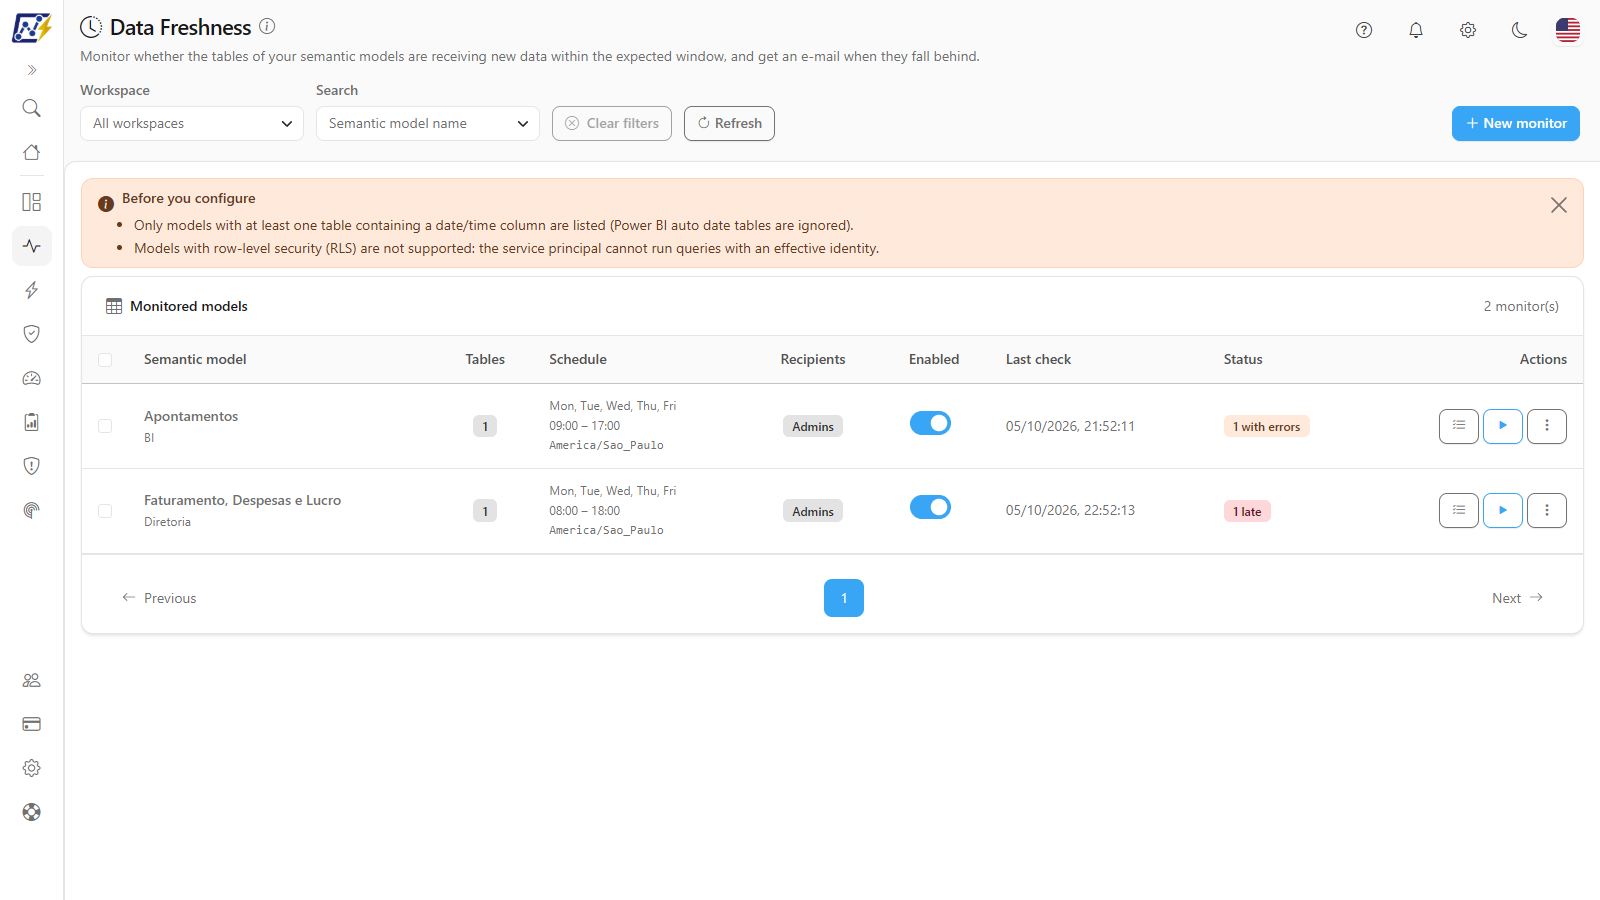
**What it is:** the main table of the screen. Each row represents a monitored semantic model. Each model can have **a single monitor**, with several tables within it. The card header shows the total number of monitors.

**What it is for:** see at a glance which models have delayed data, which have query errors and when each one was last checked.

<figure><picture><source srcset="/files/wdiimrRcT45hsZBQoUG7" media="(prefers-color-scheme: dark)"><img src="https://3938213054-files.gitbook.io/~/files/v0/b/gitbook-x-prod.appspot.com/o/spaces%2FH2bFRBmIfyK3kwVKbldl%2Fuploads%2Fgit-blob-6351298e9a9b5e1db4ee9384269939612faee2b7%2Fpm-monitoramento-atualizacao-dados-lista-selecao-en.png?alt=media" alt="Monitored models card with the schedule, recipients, Enabled switch, last check and status columns"></picture><figcaption><p>List of monitored models</p></figcaption></figure>

| Column             | What it shows                                                                                                                                                                                                                                          |
| ------------------ | ------------------------------------------------------------------------------------------------------------------------------------------------------------------------------------------------------------------------------------------------------ |
| *(selection)*      | Checkbox for the [bulk check](#check-now-in-bulk). Shown only to Administrators; the header checkbox selects all the monitors on the page.                                                                                                             |
| **Semantic model** | Name of the model and, below it, the workspace. The **RLS** badge indicates that the model requires an effective identity; in that case, checks tend to fail.                                                                                          |
| **Tables**         | Number of tables watched in this monitor.                                                                                                                                                                                                              |
| **Schedule**       | Days of the week (or **Every day**), time window (e.g., `09:00 – 17:00`) and time zone of the monitor.                                                                                                                                                 |
| **Recipients**     | Summary of who receives the alerts: **Admins**, **Workspace** (workspace contacts), **Model** (semantic model contacts) and the number of additional emails. Hover over it to see the additional emails (they appear masked when **Hide data** is on). |
| **Enabled**        | On/off switch (see [Enable or disable a monitor](#enable-or-disable-a-monitor)).                                                                                                                                                                       |
| **Last check**     | Date and time of the last check, in your browser's time.                                                                                                                                                                                               |
| **Status**         | **Not checked yet** (gray), **N late** (red), **N with errors** (yellow), **N with volume drop** (blue, only when the [volume check](#row-volume-check-optional) is on) or **All up to date** (green). The badges can appear together.                 |
| **Actions**        | **View results** (all profiles), **Check now** and **More actions** (⋮) buttons, the last two for Administrators.                                                                                                                                      |

**How to use:** read the **Status** column to prioritize: start with the red badges (delayed data) and then the yellow ones (the query failed and the table could not be evaluated). Click **View results** on the row to see the per-table detail. The list shows 20 monitors per page; use the pagination in the card footer, which also lets you choose how many items to show per page.

**How it works:** the **View results** button is disabled while the monitor has not had any check yet.

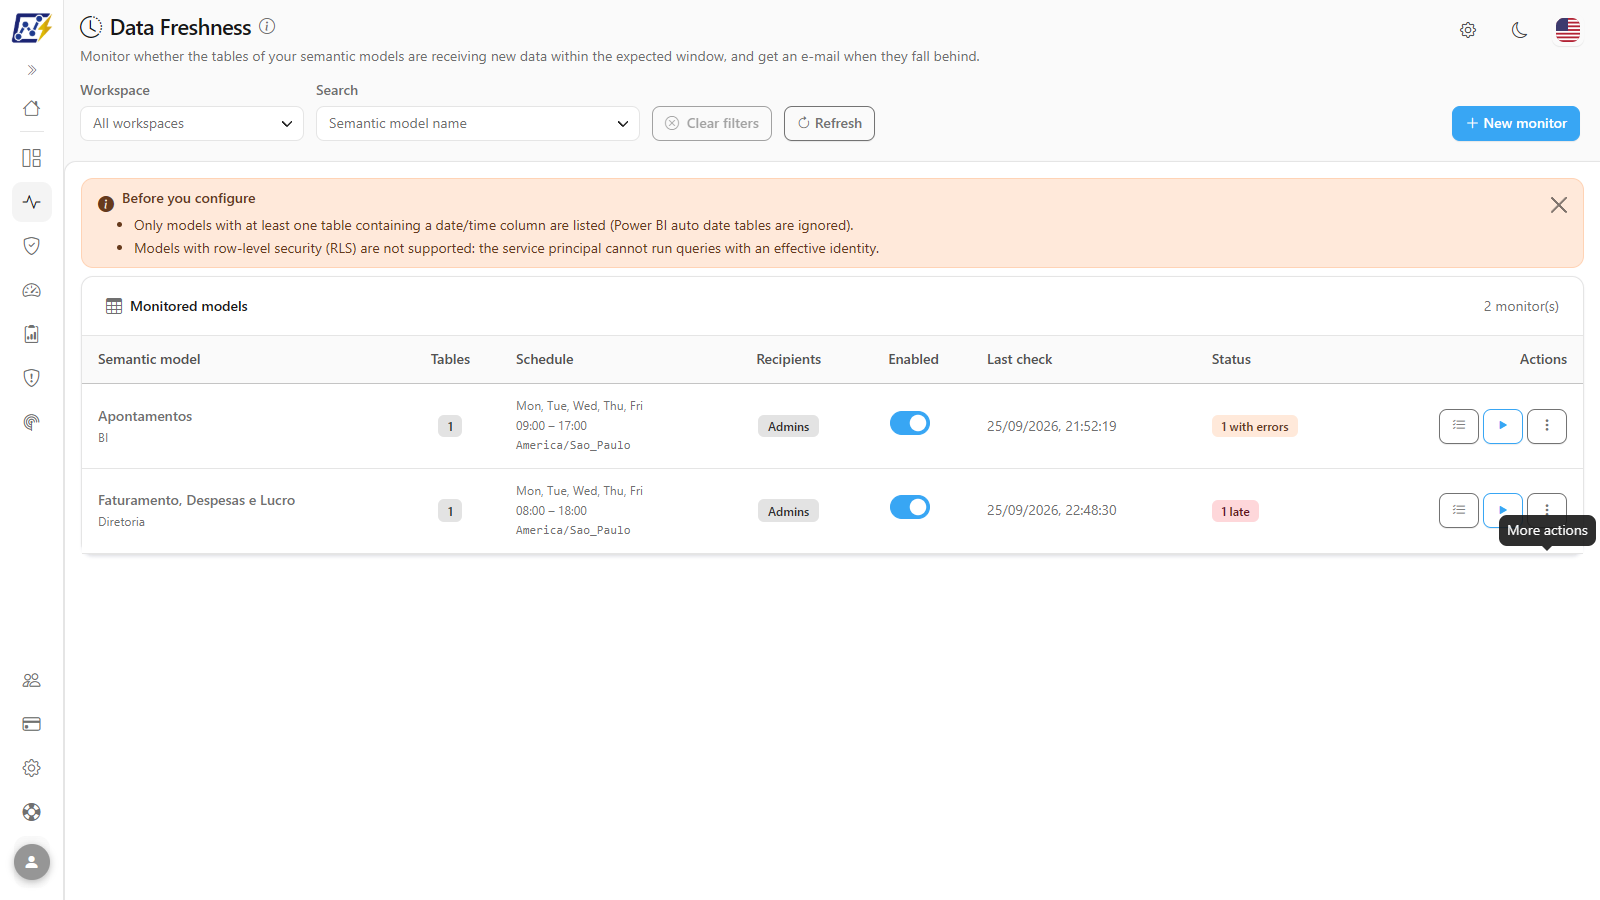
### "More actions" menu (⋮)

**What it is:** the menu on each row with the monitor maintenance actions: **Edit**, **Check now**, **View results** and **Delete**.

**What it is for:** gather in one place the write actions of a monitor.

<figure><picture><source srcset="/files/x41oPVkVH6R4E92L4FHd" media="(prefers-color-scheme: dark)"><img src="https://3938213054-files.gitbook.io/~/files/v0/b/gitbook-x-prod.appspot.com/o/spaces%2FH2bFRBmIfyK3kwVKbldl%2Fuploads%2Fgit-blob-6ac22dc0c0ed996e3d268c8f73633bacb65b8dfd%2Fpm-monitoramento-atualizacao-dados-menu-acoes-en.png?alt=media" alt="More actions menu open over a monitor row"></picture><figcaption><p>Actions menu of a monitor</p></figcaption></figure>

**How to use:** click **More actions** (⋮) in the **Actions** column, or right-click the row, and choose the action.

**How it works:** the menu only exists for Administrators. **View results** is disabled while there is no check, and **Check now** is disabled while a check of the row is in progress.

### Create a monitor

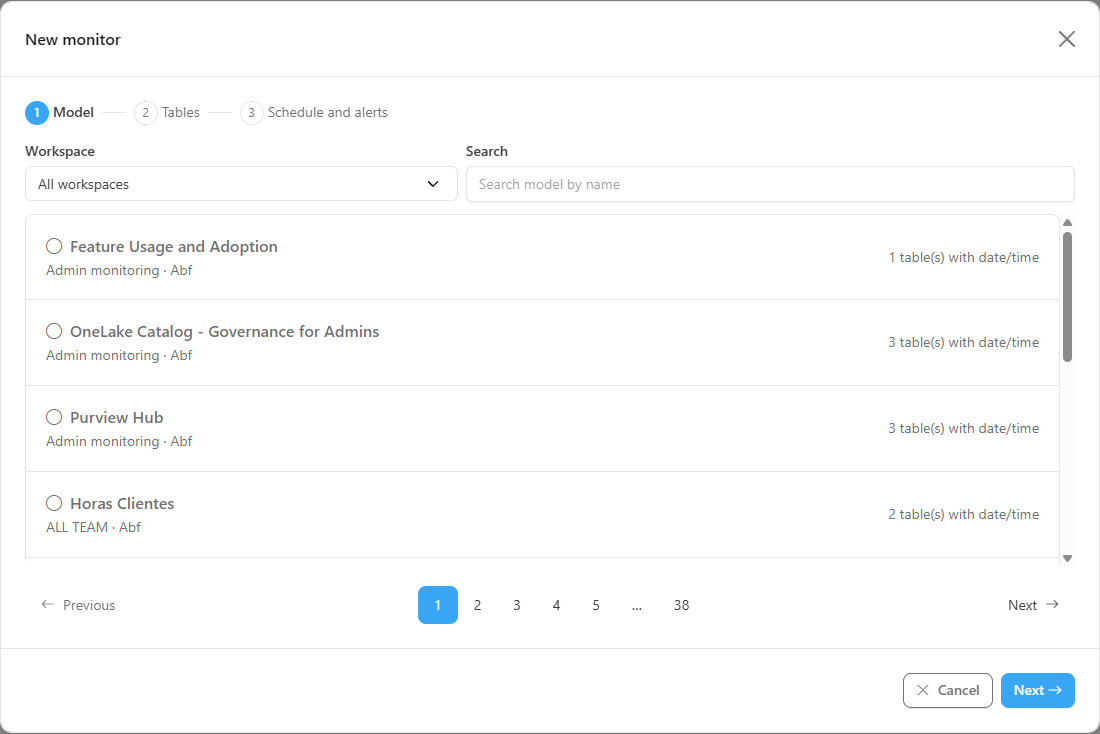
**What it is:** the **New monitor** wizard, in three steps: **Model**, **Tables** and **Schedule and alerts**.

**What it is for:** choose the model, the tables to watch, the delay tolerance of each one, the check window and who should be notified.

Prerequisite: **Administrator** profile; the model's workspace must be monitored and the model mapped (see [Prerequisites](#prerequisites)).

<figure><picture><source srcset="/files/Pj4FNCZY6oXoUJcFIMTx" media="(prefers-color-scheme: dark)"><img src="https://3938213054-files.gitbook.io/~/files/v0/b/gitbook-x-prod.appspot.com/o/spaces%2FH2bFRBmIfyK3kwVKbldl%2Fuploads%2Fgit-blob-28a83107ffaac27ff88e872c105034b6a48a359b%2Fpm-monitoramento-atualizacao-dados-etapa-modelo-en.png?alt=media" alt="Model step of the wizard with the list of eligible models"></picture><figcaption><p>Step 1: choosing the semantic model</p></figcaption></figure>

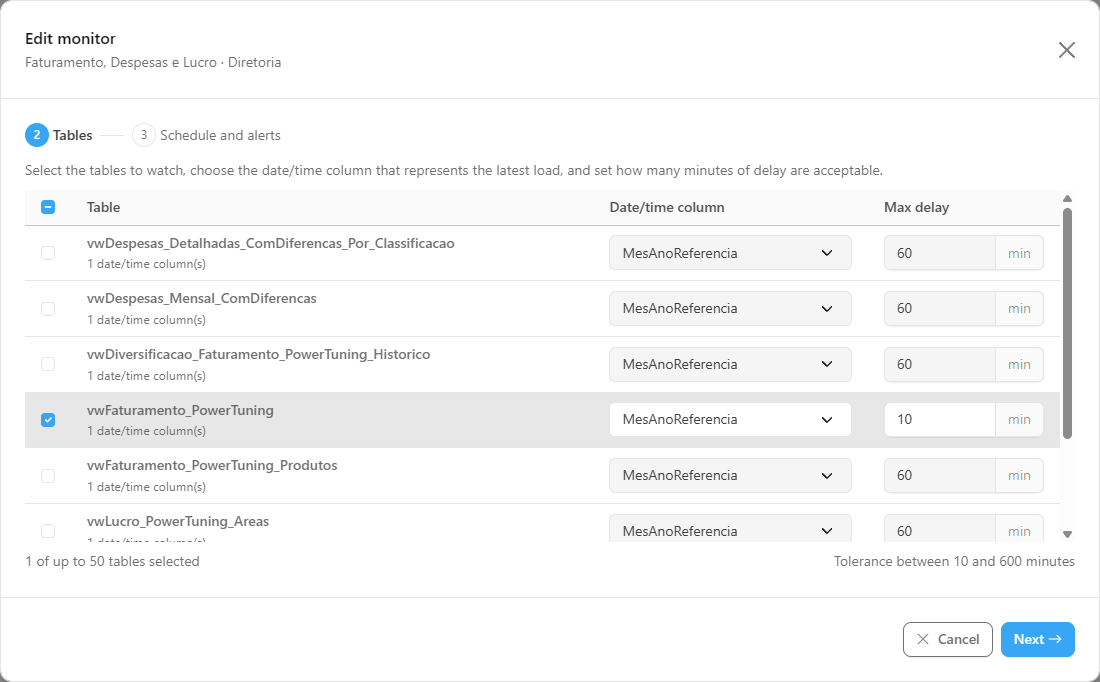
<figure><picture><source srcset="/files/okfrmIpk8d2Bm5iPxSLy" media="(prefers-color-scheme: dark)"><img src="https://3938213054-files.gitbook.io/~/files/v0/b/gitbook-x-prod.appspot.com/o/spaces%2FH2bFRBmIfyK3kwVKbldl%2Fuploads%2Fgit-blob-e98170467e150dec4ccba44e169569218eaaae34%2Fpm-monitoramento-atualizacao-dados-etapa-tabelas-en.png?alt=media" alt="Tables step with checked tables, date column and max delay"></picture><figcaption><p>Step 2: tables, date/time column and max delay</p></figcaption></figure>

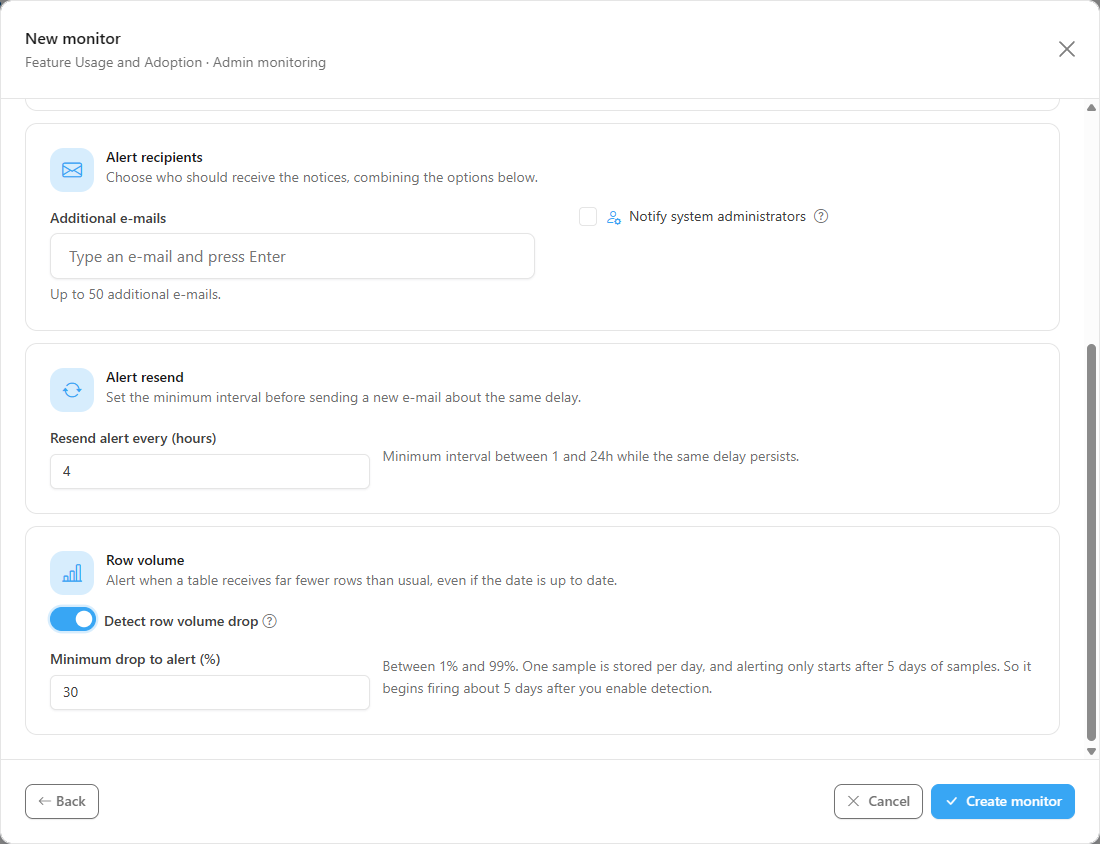
<figure><picture><source srcset="/files/P952DJ101lisP3OdNJEO" media="(prefers-color-scheme: dark)"><img src="https://3938213054-files.gitbook.io/~/files/v0/b/gitbook-x-prod.appspot.com/o/spaces%2FH2bFRBmIfyK3kwVKbldl%2Fuploads%2Fgit-blob-9ca5decacc2a9a8f473e2d43816a0bdae8639efc%2Fpm-monitoramento-atualizacao-dados-etapa-agenda-volume-en.png?alt=media" alt="Schedule and alerts step with schedule, alert recipients and resend"></picture><figcaption><p>Step 3: schedule, recipients and resend</p></figcaption></figure>

**How to use:**

{% stepper %}
{% step %}

### Open the wizard

In *Monitoring › Data Freshness*, click **New monitor**. The wizard opens on the **Model** step.
{% endstep %}

{% step %}

### Choose the model

Filter by **Workspace** or type in the **Search model by name** field and click the desired model. Each item shows the workspace, the storage mode and how many tables have a date/time column. Models with the **Already monitored** badge cannot be chosen. If the model has the **RLS** badge, the wizard displays a warning: checks tend to fail with a permission error. Click **Next**.
{% endstep %}

{% step %}

### Select the tables

On the **Tables** step, check each table that should be watched (or the **Select all tables** box). The counter shows how many tables were checked, up to the limit of 50.
{% endstep %}

{% step %}

### Define the column and tolerance of each table

For each checked table, choose the **Date/time column** that represents the latest load (only date/time columns appear) and enter the **Max delay** in minutes (between 10 and 600). Click **Next**.
{% endstep %}

{% step %}

### Configure the schedule

On the **Schedule and alerts** step, **Schedule** section, check the **Days of the week** and enter **Start**, **End** and **Time zone**. Use the time zone in which the date column is written at the source.
{% endstep %}

{% step %}

### Choose the recipients

In the **Alert recipients** section, check **Notify system administrators**, **Notify workspace contacts** and/or **Notify semantic model contacts** (the last two appear only when those contacts exist in the governance metadata). To include other people, type the address in **Additional e-mails** and press **Enter** (up to 50 emails).
{% endstep %}

{% step %}

### Define the resend

In the **Alert resend** section, enter **Resend alert every (hours)**, from 1 to 24.
{% endstep %}

{% step %}

### Decide on the volume check (optional)

In the **Row volume** section, turn on **Detect row volume drop** if you want to be notified when a table receives far fewer rows than usual, and enter the **Minimum drop to alert (%)**, from 1 to 99 (default: 30). See [Row volume check](#row-volume-check-optional).
{% endstep %}

{% step %}

### Create the monitor

Click **Create monitor**. If any field is invalid, the **Check the form** window lists what to fix. On success, the message **Monitor created successfully.** is displayed and the monitor appears in the list with the **Not checked yet** status. Use **Back** to return to a previous step or **Cancel** to give up.
{% endstep %}

{% step %}

### Test immediately

On the new monitor's row, click **Check now** to see the first result without waiting for the next cycle.
{% endstep %}
{% endstepper %}

**How it works / rules:**

| Rule                        | Value                                                                                                                         |
| --------------------------- | ----------------------------------------------------------------------------------------------------------------------------- |
| Eligible models             | Not deleted, from monitored workspaces, with at least one table (excluding the automatic date tables) with a date/time column |
| Monitors per model          | 1                                                                                                                             |
| Tables per monitor          | up to **50**                                                                                                                  |
| Max delay per table         | between **10** and **600 minutes** (10 hours); suggested: 60 minutes                                                          |
| Default schedule            | Monday to Friday, from 09:00 to 17:00, time zone *America/Sao\_Paulo*                                                         |
| Frequency within the window | about every 10 minutes                                                                                                        |
| Recipients                  | at least one notification option checked or at least one email; up to 50 additional emails                                    |
| Resend                      | from 1 to 24 hours (default: 4)                                                                                               |
| Volume check                | off by default; minimum drop from 1% to 99% (default: 30%)                                                                    |

* **Notify system administrators** sends to all Administrators of the organization. **Notify workspace contacts** and **Notify semantic model contacts** send to the responsible person and the business area contact registered in the governance metadata of the [workspace](/en/power-monitor/governanca/workspaces.md) or the [semantic model](/en/power-monitor/governanca/modelos-semanticos.md).
* Input errors (for example, window end before the start or delay out of range) appear in a warning window when you advance or save.
* Below the step indicator, the note **This feature consumes capacity**, with an **i**, reminds you that each check runs a query on the model. See [Capacity consumption](#capacity-consumption).

### Edit a monitor

**What it is:** the **Edit monitor** modal, with the **Tables** and **Schedule and alerts** steps.

**What it is for:** add or remove tables, adjust tolerances, change the window, the recipients or the resend, and turn the monitor on or off.

Prerequisite: **Administrator** profile.

**How to use:**

1. On the monitor's row, click **More actions** (⋮), or right-click the row, and choose **Edit**. The modal opens directly on the **Tables** step.
2. Adjust the tables, columns and tolerances and click **Next**.
3. Change the schedule, the recipients, the resend or the **Monitor enabled** switch (when off, it shows **Monitor disabled (no checks are performed)**).
4. Click **Save**. The message **Monitor updated successfully.** confirms the change. To give up, click **Cancel**.

**How it works:** the **Model** step does not appear when editing, because the model of a monitor cannot be changed; to watch another model, create a new monitor. The **Monitor enabled** switch exists only when editing.

### Enable or disable a monitor

**What it is:** the switch in the **Enabled** column of each row.

**What it is for:** temporarily suspend the checks and emails of a model (for example, during source maintenance) without losing the configuration.

Prerequisite: **Administrator** profile (for other profiles, the switch appears disabled).

**How to use:**

1. In the **Enabled** column, click the switch on the monitor's row.
2. The message **Monitor disabled.** (or **Monitor re-enabled.**) confirms the change.

**How it works:** the switch changes immediately; if the operation fails, it returns to its previous position and the screen displays the reason. A disabled monitor is not checked and does not send emails, but keeps its configuration and previous results.

### Check now

**What it is:** the **Check now** button (▶ icon in the **Actions** column, also available in the **More actions** menu and inside the results modal).

**What it is for:** test a newly created monitor or confirm that a load or a fixed permission solved the delay, without waiting for the next cycle.

Prerequisite: **Administrator** profile.

**How to use:**

1. In the **Actions** column, click **Check now**. The check goes to the collection service queue and *Check queued. The result will appear here shortly.* is displayed. The button is only disabled while the request is sent.
2. The screen tracks the check until the end, without reloading. When it finishes, the list row is updated and a notice at the top says *Check completed: {model}.*, with the **View results** button, which opens the results modal. If the modal is already open, its title changes to **Check completed**. If the check fails, the notice shows the reason.
3. If the result takes longer than expected, the row shows the **Still pending** badge. Reload the screen in a few minutes.

**How it works:** the manual check queries the model immediately, even outside the window, and **does not send the incident email**. If it shows that the problem has been resolved, the closing of the occurrence and the resolved email happen normally. To notify the recipients immediately, use [Send alert](#send-alert).

### Check now in bulk

**What it is:** selecting several monitors in the list and then using the **Check now** button of the bulk actions bar, which checks all the selected ones, one at a time. Exclusive to **Administrators**.

**What it is for:** rechecking several monitors at once, for example after fixing a load or a permission that affected many models.

**How to use**

{% stepper %}
{% step %}

#### Select the monitors

Tick the checkbox of the rows you want, or the header checkbox to select all the monitors on the page. A bar shows *N monitors selected*.
{% endstep %}

{% step %}

#### Start the check

In the bar, click **Check now**. A confirmation window (*Check now?*) reminds you that the monitors will be queued for a check, one at a time, that each result appears in the list shortly and that no email is sent. Confirm.
{% endstep %}

{% step %}

#### Follow along and, if you want, stop

The bar shows the queueing progress (*Queueing N of M...*). To interrupt, click **Stop**: the stop takes effect between one monitor and the next, and the ones already queued are checked.
{% endstep %}

{% step %}

#### Check the result

When queueing ends, a message tells you how many checks were queued (*N checks queued. The results appear in the list shortly.*, or *Queueing interrupted. N of M queued.* if you stopped before the end). If a monitor cannot be queued, a window lists the reason for each one (*N queued, M failed*). The screen tracks the checks until the end: the rows are updated with the new results and a notice says *Check completed for N monitors.* (or how many failed, with the first reason).
{% endstep %}
{% endstepper %}

**How it works**

* To avoid overloading the model and the Power BI API, the monitors are queued **one at a time**, in the order of the list.
* As with the single check, the bulk check **does not send the incident email**.
* While queueing runs, the selection, the **Enabled** switches, and the check buttons are locked. The selection is cleared when you reload the list, change the page, or change the filters.

### View results

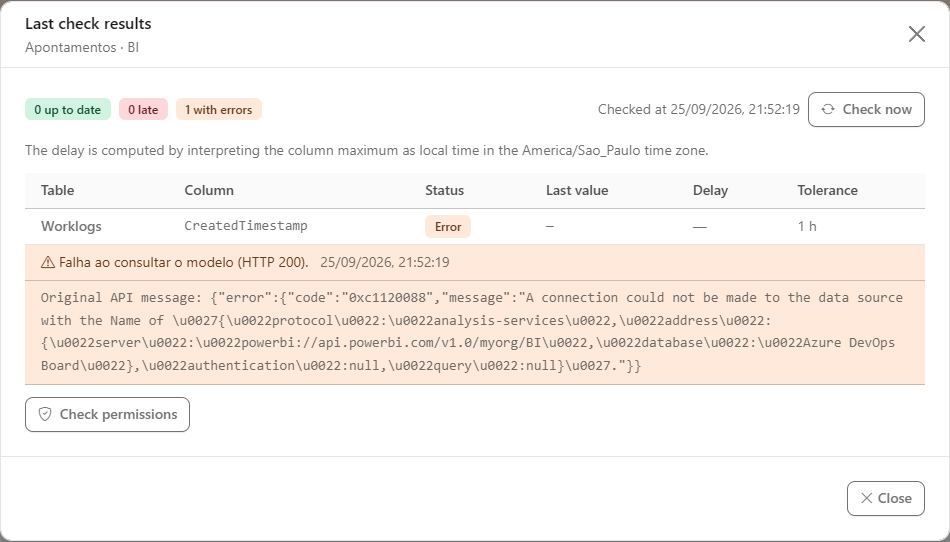
**What it is:** the **Last check results** modal, opened by **View results**, in the row or in the notice shown when a **Check now** finishes (if it is open during the check, the title changes to **Check completed** when it finishes). It shows the result of each table in the monitor.

**What it is for:** know exactly which table is delayed, for how long and what the tolerance was, or why the query failed.

<figure><picture><source srcset="/files/g5KstPYnLScCDMbRYkBY" media="(prefers-color-scheme: dark)"><img src="https://3938213054-files.gitbook.io/~/files/v0/b/gitbook-x-prod.appspot.com/o/spaces%2FH2bFRBmIfyK3kwVKbldl%2Fuploads%2Fgit-blob-a8bf373fbf80c9a1c516bb6e4c61663c509b0d42%2Fpm-monitoramento-atualizacao-dados-resultados-en.png?alt=media" alt="Results modal with counters, up-to-date and late tables"></picture><figcaption><p>Check results modal</p></figcaption></figure>

At the top are the counters **N up to date**, **N late** and **N with errors** (and **N with volume drop**, when the [volume check](#row-volume-check-optional) is on), the date in **Checked at** and the **Check now** and **Send alert** buttons.

| Column         | What it shows                                                                                                                                         |
| -------------- | ----------------------------------------------------------------------------------------------------------------------------------------------------- |
| **Table**      | Name of the table (hover over it to see the full name).                                                                                               |
| **Column**     | Date/time column queried.                                                                                                                             |
| **Status**     | **OK**, **Late**, **Error** or **Pending** (table not yet checked). A table with a volume drop also gets the **Volume drop** chip next to the status. |
| **Last value** | Highest value found in the column.                                                                                                                    |
| **Delay**      | Difference between the current time and the last value, in days, hours and minutes (highlighted when the table is late).                              |
| **Tolerance**  | Max delay configured for the table.                                                                                                                   |
| **Rows**       | Only shown with the volume check on: the last row count and, in parentheses, the median of the previous 7 days. Hover to see the explanation.         |

**How to use:**

1. In the **Actions** column, click **View results** (available to all profiles).
2. Read the counters and the date in **Checked at**.
3. In the table, check for each table the **Status**, the **Last value**, the **Delay** and the **Tolerance**. For tables with **Error**, read the message and the **Original API message** in the highlighted rows right below.
4. Click **Close** to return to the list.

**How it works:** when a table has an **Error**, an additional row shows the problem message and, when available, the **Original API message** returned by Power BI, to make diagnosis easier. A notice reminds you that the delay is calculated by interpreting the column value as local time in the monitor's time zone.

### Send alert

**What it is:** the **Send alert** button in the results modal.

**What it is for:** notify the recipients immediately, without waiting for the next automatic check or the end of the resend interval.

Prerequisite: **Administrator** profile; at least one **Late** table or one with a **Volume drop** in the result.

**How to use:**

1. Open the results modal (**View results** or **Check now**).
2. Click **Send alert**. The button only appears when there is a late table or a table with a volume drop.
3. The message **Alert sent to the recipients.** confirms the sending.

**How it works:** the email goes to the monitor's recipients **ignoring the resend interval**, and the next automatic resend starts counting from this sending. Tables only **with errors** do not enable the button, because there is no measured delay to report for them.

### Permission diagnostic

**What it is:** the **Check permissions** button, which appears in the results modal when a table has an error. It runs, on demand and with reads only, a sequence of checks that explain why the Power Monitor service principal cannot query the model.

**What it is for:** find out which access layer is missing when the error message is not enough, without having to open the Power BI portal.

Prerequisite: **Administrator** profile. To grant the permission through the **Add permission** button, the Administrator must also be an owner or administrator of the model in Power BI.

Each check appears with ✓ or ✗ and a detail:

| Check                                     | What it confirms                                                                                                                                                                                                                                                                                          |
| ----------------------------------------- | --------------------------------------------------------------------------------------------------------------------------------------------------------------------------------------------------------------------------------------------------------------------------------------------------------- |
| Workspace access                          | The service principal can see the workspace and through which identity (the application itself or the security group).                                                                                                                                                                                    |
| Workspace capacity type                   | Informational, never fails. On dedicated capacity: on a Fabric or Premium capacity, the monitor's query consumes its CU; on Premium Per User (PPU), it consumes no CU from the organization's capacity. In a Pro workspace: the query works normally and consumes no CU from the organization's capacity. |
| Model access                              | The model is visible within the workspace.                                                                                                                                                                                                                                                                |
| Storage mode                              | The model is not in Composite mode.                                                                                                                                                                                                                                                                       |
| Build permission                          | The organization's application or security group has Build permission on the model.                                                                                                                                                                                                                       |
| RLS                                       | The model does not require an effective identity.                                                                                                                                                                                                                                                         |
| Single Sign-On                            | No data source of the model uses SSO.                                                                                                                                                                                                                                                                     |
| Live Connection / Azure Analysis Services | The model is not just a pointer to an Azure Analysis Services.                                                                                                                                                                                                                                            |
| DirectQuery to another Power BI model     | Appears when the model is composite and queries another semantic model. This connection always uses SSO and **does not work with a service principal**, regardless of permissions.                                                                                                                        |
| Compatibility level                       | Appears when the model definition has already been mapped; models with a very old level are not supported.                                                                                                                                                                                                |
| Test query                                | Always last: runs a minimal query on the model.                                                                                                                                                                                                                                                           |

**How to use:**

{% stepper %}
{% step %}

### Open the results

Click **View results** and read the message and the **Original API message** of the table with an error.
{% endstep %}

{% step %}

### Run the diagnostic

Click **Check permissions**. Each check is displayed with ✓ or ✗ and a detail. Identify the first one that failed.
{% endstep %}

{% step %}

### Grant the Build permission, if applicable

When the lack of Build is the probable cause, the **Add permission** button appears. Click it; the first time, Microsoft Entra ID asks for consent in a pop-up window. The message **Build permission granted to the service principal.** confirms the grant and the diagnostic is run again automatically.
{% endstep %}

{% step %}

### Handle platform limitations

If the failed check is RLS, Single Sign-On, Live Connection with Azure Analysis Services or DirectQuery to another Power BI model, the screen cannot fix it: adjust the model or monitor the source model directly.
{% endstep %}

{% step %}

### Check again

After fixing it, click **Check now** in the modal itself to confirm that the table is back to **OK**.
{% endstep %}
{% endstepper %}

**How it works:** **Add permission** grants Build permission on the model to the organization's **security group**, using the account of the Administrator who clicked. The button only appears when the test query fails and the Build permission is not yet confirmed for the group. It also appears for models in a Pro workspace, when what is missing is the Build permission.

{% hint style="info" %}
The **Check now**, **Send alert** and **Check permissions** buttons in the results modal appear for all profiles, but only run for Administrators; for other profiles, the operation is denied.
{% endhint %}

### Query debug

**What it is:** the **Debug** button, which appears in the diagnostic when **all** checks pass and the test query still fails.

**What it is for:** reproduce the exact call in another tool (Postman, curl) when the cause is beyond the reach of the screen.

**How to use:**

1. In the diagnostic, read the notice about the most likely causes: the tenant setting that allows service principals to use the Power BI APIs and the direct membership of the service principal in the security group.
2. Click **Debug**.
3. Use the data displayed (Tenant ID, Client ID, token endpoint and scope, query method and endpoint, and the exact body of the test query and of each table's query) to build the call in the tool of your choice.

**How it works:** the panel **never displays the Client Secret or an access token**. Even so, handle this information carefully when sharing it.

### Row volume check (optional)

**What it is:** an optional detection, turned on per monitor, that compares the **row count** of each watched table with what is normal for it and warns when the volume drops sharply, **even with the date up to date**.

**What it is for:** catching loads that ran "successfully" and brought the right date but with few rows (a wrong filter at the source, a partial load, an unprocessed partition).

Prerequisite: **Administrator** profile to turn the detection on, in the **Schedule and alerts** step of the wizard (create or edit), **Row volume** section.

**How to use**

1. When creating or editing the monitor, in the **Schedule and alerts** step, turn on **Detect row volume drop**.
2. In **Minimum drop to alert (%)**, enter a value from 1 to 99 (default: 30).
3. After some checks, open **View results**: the **Rows** column shows the last count and the comparison median.

**How it works**

* In each check, the same query that reads the latest date also counts the rows of the table.
* Power Monitor stores **one count sample per day** (in the monitor's time zone). The comparison baseline is the **median of the previous 7 daily samples** (today's does not count).
* The baseline only exists with **at least 5 samples**. So the alert starts working about 5 days after you turn the detection on; until then the **Rows** column shows only the last count.
* A table enters **volume drop** when the current count is **more than X%** below the median (X is the configured minimum drop). Increases never raise an alert, and a table that is usually empty does not raise a drop alert.
* A volume drop is an **additional** alert reason: a table can be late and have a volume drop at the same time. It is counted separately (**N with volume drop**) and goes into the same email and the same occurrence in [Alerts](/en/power-monitor/monitoramento/alertas.md). The **Send alert** button is also available.
* If the count cannot be read in a check, the table simply has no volume information for that round; this does not become a refresh error.

### Delete a monitor

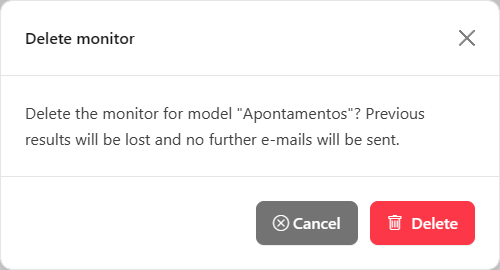
**What it is:** the **Delete** action in the **More actions** menu.

**What it is for:** remove the monitor of a model that was discontinued or no longer needs to be watched.

Prerequisite: **Administrator** profile.

<figure><picture><source srcset="/files/33yzp871ASmb3qcdJNQg" media="(prefers-color-scheme: dark)"><img src="https://3938213054-files.gitbook.io/~/files/v0/b/gitbook-x-prod.appspot.com/o/spaces%2FH2bFRBmIfyK3kwVKbldl%2Fuploads%2Fgit-blob-f0f5fe111da908673e57e24123ab88ae38b66bcb%2Fpm-monitoramento-atualizacao-dados-excluir-en.png?alt=media" alt="Delete monitor confirmation modal"></picture><figcaption><p>Deletion confirmation</p></figcaption></figure>

**How to use:**

1. On the monitor's row, click **More actions** (⋮) and choose **Delete**.
2. In the **Delete monitor** modal, read the warning and click **Delete** to confirm, or **Cancel**.
3. The message **Monitor deleted.** confirms the deletion.

**How it works:** deletion erases the previous results and stops sending emails. It cannot be undone; to monitor the model again, create a new monitor.

## Rules and behavior

### How the check works

* The automatic check runs **every 10 minutes**. A monitor is only checked when it is **enabled** and the current time is **within the window** (day of the week and time range, in the monitor's time zone). Outside the window, nothing is queried or sent.
* In each check, Power Monitor runs a query on the model that fetches the **maximum value** of the chosen column in each table, using the organization's service principal.
* The value found is interpreted as **local time in the monitor's time zone** and compared with the current time in that same time zone. The delay is counted in whole minutes; a value in the future counts as zero delay.
* The table is **Late** when the delay is **greater** than the configured max delay, and **OK** when it is equal or less.
* With the [volume check](#row-volume-check-optional) on, the query also counts the rows of the table, and a sharp drop compared with the recent median is flagged as an additional reason.
* The window cannot cross midnight (for example, 22:00 to 02:00). In that case, set the window until the end of the day or adjust the time.

{% hint style="warning" %}
Choose the monitor's time zone according to how the column is written. If the source writes the date in UTC and the monitor is in *America/Sao\_Paulo*, the calculated delay will be shifted by 3 hours.
{% endhint %}

### Table statuses

| Status          | Meaning                                                                                                                                                                                                                                                                                 |
| --------------- | --------------------------------------------------------------------------------------------------------------------------------------------------------------------------------------------------------------------------------------------------------------------------------------- |
| **OK**          | The most recent data is within the tolerance.                                                                                                                                                                                                                                           |
| **Late**        | The most recent data is older than the max delay.                                                                                                                                                                                                                                       |
| **Error**       | The table could not be queried. Possible messages: no permission on the model, model not found in Power BI, table or column no longer exists in the model, model with RLS is not supported, invalid table or column name, maximum value impossible to interpret, or unexpected failure. |
| **Pending**     | The table has not been checked yet (for example, it was just added).                                                                                                                                                                                                                    |
| **Volume drop** | Additional reason (chip next to the status): with the volume check on, the row count is more than the configured limit below the median of the previous 7 days.                                                                                                                         |

### Alerts generated

* When an automatic check finds at least one **late** table, one **with errors**, or one **with a volume drop**, the recipients receive the **"Data freshness delayed"** email, with the list of tables, last value, delay, tolerance and status (and the description of the volume drop, when there is one).
* While the problem continues, new emails (**"Reminder: data freshness still delayed"**) are only sent after the **Resend alert every (hours)** interval.
* Each incident email also records an occurrence of the **Data Freshness** type in the [Alerts](/en/power-monitor/monitoramento/alertas.md) center.
* When all tables are up to date again, the occurrence is closed and the **alert resolved** email is sent, which follows the organization's general alert notification rules (Administrators and users who receive alerts for the workspace, plus the configured external channels). The resend interval is reset, so that a new delay is reported immediately.
* The recipients of each source (administrators, workspace and model contacts) are resolved **at the time of sending**: changes to Administrators or governance metadata apply to the next alert without editing the monitor.
* Monitors with problems also appear in the **Data Freshness with Issues** panel of the [Monitoring Dashboard](/en/power-monitor/dashboards/dashboard-de-monitoramento.md).

### Capacity consumption

Each check runs one simple DAX query on the monitored model (the most recent value of the date column and, with the volume check turned on, the row count). Every query on a model is an interactive Power BI operation:

* with the model on a **Fabric** or **Premium** capacity, the query consumes CU from that capacity, at a **low** level per check, at each monitor's frequency;
* with the model in a **Pro** or **Premium Per User (PPU)** workspace, the query works normally and consumes no CU from the organization's capacity;
* on **DirectQuery** models, the query also reaches the data source.

That is why the screen footer shows *This monitoring consumes Fabric capacity to check the data.* and the create or edit window shows **This feature consumes capacity**, both with an **i** that explains the consumption. See [Fabric capacity consumption](/en/power-monitor/configuracoes/monitoramento.md#fabric-capacity-consumption).

### Prerequisites

* The model's workspace must be **monitored** by Power Monitor and the model must have been mapped (the mapping is what provides the tables and date/time columns).
* The Power Monitor service principal must be able to run queries on the model: access to the workspace, **Build** permission on the model (granted to the organization's application or security group) and the tenant settings that allow service principals to use the Power BI APIs and run queries through the REST API.
* The model can be in a Pro workspace or on a dedicated capacity. The monitor's query is plain DAX, which works in both cases; only the `INFO.*` DAX functions, which the monitor does not use, require a capacity.
* Not supported: models with **RLS**, sources with **Single Sign-On**, models that are only a connection to **Azure Analysis Services** and tables that depend on **DirectQuery to another Power BI model**.

## Frequently asked questions

<details>

<summary>My model does not appear in the list when creating a monitor. Why?</summary>

The model must be in a monitored workspace, cannot be deleted and must have at least one table with a date/time column (Power BI's automatic date tables do not count). If the column exists in Power BI but does not appear, check whether the model has already been mapped by Power Monitor and whether the column has the *Date/Time* type in the model. If the model appears disabled with the **Already monitored** badge, edit the existing monitor.

</details>

<details>

<summary>The model refresh finished successfully, but the table appears as late.</summary>

That is exactly the scenario this screen detects: the refresh ran, but the source did not bring new records. Check the process that feeds the source (pipeline, data warehouse load, etc.). Also check whether the monitor's time zone matches the time zone in which the column is written.

</details>

<details>

<summary>I receive many emails about the same delay.</summary>

Increase the **Resend alert every (hours)** value on the *Schedule and alerts* step. The maximum is 24 hours. While the same delay continues, only one email is sent per interval.

</details>

<details>

<summary>I turned on the volume check, but no table shows a drop.</summary>

The alert only starts working after 5 days of samples (one per day), because it compares the current count with the median of the previous 7 days. Until then, the **Rows** column of the result shows only the last count. After that, there is an alert only if the count falls by more than the configured **Minimum drop to alert (%)**.

</details>

<details>

<summary>I need to monitor a load that happens overnight, between 11 PM and 2 AM.</summary>

The window cannot cross midnight. Since the goal is usually to confirm that the load arrived, set the window to after the expected load time (for example, from 06:00 to 18:00) with a compatible max delay.

</details>

<details>

<summary>The table appears with the error "No permission on the model".</summary>

Use **Check permissions** in the results modal. The most common causes are the lack of Build permission for the service principal (or the security group) on the model and tenant settings that do not allow the APIs for service principals. A model in a Pro workspace is not a cause of error: the query works there.

</details>

<details>

<summary>The "View results" button is disabled.</summary>

The monitor has not been checked even once yet. Wait for the next check within the window or ask an Administrator to click **Check now**.

</details>

<details>

<summary>Can users who are not Administrators use this screen?</summary>

Yes, to view: they see the list and the results of each monitor (respecting the workspaces they have access to). Creating, editing, deleting, enabling/disabling, checking now (single or bulk), sending alerts and diagnosing permissions are Administrator actions.

</details>

## Related pages

* [Semantic Models](/en/power-monitor/monitoramento/modelos-semanticos.md)
* [Artifact Refreshes](/en/power-monitor/dashboards/atualizacoes-de-artefatos.md)
* [Fabric Mirroring](/en/power-monitor/monitoramento/fabric-mirroring.md)
* [Alerts](/en/power-monitor/monitoramento/alertas.md)
* [Monitoring Dashboard](/en/power-monitor/dashboards/dashboard-de-monitoramento.md)
* [Workspaces (Governance)](/en/power-monitor/governanca/workspaces.md)
* [Semantic Models (Governance)](/en/power-monitor/governanca/modelos-semanticos.md)
* [Monitoring overview](/en/power-monitor/monitoramento.md)


---

# Agent Instructions
This documentation is published with GitBook. GitBook is the documentation platform designed so that both humans and AI agents can read, navigate, and reason over technical content effectively. Learn more at gitbook.com.

## Querying This Documentation
If you need additional information that is not directly available in this page, you can query the documentation by asking a question.

Perform an HTTP GET request on the following URL with the `ask` and `goal` query parameters:

```
GET https://docs.powermonitor.com.br/en/power-monitor/monitoramento/atualizacao-de-dados.md?ask=<question>&goal=<user_goal>
```

`ask` is the immediate question: it should be specific, self-contained, and written in natural language.
`goal` is what the user is ultimately trying to achieve, the reason they need the answer. Sharing it helps GitBook give you a better, more relevant answer. A goal is most helpful when it describes the outcome the user wants rather than restating the question. For example, with `ask=how do I create an API token`, a goal like `automate deployments from our CI pipeline` lets GitBook tailor the answer to that use case.

The response will contain a direct answer to the question and relevant excerpts and sources from the documentation.

Use this mechanism when the answer is not explicitly present in the current page, you need clarification or additional context, or you want to retrieve related documentation sections.