> For the complete documentation index, see [llms.txt](https://docs.powermonitor.com.br/llms.txt). Markdown versions of documentation pages are available by appending `.md` to page URLs; this page is available as [Markdown](https://docs.powermonitor.com.br/en/power-monitor/monitoramento/capacidades.md).

# Capacities

Track in near real time the state and Capacity Units usage of each monitored Microsoft Fabric / Power BI capacity.

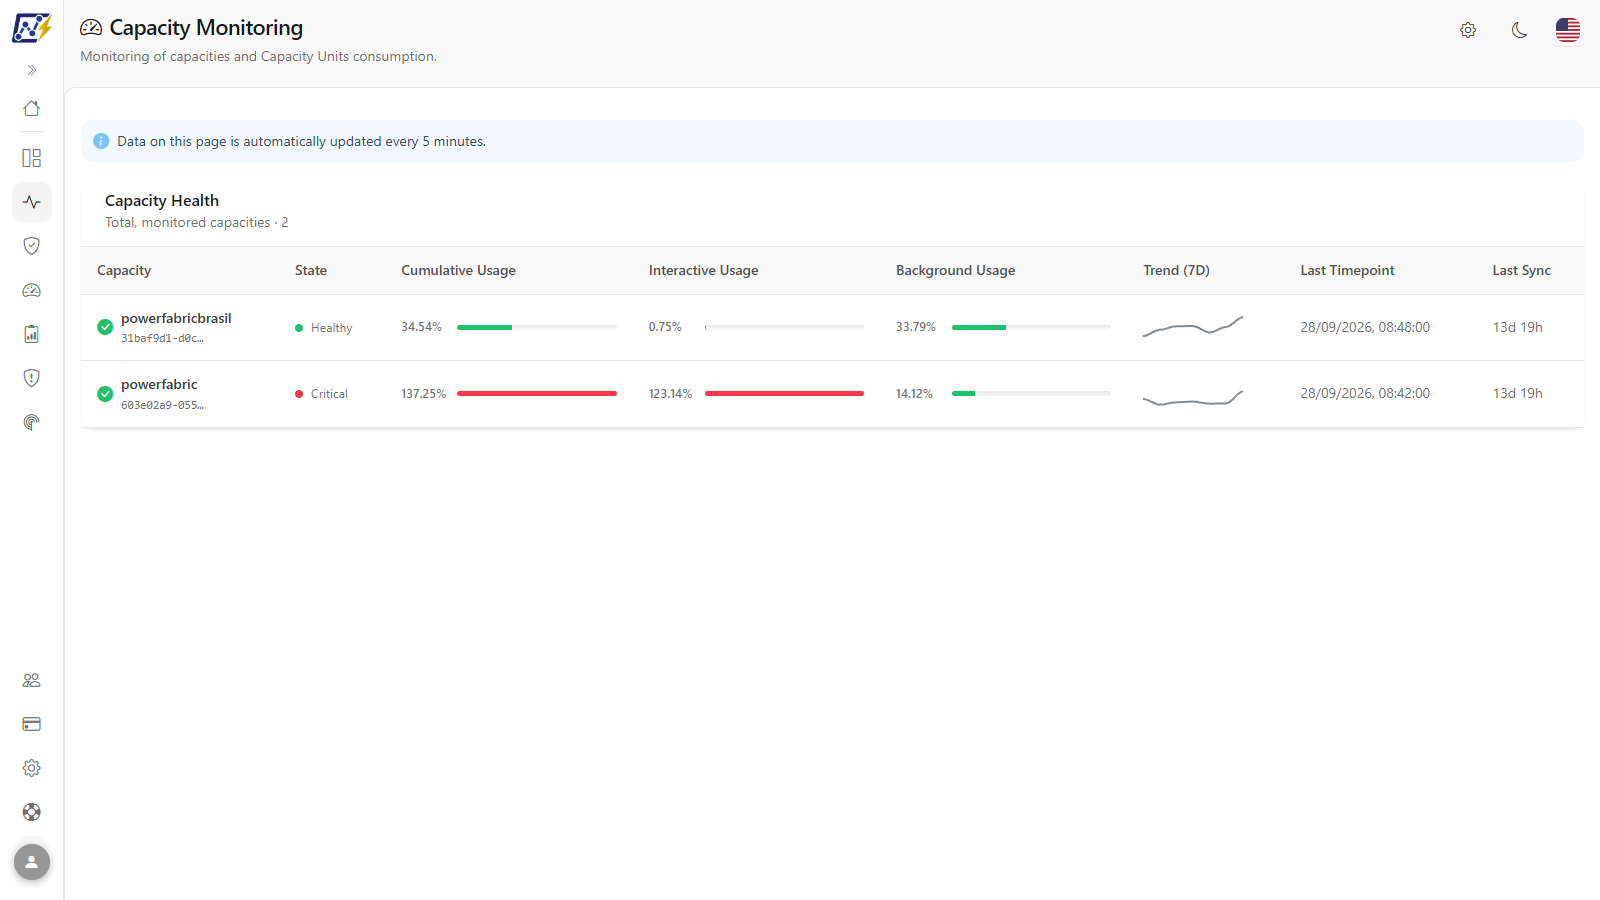
The **Capacities** screen (page title: **Capacity Monitoring**) shows, for each Fabric / Power BI capacity that your organization has enabled for monitoring, the last measured Capacity Units (CU) usage percentage, split between **Interactive** and **Background** load, the trend of the last 7 days and the time of the last synchronization.

**How to access:**

* *Monitoring › Capacities*; or
* *Capacities › Capacity Monitoring* (same screen, through the domain that groups all capacity pages; see [Capacities (menu)](/en/power-monitor/capacidades.md)).

The screen is available to **all user profiles**. Turning monitoring of a capacity on or off is an action exclusive to **Administrators**, done in *Settings › Monitoring* (see [Enable Capacity Monitoring](/en/power-monitor/monitoramento/capacidades/ativar-monitoramento-de-capacidade.md)). If an administrator blocks this page for your user, it no longer appears in the menu.

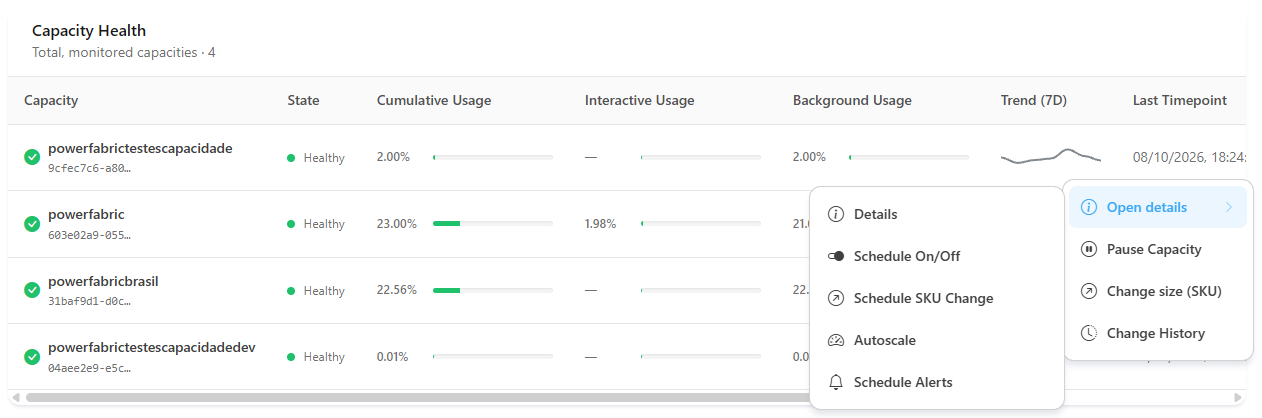
Each row also has an **actions menu** (⋮ or right-click) with the same items as *Governance › Capacities*: open the details, pause or turn on, **Change size (SKU)** and view the **Change History** (see [Row actions menu](#row-actions-menu)).

<figure><picture><source srcset="/files/OLAEyNKcnbvpZEp6sSx4" media="(prefers-color-scheme: dark)"><img src="https://3938213054-files.gitbook.io/~/files/v0/b/gitbook-x-prod.appspot.com/o/spaces%2FH2bFRBmIfyK3kwVKbldl%2Fuploads%2Fgit-blob-73ed18dd772afcdd72bff47d6a53af0aab40736f%2Fpm-monitoramento-capacidades-en.png?alt=media" alt="Capacity Monitoring screen with the Capacity Health table"></picture><figcaption><p>Capacity Monitoring: one row per monitored capacity</p></figcaption></figure>

## What it is for

* **Know at a glance whether any capacity is close to the limit** of the contracted SKU (cumulative usage in yellow or red).
* **Separate who is consuming:** users interacting with reports (Interactive) or automatic routines such as refreshes, pipelines and notebooks (Background).
* **Confirm that the collection is alive:** the *Last Timepoint* and *Last Sync* columns show when the data was measured and when it reached Power Monitor.
* **Check whether a capacity was paused** at the expected time (*Inactive* state).

For historical and root-cause analyses (which workspace, item or user consumed), use the [Capacity Dashboard](/en/power-monitor/dashboards/dashboard-de-capacidade.md), [Consumption History](/en/power-monitor/monitoramento/historico-de-consumo.md) and [Consumption Comparison](/en/power-monitor/monitoramento/comparativo-de-consumo.md).

## Features

The table has no filters, sorting or export; the available actions are those of the [row menu](#row-actions-menu). For slicing and CSV export, use [Consumption History](/en/power-monitor/monitoramento/historico-de-consumo.md) and [Consumption Comparison](/en/power-monitor/monitoramento/comparativo-de-consumo.md).

### Automatic refresh

**What it is:** the information strip at the top of the page, with the text *"Data on this page is automatically updated every 5 minutes."*

**What it is for:** leave the screen open on a monitor or in a pinned tab and follow the capacities without having to reload the page.

<figure><picture><source srcset="/files/wuZMtGSuzRGEuUBdqAu5" media="(prefers-color-scheme: dark)"><img src="https://3938213054-files.gitbook.io/~/files/v0/b/gitbook-x-prod.appspot.com/o/spaces%2FH2bFRBmIfyK3kwVKbldl%2Fuploads%2Fgit-blob-fbb4b9ff722393a7111d0d947d71eb0a99d6a527%2Fpm-monitoramento-capacidades-aviso-atualizacao-en.png?alt=media" alt="Automatic refresh information strip at the top of the Capacity Monitoring screen"></picture><figcaption><p>Automatic refresh notice</p></figcaption></figure>

**How to use:**

1. Go to *Monitoring › Capacities* and keep the page open.
2. There is no need to reload: the list is queried again on its own.

**How it works:** while the page is open, the list is queried again every 6 minutes, aligned with the clock. The data collection itself runs every 5 minutes in Power Monitor (see [Rules and behavior](#rules-and-behavior)).

### Trial capacities about to expire

**What it is:** the **Trial capacities about to expire** strip, at the top of the page, with one line per Fabric trial capacity that has assigned workspaces and expires in 14 days or less (or has already expired): the name, the expiration date (UTC), how many workspaces will be affected and, when applicable, the estimated date notice.

**What it is for:** plan the migration of the workspaces to a paid capacity before the trial ends and access to the content is lost.

**How to use:** read the lines of the strip and move the workspaces of each listed capacity to a paid capacity, for example through the [bulk capacity change](/en/power-monitor/governanca/workspaces.md#change-capacity-in-bulk) in *Governance › Workspaces*.

**How it works:** the strip uses the same summary as the global trial notice shown at the top of every page (see [Notices at the top of the pages](/en/power-monitor/interface-e-navegacao.md#notices-at-the-top-of-the-pages)). When no capacity is in this situation, it does not appear. The date is estimated from the creation date when the capacity name does not include the date.

### On-demand capacities (F0) legend

**What it is:** the **On-demand capacities (F0)** informational strip, displayed at the top when there is at least one F0 capacity in the list.

**What it is for:** explain why those rows have no usage percentages: F0 capacities are serverless and have no provisioned CUs, so they show no utilization %, do not count as turned off, and their cost is variable (per consumption).

**How it works:** on F0 rows, the **Capacity** column shows the **On-demand (F0)** badge, the **State** column shows **On-demand**, the usage columns and the **Trend (7D)** show "—" (hover to read "No utilization %: F0 has no provisioned CU limit.") and the actions menu shows **Pause Capacity** and **Change size (SKU)** disabled.

### "Capacity Health" table

**What it is:** the main card of the screen, with one row per monitored capacity. The card subtitle (*Total, monitored capacities*) shows how many capacities are in the list.

**What it is for:** have, in one place, the state, usage, trend and freshness of the data of all the organization's monitored capacities.

<figure><picture><source srcset="/files/uoZo8WaKgelEALPm47Mg" media="(prefers-color-scheme: dark)"><img src="https://3938213054-files.gitbook.io/~/files/v0/b/gitbook-x-prod.appspot.com/o/spaces%2FH2bFRBmIfyK3kwVKbldl%2Fuploads%2Fgit-blob-e26bbc57ac400450a35607eb2d9346689a224135%2Fpm-monitoramento-capacidades-tabela-saude-en.png?alt=media" alt="Capacity Health card with the state, usage, trend and sync columns"></picture><figcaption><p>Capacity Health card</p></figcaption></figure>

| Column                | What it shows                                                                                                                                                                                                                                   |
| --------------------- | ----------------------------------------------------------------------------------------------------------------------------------------------------------------------------------------------------------------------------------------------- |
| **Capacity**          | Capacity state icon, name and the abbreviated identifier (GUID), with the **On-demand (F0)** badge on F0 capacities and the trial expiration badge (**Trial: expires in&#x20;*****N*****&#x20;days** or **Trial expired**) on trial capacities. |
| **State**             | Health status derived from the state and the cumulative usage (see [Health status](#health-status-state-column)).                                                                                                                               |
| **Cumulative Usage**  | SKU Capacity Units usage percentage at the last measured point, considering the smoothing applied by Microsoft, with a colored bar.                                                                                                             |
| **Interactive Usage** | Billable portion of the usage coming from interactive operations (report queries, visuals, DAX).                                                                                                                                                |
| **Background Usage**  | Billable portion coming from background operations (model refreshes, pipelines, notebooks, Dataflows, etc.).                                                                                                                                    |
| **Trend (7D)**        | Sparkline of the usage over the last 7 days.                                                                                                                                                                                                    |
| **Last Timepoint**    | Date and time (in your time zone) of the last measurement point (*timepoint*) reported by the Capacity Metrics App.                                                                                                                             |
| **Last Sync**         | How long ago Power Monitor received this data (relative time).                                                                                                                                                                                  |
| **Actions**           | ⋮ button with the [row actions menu](#row-actions-menu) (column with no visible title; the menu also opens by right-clicking the row).                                                                                                          |

**How to use:**

1. Go to *Monitoring › Capacities* (or *Capacities › Capacity Monitoring*).
2. Go through the rows of the **Capacity Health** card. Each column is detailed in the following features.

**Empty state:** the message **"No capacities found."** indicates that no capacity has active monitoring. An administrator must enable it in *Settings › Monitoring* (see [Enable Capacity Monitoring](/en/power-monitor/monitoramento/capacidades/ativar-monitoramento-de-capacidade.md)).

### Capacity identification (name and GUID)

**What it is:** the **Capacity** column, with the state icon, the capacity name and the beginning of its identifier (GUID) in Fabric / Power BI.

**What it is for:** recognize the capacity by name and get the full GUID when you need to cross-reference the information with the Fabric portal, Azure or a support ticket.

<figure><picture><source srcset="/files/yichEZ9bWIEK66wB9wBl" media="(prefers-color-scheme: dark)"><img src="https://3938213054-files.gitbook.io/~/files/v0/b/gitbook-x-prod.appspot.com/o/spaces%2FH2bFRBmIfyK3kwVKbldl%2Fuploads%2Fgit-blob-a1d21d02353f8b7d568c35e76287b76380915028%2Fpm-monitoramento-capacidades-tooltip-guid-en.png?alt=media" alt="Tooltip with the full capacity GUID when hovering over the abbreviated identifier"></picture><figcaption><p>Full capacity GUID</p></figcaption></figure>

**How to use:**

1. Find the capacity by name in the **Capacity** column.
2. Hover over the abbreviated identifier, right below the name, to see the full GUID.

**How it works:** identifiers longer than 12 characters are abbreviated in the table. The icon next to the name indicates the state reported by Microsoft: green for active, gray for inactive (for example, paused) and yellow for unknown.

{% hint style="warning" %}
Be careful when pasting GUIDs and capacity names into tickets or external conversations: this is data from your environment.
{% endhint %}

### Health status (State column)

**What it is:** a badge with a colored dot that summarizes the situation of each capacity in one word.

**What it is for:** know at a glance whether any capacity is close to the limit of the contracted SKU or whether it was paused.

<figure><picture><source srcset="/files/9F7955XNuGHsLRv1vSdj" media="(prefers-color-scheme: dark)"><img src="https://3938213054-files.gitbook.io/~/files/v0/b/gitbook-x-prod.appspot.com/o/spaces%2FH2bFRBmIfyK3kwVKbldl%2Fuploads%2Fgit-blob-75511a3f9d44175a36d90d5956234b6eb6ae0265%2Fpm-monitoramento-capacidades-estados-en.png?alt=media" alt="Table rows with the health status of each capacity"></picture><figcaption><p>Health status per capacity</p></figcaption></figure>

| Status               | When it appears                                                                                  |
| -------------------- | ------------------------------------------------------------------------------------------------ |
| **Healthy** (green)  | Active capacity and cumulative usage below 60%.                                                  |
| **Warning** (yellow) | Cumulative usage between 60% and 79.99%.                                                         |
| **Critical** (red)   | Cumulative usage equal to or above 80%.                                                          |
| **Inactive** (gray)  | The capacity is inactive (for example, paused in Azure).                                         |
| **Unknown** (yellow) | The capacity state was not reported and usage is below 60%.                                      |
| **On-demand** (blue) | F0 (on-demand) capacity, with no provisioned CU limit: there is no usage percentage to evaluate. |

**How to use:**

1. Go through the **State** column: **Warning** (yellow) indicates cumulative usage from 60% and **Critical** (red), from 80%.
2. If the column shows **Inactive** and the icon next to the name is gray, the capacity is paused or inactive. The history of pauses and resumes is in [Capacity Actions](/en/power-monitor/auditoria/acoes-de-capacidade.md).

**How it works:** the **Inactive** status takes priority; for the other capacities, the status is calculated from the **Cumulative Usage**, with the 60% and 80% thresholds.

{% hint style="info" %}
**These thresholds (60% / 80%) apply to the colors on this screen.** On other screens, such as the [Capacity Actions](/en/power-monitor/auditoria/acoes-de-capacidade.md) log, Power Monitor uses the **Idle / Normal / Saturated / Critical** classification (below 20%, from 20% to 84.9%, from 85% to 99.9% and from 100% of total usage). See the full explanation in [Capacities (menu)](/en/power-monitor/capacidades.md#statuses-and-thresholds-used-on-the-capacity-screens).
{% endhint %}

### Cumulative, Interactive and Background Usage

**What it is:** three columns with the Capacity Units usage percentage at the last measured point, each with a colored bar: the total usage (**Cumulative Usage**) and the billable portions of **Interactive** and **Background** load.

**What it is for:** measure how busy the capacity is and separate who is consuming: users interacting with reports (Interactive) or automatic routines such as refreshes, pipelines and notebooks (Background).

<figure><picture><source srcset="/files/0K5uvw3kXBWKqwxHrUV7" media="(prefers-color-scheme: dark)"><img src="https://3938213054-files.gitbook.io/~/files/v0/b/gitbook-x-prod.appspot.com/o/spaces%2FH2bFRBmIfyK3kwVKbldl%2Fuploads%2Fgit-blob-a5a6c379eeec89eeddeaed4178e31c40ad63a71a%2Fpm-monitoramento-capacidades-uso-en.png?alt=media" alt="Row of a capacity with the Cumulative Usage, Interactive Usage and Background Usage bars"></picture><figcaption><p>Usage columns of a capacity</p></figcaption></figure>

**How to use:**

1. In the **Cumulative Usage** column, check the exact percentage of the capacity. Above 100%, the capacity is subject to *throttling*.
2. Compare the **Interactive Usage** and **Background Usage** columns: if Interactive predominates, the consumption comes from people using reports; if Background predominates, it comes from refreshes, pipelines, notebooks and other routines.
3. To find out which item or user caused the consumption, go to [Consumption History](/en/power-monitor/monitoramento/historico-de-consumo.md) or [Consumption Metrics](/en/power-monitor/monitoramento/metricas-de-consumo.md).

**How it works:** the bars follow the same colors as the status: green below 60%, yellow from 60% to 79.99% and red from 80%. The three percentages are published by the Capacity Metrics App for the same *timepoint*; the Cumulative Usage reflects Microsoft's smoothing and is not necessarily the simple sum of the two portions (see the frequently asked questions).

### Trend (7D)

**What it is:** a line sparkline, in the **Trend (7D)** column of the Capacity Health card, with the capacity usage over the last 7 days.

**What it is for:** notice whether the capacity has been gaining or losing load before usage reaches the limit.

**How to use:**

1. Look at the sparkline in the **Trend (7D)** column on the capacity's row.
2. A **red** line indicates that usage rose by more than 2 percentage points in the period; **green**, that it fell by more than 2 points; **gray**, that it remained stable or that there are not enough points to compare.
3. To compare periods in detail, use [Consumption Comparison](/en/power-monitor/monitoramento/comparativo-de-consumo.md) or [Consumption History](/en/power-monitor/monitoramento/historico-de-consumo.md).

**How it works:** the color compares the first and last points available in the 7-day window. With no history points in the period, the column shows "—".

### Last Timepoint and Last Sync

**What it is:** two date columns: **Last Timepoint** is the moment of the last measurement point published by the Capacity Metrics App; **Last Sync** is how long ago that data reached Power Monitor, in relative time.

**What it is for:** confirm that the collection is working and know how recent the number you are reading is.

<figure><picture><source srcset="/files/n03L7mSxIJh04UdeN4MX" media="(prefers-color-scheme: dark)"><img src="https://3938213054-files.gitbook.io/~/files/v0/b/gitbook-x-prod.appspot.com/o/spaces%2FH2bFRBmIfyK3kwVKbldl%2Fuploads%2Fgit-blob-1d5869b6a2dbdfab2b56575d079af924f397f4f6%2Fpm-monitoramento-capacidades-ultima-sincronizacao-en.png?alt=media" alt="Tooltip with the exact date and time of a capacity&#x27;s last synchronization"></picture><figcaption><p>Last synchronization with exact date and time</p></figcaption></figure>

**How to use:**

{% stepper %}
{% step %}

### Check the last measured point

In the **Last Timepoint** column, see the date and time of the last point published by the Capacity Metrics App. A delay of a few minutes is normal.
{% endstep %}

{% step %}

### Check the last synchronization

In the **Last Sync** column, see how long ago the data reached Power Monitor. Hover over the value to see the exact date and time.
{% endstep %}

{% step %}

### Act if synchronization has stopped

If the value is very old, ask an **Administrator** to follow the frequently asked question *"The Last Sync column has been stuck for a long time"* below, checking the Metrics Source in *Settings › Monitoring*.
{% endstep %}
{% endstepper %}

**How it works:** the dates are displayed in your browser's time zone. The most recent *timepoint* depends on the Capacity Metrics App itself, which publishes the data with some delay relative to real time.

### Row actions menu

**What it is:** the ⋮ menu at the end of each table row (a column with no visible title, labeled **Actions** for screen readers), also opened by right-clicking the row. It is the **same menu and the same modals** as the [Governance › Infrastructure › Capacities](/en/power-monitor/governanca/infraestrutura/capacidades.md#row-actions-menu) screen.

**What it is for:** acting on the capacity without leaving monitoring: when you see a capacity in **Critical**, for example, you can change its size (SKU) right away, or pause an idle capacity.

<figure><picture><source srcset="/files/s0uCcgcVLXF1gNki82cu" media="(prefers-color-scheme: dark)"><img src="https://3938213054-files.gitbook.io/~/files/v0/b/gitbook-x-prod.appspot.com/o/spaces%2FH2bFRBmIfyK3kwVKbldl%2Fuploads%2Fgit-blob-93449d33800efc17958c07984c6bb3cadbab1b01%2Fpm-monitoramento-capacidades-menu-acoes-en.png?alt=media" alt="Actions menu open on a capacity in the Capacity Health table, with the Open details submenu"></picture><figcaption><p>Actions menu of a capacity in Monitoring › Capacities</p></figcaption></figure>

| Item                                      | What it does                                                                                                                                           |
| ----------------------------------------- | ------------------------------------------------------------------------------------------------------------------------------------------------------ |
| **Open details**                          | Opens the details modal. The submenu goes directly to each tab: *Details*, *Schedule On/Off*, *Schedule SKU Change*, *Autoscale* and *Schedule Alerts* |
| **Pause Capacity** / **Turn On Capacity** | The label changes according to the current state. Asks for confirmation and runs the action immediately in Azure                                       |
| **Change size (SKU)**                     | Opens the *Change capacity size (SKU)* modal to change the SKU now, with a cost preview                                                                |
| **Change History**                        | Opens the resource's activity log in Azure (only appears when the capacity has a Subscription and Resource Group configured)                           |

**How to use:**

1. Click **⋮** at the end of the capacity row (or right-click the row).
2. Click the desired item or, to go straight to a tab of the modal, hover over **Open details** and choose the tab in the submenu.
3. After pausing, turning on or changing the size, the table and the Governance inventory refresh on their own, without hiding the table behind the loading indicator.

**Rules:**

* **Who can run it:** the screen is visible to all profiles, but write actions (pause, turn on, change size (SKU), schedules, autoscale, schedule alerts and saving the Azure location) are exclusive to **Administrators**, with the same rules as [Governance › Capacities](/en/power-monitor/governanca/infraestrutura/capacidades.md): for other profiles the menu appears, but the server rejects the action and, in the details modal, the save fields are disabled with the tooltip "This action is restricted to organization administrators.".
* **Trial capacities (Fabric Trial, FT SKU):** the menu shows only **Open details** (only the *Details* tab) and, when applicable, **Change History**.
* **On-demand capacities (F0):** **Pause Capacity** and **Change size (SKU)** appear disabled, with the hint "Unavailable for F0: an on-demand capacity cannot be paused, resumed, resized or scheduled.".
* **Change History** only appears when the capacity has a known **Subscription** and **Resource Group** (see [Governance › Capacities](/en/power-monitor/governanca/infraestrutura/capacidades.md#how-to-prepare-a-capacity-to-be-operated-by-power-monitor)).
* **Rows without a menu:** the row shows no ⋮ button and does not open the menu on right-click when the capacity is not yet in the Governance inventory (for example, it was just discovered and has not been collected yet) or when it is **Premium Per User (PP3)**, which Governance does not list.
* **If the Governance inventory fails to load** (for example, the *Governance › Capacities* page is blocked for your user), only the menu disappears; the **Capacity Health** table keeps working normally.

### Include a capacity that does not appear in the list

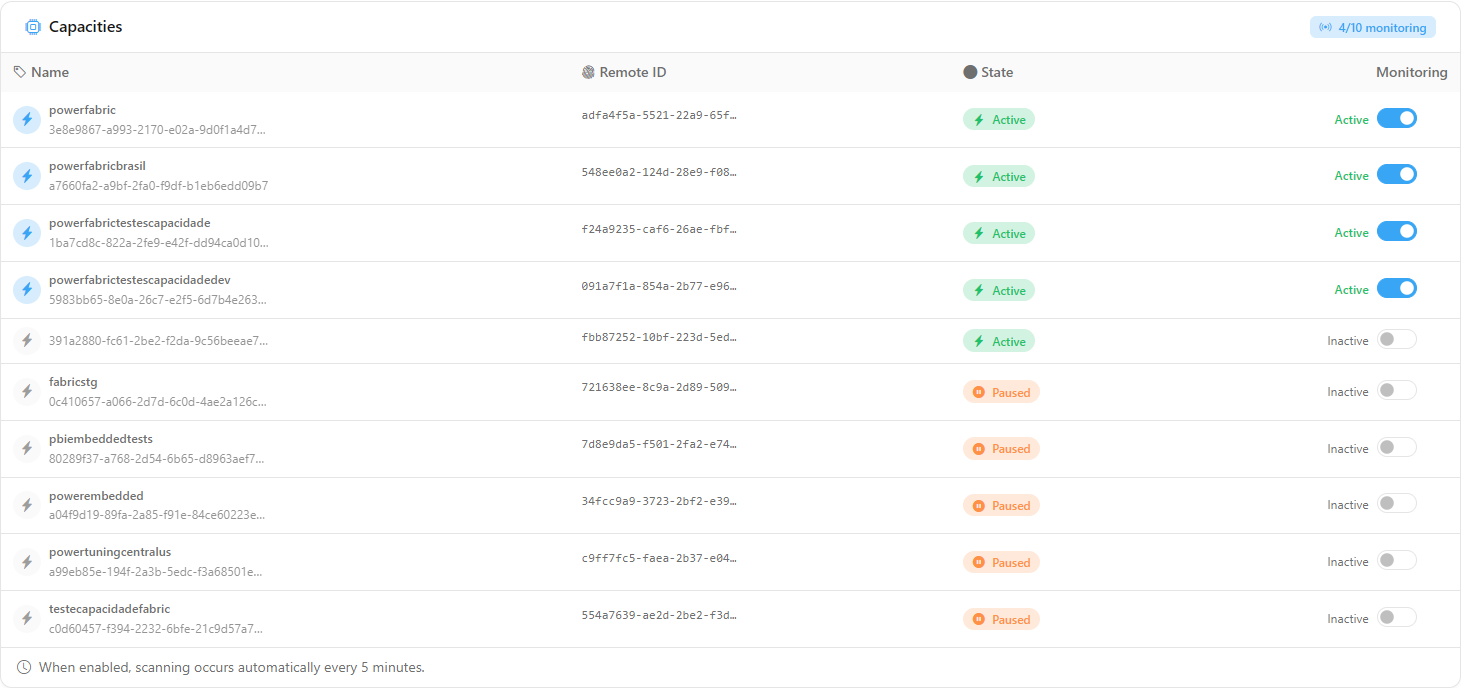
**What it is:** the path to start monitoring a capacity. Adding it is not done on this screen, but in the **Capacities** card of *Settings › Monitoring*.

**What it is for:** start tracking a new capacity or one that had monitoring turned off.

<figure><picture><source srcset="/files/EqpeqjHIfCShoj0fBSoE" media="(prefers-color-scheme: dark)"><img src="https://3938213054-files.gitbook.io/~/files/v0/b/gitbook-x-prod.appspot.com/o/spaces%2FH2bFRBmIfyK3kwVKbldl%2Fuploads%2Fgit-blob-1bf1c7c9a534292f1a63366714a1f1dc2000b9b9%2Fpm-configuracoes-monitoramento-capacidades-en.png?alt=media" alt="Capacities card in Settings › Monitoring with the per-capacity monitoring switches"></picture><figcaption><p>The monitoring switches are in Settings › Monitoring</p></figcaption></figure>

**How to use** (prerequisite: **Administrator** profile):

1. Open *Settings › Monitoring*.
2. In the **Capacities** card, turn on the switch in the **Monitoring** column for the desired capacity. If it is not listed, run the capacity scan (**Perform initial scan** button, when the list is empty, or the [Capacity Scan](/en/power-monitor/mapeamento/capacidades.md) screen).
3. Return to this screen: the capacity appears after the next collection. The complete step-by-step guide is in [Enable Capacity Monitoring](/en/power-monitor/monitoramento/capacidades/ativar-monitoramento-de-capacidade.md).

## Rules and behavior

* **Data source:** the percentages come from the **Microsoft Fabric Capacity Metrics App** installed in your tenant, read by the Power Monitor Service Principal. Without the app configured as the metrics source, there is no consumption data (see [Enable Capacity Monitoring](/en/power-monitor/monitoramento/capacidades/ativar-monitoramento-de-capacidade.md)).
* **Collection frequency:** while there is at least one capacity with active monitoring, Power Monitor collects capacity consumption **every 5 minutes**. The most recent *timepoint* depends on the Capacity Metrics App itself, which publishes the data with some delay relative to real time.
* **Only monitored capacities:** capacities whose monitoring is turned off in *Settings › Monitoring* do not appear here and are not included in the totals of the other consumption screens.
* **Capacities are tenant resources:** they appear for all users, regardless of the workspace scope configured for each user.
* **F0 capacities (on-demand):** they are left out of the active and inactive counts and of every usage % calculation, and do not generate capacity-off alerts, because they are never paused.

### Alerts generated by capacity monitoring

The same 5-minute collection evaluates the health of each monitored capacity and records alerts on the [Alerts](/en/power-monitor/monitoramento/alertas.md) screen, sending emails to the recipients configured in *Settings › Notifications*:

| Situation                                             | Alert / email                                                                                                                                                  |
| ----------------------------------------------------- | -------------------------------------------------------------------------------------------------------------------------------------------------------------- |
| Cumulative usage **equal to or above 80%**            | Opens an incident and sends a usage limit email. While the incident remains open, new notices are sent after 30 minutes and, after that, at most every 1 hour. |
| High **background** usage (from about 50%)            | Sends a high background usage email, **at most once a day for each band** (50%, 70%, 80% and 100%).                                                            |
| **Inactive** capacity or capacity being deprovisioned | Opens an incident and sends a capacity offline email.                                                                                                          |
| Capacity returns to normal                            | Closes the incident and sends a recovery email with the current consumption.                                                                                   |
| No new consumption data for **more than 45 minutes**  | Sends a "data unavailable" alert (once per episode). Does not apply to Premium Per User and Pro capacities, which do not publish telemetry.                    |

In addition, the environment's hourly checklist uses the **background threshold** configured in *Settings › Monitoring* (default of 50%).

## Frequently asked questions

<details>

<summary>A capacity that exists in Fabric does not appear in this list.</summary>

This screen only lists capacities with **active monitoring**. Ask an administrator to open *Settings › Monitoring*, check whether the capacity appears in the **Capacities** card and turn its switch on. If it does not even appear in Settings, confirm that the Capacity Metrics Source is **Configured and validated** and run the capacity scan: with the list empty, through the **Perform initial scan** button on the card itself; with the list already filled in, through the [Capacity Scan](/en/power-monitor/mapeamento/capacidades.md) screen.

</details>

<details>

<summary>The "Last Sync" column has been stuck for a long time.</summary>

The collection may have stopped due to lack of access to the Capacity Metrics App (for example, the Service Principal lost access to the app's workspace or the app was reinstalled). In *Settings › Monitoring*, use **Test connection** on the Capacity Metrics Source card and check whether the **"Automatic cycle stopped"** notice appears on the Capacities card; in that case, click **Reactivate monitoring**. After 45 minutes without data, Power Monitor also sends a data unavailable alert.

</details>

<details>

<summary>Why do some rows have no ⋮ button (actions menu)?</summary>

The capacity is not yet in the Governance inventory (wait for the next capacity collection or run the scan in [Mapping › Capacities](/en/power-monitor/mapeamento/capacidades.md)), it is **Premium Per User (PP3)**, or the Governance list could not be loaded for your user. In these cases the health table remains complete; only the menu is omitted.

</details>

<details>

<summary>I clicked Pause or Change size (SKU) and got an error message.</summary>

These actions only work for **Administrators** and require the capacity to be prepared (known Azure location and the Service Principal's **Contributor** role). See [Governance › Capacities](/en/power-monitor/governanca/infraestrutura/capacidades.md#how-to-prepare-a-capacity-to-be-operated-by-power-monitor).

</details>

<details>

<summary>Why doesn't the sum of Interactive and Background match the Cumulative Usage?</summary>

The three percentages are published by the Capacity Metrics App for the same *timepoint*, but the cumulative usage reflects Microsoft's smoothing (background load is spread over 24 hours and interactive load over a few minutes) and may include adjustments that do not boil down to the simple sum of the two portions. Use the Cumulative Usage to assess the risk of *throttling* and the two portions to understand the consumption profile.

</details>

<details>

<summary>Usage went above 100%. Is that possible?</summary>

Yes. Above 100% the capacity is using more than the SKU supports and Microsoft may apply delay or rejection (*throttling*) to new operations. Investigate what consumed it in the [Capacity Dashboard](/en/power-monitor/dashboards/dashboard-de-capacidade.md) and in [Consumption Anomalies](/en/power-monitor/monitoramento/anomalias-de-consumo.md).

</details>

## Related pages

* [Enable Capacity Monitoring](/en/power-monitor/monitoramento/capacidades/ativar-monitoramento-de-capacidade.md)
* [Capacities (menu)](/en/power-monitor/capacidades.md)
* [Governance › Capacities](/en/power-monitor/governanca/infraestrutura/capacidades.md)
* [Capacity Dashboard](/en/power-monitor/dashboards/dashboard-de-capacidade.md)
* [Consumption History](/en/power-monitor/monitoramento/historico-de-consumo.md)
* [Consumption Comparison](/en/power-monitor/monitoramento/comparativo-de-consumo.md)
* [Consumption Anomalies](/en/power-monitor/monitoramento/anomalias-de-consumo.md)
* [Alerts](/en/power-monitor/monitoramento/alertas.md)
* [Settings](/en/power-monitor/configuracoes.md)


---

# Agent Instructions
This documentation is published with GitBook. GitBook is the documentation platform designed so that both humans and AI agents can read, navigate, and reason over technical content effectively. Learn more at gitbook.com.

## Querying This Documentation
If you need additional information that is not directly available in this page, you can query the documentation by asking a question.

Perform an HTTP GET request on the following URL with the `ask` and `goal` query parameters:

```
GET https://docs.powermonitor.com.br/en/power-monitor/monitoramento/capacidades.md?ask=<question>&goal=<user_goal>
```

`ask` is the immediate question: it should be specific, self-contained, and written in natural language.
`goal` is what the user is ultimately trying to achieve, the reason they need the answer. Sharing it helps GitBook give you a better, more relevant answer. A goal is most helpful when it describes the outcome the user wants rather than restating the question. For example, with `ask=how do I create an API token`, a goal like `automate deployments from our CI pipeline` lets GitBook tailor the answer to that use case.

The response will contain a direct answer to the question and relevant excerpts and sources from the documentation.

Use this mechanism when the answer is not explicitly present in the current page, you need clarification or additional context, or you want to retrieve related documentation sections.