> For the complete documentation index, see [llms.txt](https://docs.powermonitor.com.br/llms.txt). Markdown versions of documentation pages are available by appending `.md` to page URLs; this page is available as [Markdown](https://docs.powermonitor.com.br/en/power-monitor/monitoramento/capacidades/ativar-monitoramento-de-capacidade.md).

# Enable Capacity Monitoring

Step-by-step guide to install the Fabric Capacity Metrics App, configure the Capacity Metrics Source and turn on monitoring of your capacities.

All of Power Monitor's consumption screens (Capacity Monitoring, Capacity Dashboard, Consumption Comparison, Consumption History and Consumption Metrics, Consumption Anomalies) depend on one source: the **Microsoft Fabric Capacity Metrics App**, an official Microsoft app installed in your tenant. Power Monitor reads this app's semantic model with your Service Principal and, from there, collects Capacity Units (CU) consumption every 5 minutes.

**How to access:** the configuration is in *Settings › Monitoring*, in the **Capacities** and **Capacity Metrics Source** cards. The Settings area is exclusive to **Administrators**; other profiles do not see this menu.

This guide covers the five steps:

1. Install (or update) the Capacity Metrics App in the Power BI Service.
2. Give the Power Monitor Service Principal access to the app's workspace.
3. Make sure the app's workspace is in the Power Monitor inventory.
4. Configure the **Capacity Metrics Source** in *Settings › Monitoring*.
5. Turn on monitoring for each capacity.

{% hint style="success" %}
**New organizations:** the Power Monitor setup wizard has an optional **Capacity Metrics Source** step. It lists the tenant workspaces that already have the Capacity Metrics App, adds the Service Principal as Admin of the chosen workspace and, when you save, **automatically turns on monitoring for all of the organization's capacities** as soon as a validation collection confirms that the source works. If you completed that step, you usually only need to check the result in step 5 below.
{% endhint %}

## Prerequisites

* **Administrator** profile in Power Monitor (the *Settings › Monitoring* tab is exclusive to administrators).
* In Power BI / Fabric, an account that is an **administrator of the capacities** you want to monitor (it is the one that installs and configures the app). On a **Fabric Trial capacity**, use the account that started the Trial.
* Permission to manage access to the workspace where the app is installed.
* The Fabric tenant setting **Semantic Model Execute Queries REST API** (*Dataset Execute Queries REST API*) enabled for the Power Monitor security group. Power Monitor detects when it is disabled and offers a button to enable it (see [Enable the semantic model query API](#enable-the-semantic-model-query-api)).

{% hint style="warning" %}
Be careful when sharing screenshots or pasting information from these screens (capacity IDs, workspace names, emails) in tickets or conversations: this is data from your environment.
{% endhint %}

## How to enable capacity monitoring for the first time

{% stepper %}
{% step %}

### Install the Microsoft Fabric Capacity Metrics App

In the [Power BI Service](https://app.powerbi.com), open **Apps › Get apps**.

<figure><img src="https://3938213054-files.gitbook.io/~/files/v0/b/gitbook-x-prod.appspot.com/o/spaces%2FH2bFRBmIfyK3kwVKbldl%2Fuploads%2Fgit-blob-a3905a99f48624593ddfe2554b9720913f1b875b%2Fimage%20(19).png?alt=media" alt="Get apps button in the Power BI Service"><figcaption><p>Apps › Get apps</p></figcaption></figure>

Search for **Fabric Capacity Metrics** and click **Get it now**.

<figure><img src="https://3938213054-files.gitbook.io/~/files/v0/b/gitbook-x-prod.appspot.com/o/spaces%2FH2bFRBmIfyK3kwVKbldl%2Fuploads%2Fgit-blob-dc73068a21fda9dad5106e826bc02961eec335d7%2Fimage%20(21).png?alt=media" alt="Microsoft Fabric Capacity Metrics in the app store"><figcaption><p>Microsoft Fabric Capacity Metrics on AppSource</p></figcaption></figure>

Confirm the installation with **Install**.

<figure><img src="https://3938213054-files.gitbook.io/~/files/v0/b/gitbook-x-prod.appspot.com/o/spaces%2FH2bFRBmIfyK3kwVKbldl%2Fuploads%2Fgit-blob-4a6b036f775dcb8be47a23e5572732ca0fd4175b%2Fimage%20(22).png?alt=media" alt="Microsoft Fabric Capacity Metrics installation confirmation"><figcaption><p>Installation confirmation</p></figcaption></figure>

If the app is already installed in the tenant, Microsoft asks how to update it. You can **update the existing installation** or **install another copy of the app into a new workspace**; a copy dedicated to Power Monitor prevents someone from changing or removing it without realizing the impact. The name of the new workspace is up to you.

{% hint style="success" %}
**Prefer a Pro workspace.** Microsoft recommends installing the Capacity Metrics App in a Pro workspace to avoid throttling, and Power Monitor works normally with it there. In a Pro workspace, the queries Power Monitor runs on the app every 5 minutes consume no capacity. In a workspace on a capacity, they consume CU from that capacity (the largest consumption on the platform) and administrators start seeing a notice at the top of the screens. See [Fabric capacity consumption](/en/power-monitor/configuracoes/monitoramento.md#fabric-capacity-consumption).
{% endhint %}

<figure><img src="https://3938213054-files.gitbook.io/~/files/v0/b/gitbook-x-prod.appspot.com/o/spaces%2FH2bFRBmIfyK3kwVKbldl%2Fuploads%2Fgit-blob-aebeec5fe97a4d387e463350e922e4533bc3ddff%2Fimage%20(23).png?alt=media" alt="Install another copy of the app into a new workspace option"><figcaption><p>Installing a dedicated copy in a new workspace</p></figcaption></figure>

When you open the app for the first time, connect it to the data by entering the parameters requested by Microsoft, mainly the **capacity ID** (*DefaultCapacityID* parameter) and the **UTC\_offset** (your organization's time zone, for example `-3` for Brasília). Power Monitor uses this time zone to define the "day" on all consumption screens.

{% hint style="info" %}
**It is no longer necessary to rename the workspace to "PowerMonitor-Metrics".** The app's workspace and semantic model are chosen explicitly in step 4. Organizations that already used a workspace with that name keep working.
{% endhint %}

{% hint style="warning" %}
Keep the app **up to date**. Old versions have a different structure and are rejected during validation with the message that the model does not have the expected structure (*Capacity Id* column of the *Capacities* table). In that case, uninstall the app and install it again.
{% endhint %}
{% endstep %}

{% step %}

### Give the Service Principal access to the app's workspace

Open the workspace where the app was installed and click **Manage access › Add people or groups**.

<figure><img src="https://3938213054-files.gitbook.io/~/files/v0/b/gitbook-x-prod.appspot.com/o/spaces%2FH2bFRBmIfyK3kwVKbldl%2Fuploads%2Fgit-blob-869be17ce7ac35dfdc12a0fb4f416b2e416db8a6%2Fimage%20(26).png?alt=media" alt="Workspace Manage access"><figcaption><p>Manage access of the app's workspace</p></figcaption></figure>

Search for the Power Monitor Service Principal (by default, **PowerMonitor-APP**, or the name defined during your organization's installation) and add it as **Admin** of the workspace.

<figure><img src="https://3938213054-files.gitbook.io/~/files/v0/b/gitbook-x-prod.appspot.com/o/spaces%2FH2bFRBmIfyK3kwVKbldl%2Fuploads%2Fgit-blob-073523459cda817f0aa1073a36abbe94e4c8d4d0%2Fimage%20(27).png?alt=media" alt="Adding the PowerMonitor-APP Service Principal to the workspace"><figcaption><p>Adding the Service Principal as Admin</p></figcaption></figure>

The Service Principal needs, at a minimum, the **Build** permission on the app's semantic model, which is already granted to the workspace's Admin, Member and Contributor roles. Permission propagation at Microsoft can take a few minutes.
{% endstep %}

{% step %}

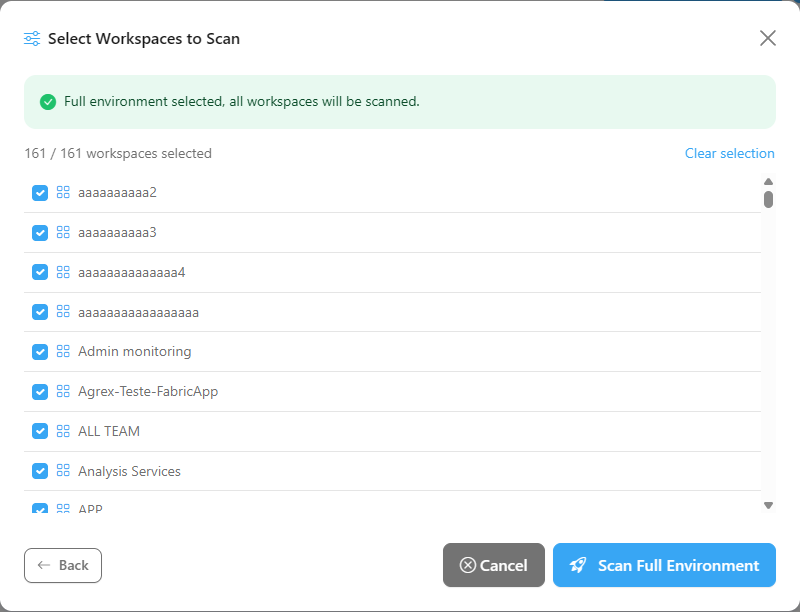
### Make sure the app's workspace is in the Power Monitor inventory

The list of workspaces in the next step shows only workspaces that the Service Principal can reach **and** that are among the workspaces monitored by Power Monitor. If the app's workspace is new:

1. Go to *Mapping › Inventory* and run a scan that includes this workspace (see [Inventory Scan](/en/power-monitor/mapeamento/inventarios.md)).
2. Wait for it to finish and confirm that it appears in *Governance › Workspaces*.

<figure><picture><source srcset="/files/9mFLtYUOBDtZvHVZohyb" media="(prefers-color-scheme: dark)"><img src="https://3938213054-files.gitbook.io/~/files/v0/b/gitbook-x-prod.appspot.com/o/spaces%2FH2bFRBmIfyK3kwVKbldl%2Fuploads%2Fgit-blob-043a61588b6282f86be1eed3d51b12db35188ad4%2Fpm-mapeamento-scan-inventarios-modal-selecionar-workspaces-en.png?alt=media" alt="Inventory Scan with the Capacity Metrics App workspace selected"></picture><figcaption><p>Inventory Scan including the app's workspace</p></figcaption></figure>
{% endstep %}

{% step %}

### Configure the Capacity Metrics Source

In Power Monitor, go to *Settings › Monitoring*, find the **Capacity Metrics Source** card, choose the app's **Workspace** and **Semantic model**, click **Test connection** and then **Save**. The card badge changes to **Configured and validated**.

The details of each field, button and message are in [Capacity Metrics Source card](#capacity-metrics-source-card) and in the following features.
{% endstep %}

{% step %}

### Turn on capacity monitoring

Still in *Settings › Monitoring*, in the **Capacities** card:

* If the list is empty (**No capacities found**), click **Perform initial scan** and wait for it to finish.
* For each capacity, turn on the switch in the **Monitoring** column.

Within a few minutes, the capacity appears in [Monitoring › Capacities](/en/power-monitor/monitoramento/capacidades.md) and the other consumption screens start considering it. See [Capacities card](#capacities-card) and [Per-capacity monitoring switch](#per-capacity-monitoring-switch).
{% endstep %}
{% endstepper %}

## Features

### Monitoring tab

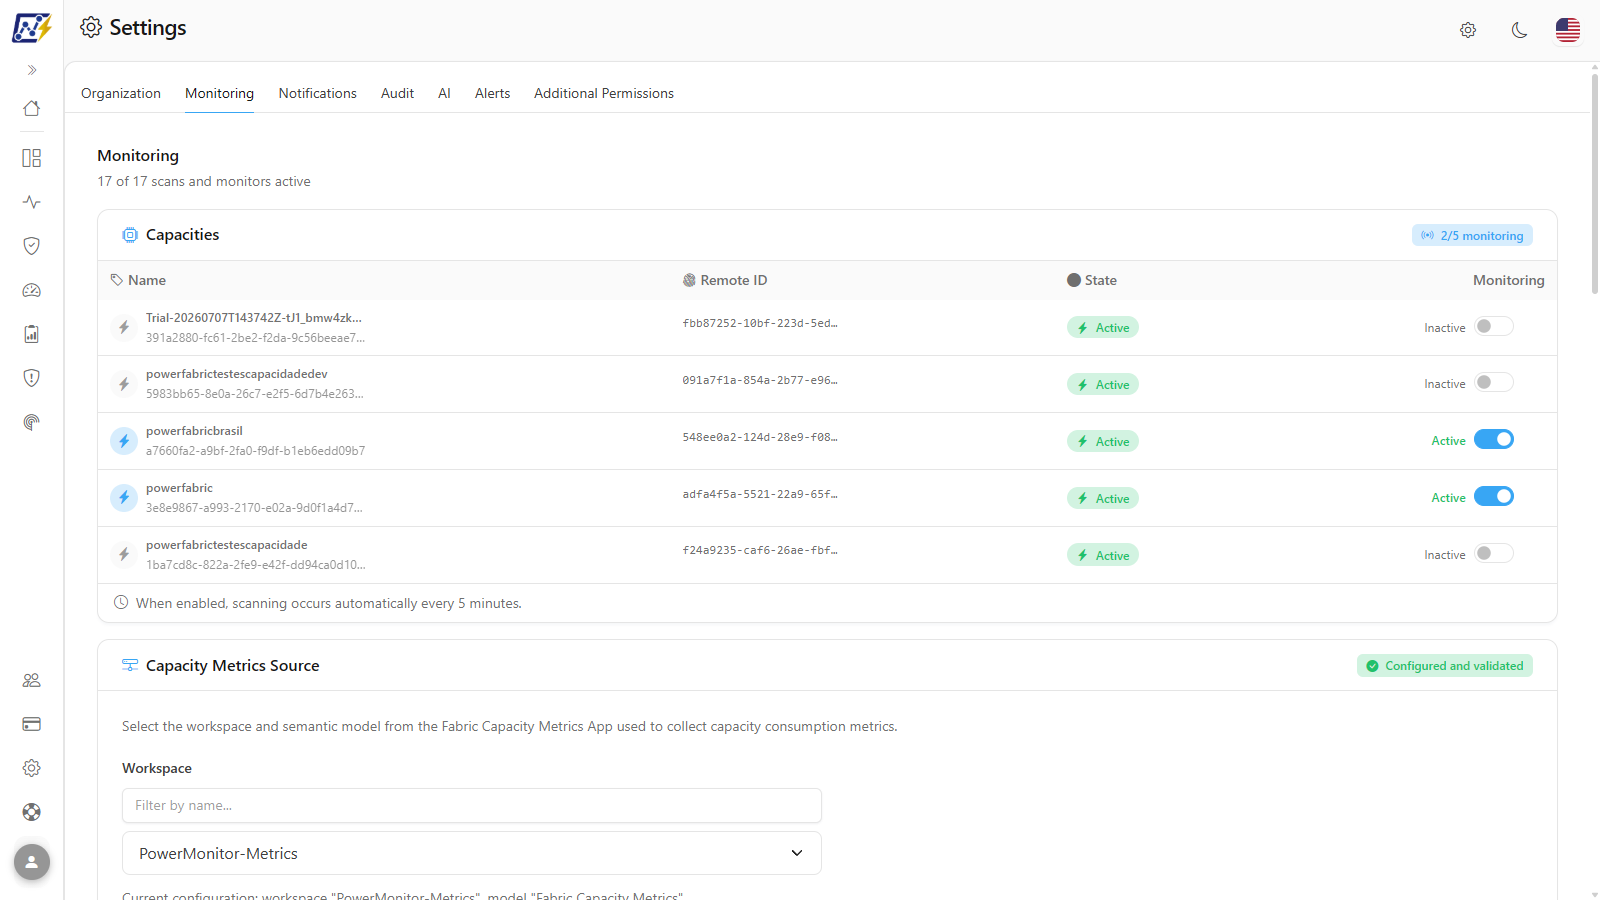
**What it is:** the *Settings › Monitoring* tab, which brings together, from top to bottom, the **Capacities** card, the **Capacity Metrics Source** card and the organization's other scan and monitoring settings. The tab header summarizes how many scans and monitors are active (for example, *5 of 24 scans and monitors active*); in this count, capacity monitoring counts as one item, active when at least one capacity is monitored.

**What it is for:** it is the only place where an administrator turns on capacity consumption collection and defines where the numbers come from.

<figure><picture><source srcset="/files/jMPbRy5kI10PQHAxB0bh" media="(prefers-color-scheme: dark)"><img src="https://3938213054-files.gitbook.io/~/files/v0/b/gitbook-x-prod.appspot.com/o/spaces%2FH2bFRBmIfyK3kwVKbldl%2Fuploads%2Fgit-blob-c4c07c68602cece33d0a9e4f584f7bcdb12ef871%2Fpm-configuracoes-monitoramento-en.png?alt=media" alt="Monitoring tab in Settings with the Capacities and Capacity Metrics Source cards"></picture><figcaption><p>Settings › Monitoring tab</p></figcaption></figure>

**How to use:**

1. In the menu, open **Settings** and click the **Monitoring** tab.
2. Wait for it to load: the tab is only displayed after all sections finish loading.
3. Success or error messages for the actions appear in a strip at the top of the tab and disappear on their own after a few seconds.

**How it works:** the tab is exclusive to **Administrators**. The other sections (governance scans, resource monitoring and average execution time deviation) are described in [Settings](/en/power-monitor/configuracoes.md).

### Capacity Metrics Source card

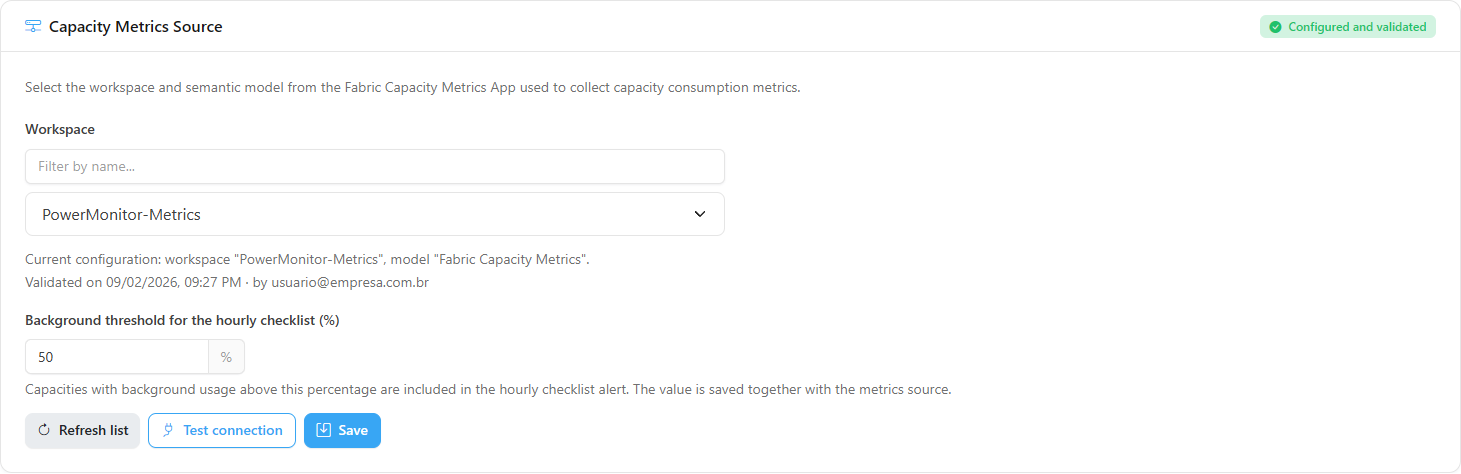
**What it is:** the card in which you tell Power Monitor which workspace and which semantic model of the Fabric Capacity Metrics App to use to collect consumption metrics. The badge in the corner of the card shows the state of the source: **Configured and validated**, **Not configured** or **Validation failed**.

**What it is for:** without a configured and validated source, there is no data on any consumption screen and Power Monitor refuses to enable capacity monitoring.

<figure><picture><source srcset="/files/VDN4fmcHlsZqSwYaiwzl" media="(prefers-color-scheme: dark)"><img src="https://3938213054-files.gitbook.io/~/files/v0/b/gitbook-x-prod.appspot.com/o/spaces%2FH2bFRBmIfyK3kwVKbldl%2Fuploads%2Fgit-blob-adf0517d39ab564cc5b7ce0335d889fa3085a42f%2Fpm-configuracoes-monitoramento-fonte-metricas-en.png?alt=media" alt="Capacity Metrics Source card in Settings › Monitoring"></picture><figcaption><p>Capacity Metrics Source card</p></figcaption></figure>

**How to use:**

1. In *Settings › Monitoring*, find the **Capacity Metrics Source** card.
2. Check the card badge. If it is **Configured and validated**, the line *Current configuration: workspace "...", model "..."* shows the source in use, with the validation date (*Validated on ...*) and who performed it.
3. If it is **Not configured** or **Validation failed**, follow the features below to choose, test and save the source.

**"No workspaces available" state:** appears when the Service Principal does not yet have access to any monitored workspace. The **Grant workspace access** button opens *Governance › Workspaces*; after granting access, go back to steps 2 and 3 of the step-by-step guide above.

### Workspace and semantic model selection

**What it is:** the **Workspace** (with the **Filter by name...** search) and **Semantic model** fields, which point to the Capacity Metrics App installed in the tenant.

**What it is for:** indicate exactly which copy of the app Power Monitor should read, including when there is more than one installation in the tenant.

<figure><picture><source srcset="/files/Zapu2yUNx5i9hCFogSCp" media="(prefers-color-scheme: dark)"><img src="https://3938213054-files.gitbook.io/~/files/v0/b/gitbook-x-prod.appspot.com/o/spaces%2FH2bFRBmIfyK3kwVKbldl%2Fuploads%2Fgit-blob-67db232ae7a2ffe9168eb2e5bdad6f204967387c%2Fpm-configuracoes-monitoramento-fonte-metricas-workspace-en.png?alt=media" alt="Workspace field with the Filter by name search and the list of workspaces"></picture><figcaption><p>Choosing the Capacity Metrics App workspace</p></figcaption></figure>

**How to use:**

1. In **Workspace**, type part of the name in the **Filter by name...** field and select the app's workspace from the list (*Select a workspace*).
2. If the workspace is not in the list, click **Refresh list**. The button shows **Refreshing...** while the list is reloaded.
3. If the workspace has more than one semantic model, the **Semantic model** field appears: choose the Capacity Metrics App model. With a single model, it is selected automatically and the field is not displayed.

**How it works:** the list shows only workspaces that the Service Principal can reach **and** that are already in the Power Monitor inventory. If the chosen workspace has no semantic model, the card warns *The selected workspace does not contain any semantic model.* and the test and save buttons are unavailable.

### Test connection

**What it is:** the **Test connection** button, which runs a validation query on the chosen model and shows the result on the card itself.

**What it is for:** confirm, before saving, that the Service Principal can read the app; and diagnose the cause when the consumption screens stop receiving data.

<figure><picture><source srcset="/files/nxA2FHmmMM4pzw1UfPJ9" media="(prefers-color-scheme: dark)"><img src="https://3938213054-files.gitbook.io/~/files/v0/b/gitbook-x-prod.appspot.com/o/spaces%2FH2bFRBmIfyK3kwVKbldl%2Fuploads%2Fgit-blob-ea3ed0dd277fc726249f67ae6422942f946366f1%2Fpm-configuracoes-monitoramento-fonte-metricas-acoes-en.png?alt=media" alt="Refresh list, Test connection and Save buttons of the Capacity Metrics Source card"></picture><figcaption><p>Capacity Metrics Source card buttons</p></figcaption></figure>

**How to use:**

1. Check the selected **Workspace** and **Semantic model** (the button is only available with both chosen).
2. Click **Test connection**. The button shows **Testing...** while the query runs.
3. Read the result. When Power BI returns an error, the original text appears in **Power BI response:**, for diagnosis.

| Message                                                                                                  | What to do                                                                                                                       |
| -------------------------------------------------------------------------------------------------------- | -------------------------------------------------------------------------------------------------------------------------------- |
| *Valid configuration.*                                                                                   | Nothing, you can save.                                                                                                           |
| *The Service Principal does not have Build permission on the selected semantic model.*                   | Review step 2 of the step-by-step guide and wait for propagation.                                                                |
| *The selected semantic model does not have the expected structure of the Fabric Capacity Metrics App...* | You chose another model, or the app is outdated: reinstall it.                                                                   |
| *The Fabric Capacity Metrics App in this workspace has no capacity loaded yet...*                        | Open the app in Power BI, finish connecting its data and wait for the semantic model to refresh, then click **Test connection**. |
| *Could not reach the selected workspace or semantic model.*                                              | Check whether the workspace and the model still exist and whether the Service Principal has access.                              |
| *The Fabric tenant has disabled the semantic model query API (DatasetExecuteQueries)...*                 | Changing the workspace does not solve it. See [Enable the semantic model query API](#enable-the-semantic-model-query-api).       |

### Enable the semantic model query API

**What it is:** the block with the **Enable and test again** and **Open Fabric settings** buttons, which appears on the card when the test reports that the semantic model query API (*DatasetExecuteQueries*) is disabled in the tenant.

**What it is for:** enable, without leaving Power Monitor, the tenant setting that the metrics collection depends on.

**How to use** (prerequisites: **Administrator** profile in Power Monitor and a **Fabric administrator** account):

{% stepper %}
{% step %}

### Click Enable and test again

The action enables only this setting for the Power Monitor security group, preserving the other groups and exclusions. The button shows **Enabling…** while the action runs.
{% endstep %}

{% step %}

### Grant consent, if requested

Microsoft may open a window asking for consent. Accept it with the Fabric administrator account.
{% endstep %}

{% step %}

### Check the result

The test is run again automatically. If Microsoft still reports the API as disabled, wait a few minutes and click **Test connection**. If automatic enabling fails, click **Open Fabric settings** and add the Power Monitor group manually in *Integration settings › Semantic Model Execute Queries REST API*.
{% endstep %}
{% endstepper %}

### Background threshold for the hourly checklist

**What it is:** the **Background threshold for the hourly checklist (%)** field, in the Capacity Metrics Source card.

**What it is for:** define from which background usage percentage a capacity is included in the environment's hourly checklist alert.

<figure><picture><source srcset="/files/U1T5f3gLbx3uPLTyWC3S" media="(prefers-color-scheme: dark)"><img src="https://3938213054-files.gitbook.io/~/files/v0/b/gitbook-x-prod.appspot.com/o/spaces%2FH2bFRBmIfyK3kwVKbldl%2Fuploads%2Fgit-blob-44cda483444ca8ac8464591af771b2875e5160cb%2Fpm-configuracoes-monitoramento-limiar-background-en.png?alt=media" alt="Background threshold for the hourly checklist field with the value as a percentage"></picture><figcaption><p>Background threshold of the hourly checklist</p></figcaption></figure>

**How to use:**

1. Change the value of the **Background threshold for the hourly checklist (%)** field.
2. Click **Save** on the same card. The value applies to the next hourly checklists.

**How it works:** it accepts whole numbers from 1 to 100; the default is 50. Outside this range, the screen shows *Enter a whole number between 1 and 100.* and the **Save** button is unavailable. The threshold is saved together with the metrics source, so the **Workspace** and **Semantic model** must also be filled in to save.

### Save and change the metrics source

**What it is:** the **Save** button of the Capacity Metrics Source card, which stores the workspace, the model and the background threshold.

**What it is for:** activate the source for the first time or change it, for example after reinstalling the Capacity Metrics App in another workspace.

**How to use:**

1. Choose the **Workspace** and the **Semantic model** (and, if you want, adjust the background threshold).
2. Click **Test connection** and check the result.
3. Click **Save**. The button shows **Saving...** and the message *Metrics source configured and validated successfully.* confirms it was saved. The card badge changes to **Configured and validated**.

**How it works:** the configuration is only saved if validation passes. The new source is used in the following collections.

### Capacities card

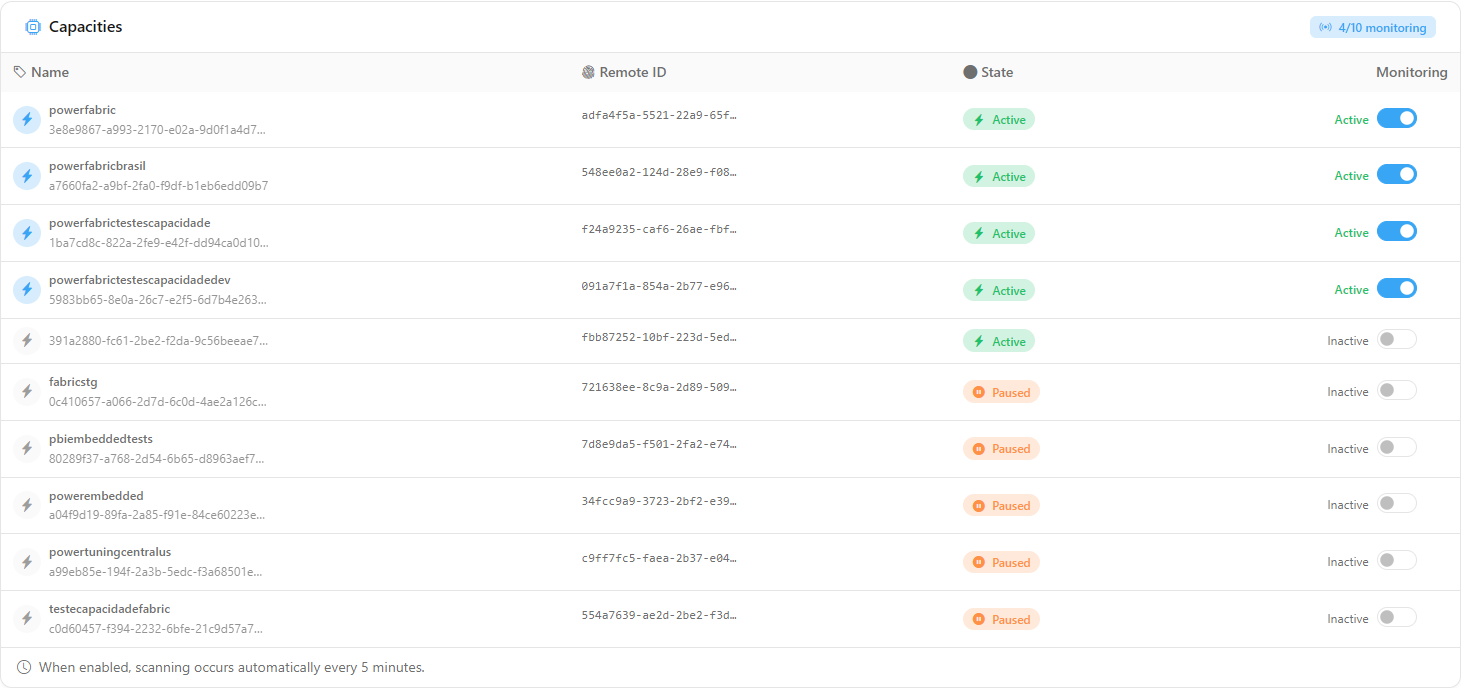
**What it is:** the first card of the tab, with all the capacities in the tenant's catalog (the ones found by the capacity scan, except Premium Per User ones) and, in the corner, the badge with how many are being monitored (for example, *2/5 monitoring*).

**What it is for:** choose which capacities are included in the consumption screens and in the alerts.

<figure><picture><source srcset="/files/EqpeqjHIfCShoj0fBSoE" media="(prefers-color-scheme: dark)"><img src="https://3938213054-files.gitbook.io/~/files/v0/b/gitbook-x-prod.appspot.com/o/spaces%2FH2bFRBmIfyK3kwVKbldl%2Fuploads%2Fgit-blob-1bf1c7c9a534292f1a63366714a1f1dc2000b9b9%2Fpm-configuracoes-monitoramento-capacidades-en.png?alt=media" alt="Capacities card with the per-capacity monitoring switches"></picture><figcaption><p>Capacities card: one switch per capacity</p></figcaption></figure>

<figure><picture><source srcset="/files/98AMJ7myddgQcEqBg8ts" media="(prefers-color-scheme: dark)"><img src="https://3938213054-files.gitbook.io/~/files/v0/b/gitbook-x-prod.appspot.com/o/spaces%2FH2bFRBmIfyK3kwVKbldl%2Fuploads%2Fgit-blob-710c8e736e3b28ac7bb8aa43545185da4275dd53%2Fpm-configuracoes-monitoramento-capacidades-selo-en.png?alt=media" alt="Capacities card header with the monitored capacities badge"></picture><figcaption><p>Monitored capacities badge</p></figcaption></figure>

| Column         | What it shows                                                                  |
| -------------- | ------------------------------------------------------------------------------ |
| **Name**       | Capacity name and the internal identifier.                                     |
| **Remote ID**  | Capacity GUID in Fabric / Power BI.                                            |
| **State**      | **Active**, **Paused**, **Inactive** or **Unknown**, as reported by Microsoft. |
| **Monitoring** | Active/Inactive switch (see the next feature).                                 |

**How to use:**

1. Find the capacity by **Name** or by **Remote ID**. Hover over a truncated name or GUID to see the full value.
2. Check in the header badge how many capacities are monitored.

**How it works:** capacities that are not monitored yet appear in the list with the switch off, ready to be turned on. The card footer reminds you that, when enabled, scanning occurs automatically **every 5 minutes**.

### Per-capacity monitoring switch

**What it is:** the switch in the **Monitoring** column, one per row of the Capacities card, with the text **Active** or **Inactive** next to it.

**What it is for:** turn consumption collection on or off for a specific capacity.

<figure><picture><source srcset="/files/qZ7NFK7GE89wevGxs2yl" media="(prefers-color-scheme: dark)"><img src="https://3938213054-files.gitbook.io/~/files/v0/b/gitbook-x-prod.appspot.com/o/spaces%2FH2bFRBmIfyK3kwVKbldl%2Fuploads%2Fgit-blob-6733200ced06b1932a8b99d30f899982296b0ee0%2Fpm-configuracoes-monitoramento-capacidades-interruptor-en.png?alt=media" alt="Row of a capacity with the monitoring switch"></picture><figcaption><p>Monitoring switch of a capacity</p></figcaption></figure>

**How to use** (prerequisites: **Administrator** profile and Capacity Metrics Source configured and validated):

1. In the **Capacities** card, find the capacity.
2. Click the switch in the **Monitoring** column. While the change is saved, a loading indicator appears next to it.
3. The message *Monitoring enabled successfully.* (or *Monitoring disabled successfully.*) confirms the change, and the badge at the top of the card is updated.

**How it works:** only capacities with the switch on appear on the consumption screens and generate alerts. Turning it off removes the capacity from the screens and alerts, but keeps the history already collected. Without the Capacity Metrics Source configured, Power Monitor refuses the activation and asks for the configuration.

### Initial capacity scan

**What it is:** the **Perform initial scan** button, displayed in the Capacities card when the list is empty (**No capacities found**), together with the guidance that the organization must have a workspace associated with a Fabric capacity.

**What it is for:** make Power Monitor identify the available capacities for the first time.

**How to use:**

1. In the **Capacities** card, with the list empty, click **Perform initial scan**.
2. The button triggers the capacity scan and the card shows **Scanning in progress...**. Wait: the scan is tracked until the end and *Scan completed. The capacity list has been updated.* is displayed.
3. With the list already filled in, to identify new capacities, run a scan in [Capacity Scan](/en/power-monitor/mapeamento/capacidades.md).

**How it works:** the capacities listed come from the catalog built by the capacity scan and enter with monitoring turned off; consumption of each one is only collected after you turn its switch on. If tracking stops before the end, the card warns that the scan may keep running in the background: reload the page later.

### Reactivate the automatic collection cycle

**What it is:** the **Automatic cycle stopped** notice, displayed at the top of the Capacities card when monitoring is enabled but the collection stopped after internal failures, with the **Last error** and the **Reactivate monitoring** button.

**What it is for:** turn the collection back on without having to turn each capacity off and on.

**How to use:**

1. Fix the cause indicated in the **Last error** (usually the Service Principal's access to the Capacity Metrics App; use [Test connection](#test-connection) to confirm).
2. Click **Reactivate monitoring**. The button shows **Reactivating...** while the collection is turned back on.
3. The message *Monitoring reactivated successfully.* confirms the reactivation.

## Rules and behavior

* **Monitoring is per capacity.** Only capacities with the switch on appear on the consumption screens and generate alerts. Turning monitoring off removes the capacity from the screens, but does not delete the history already collected.
* **Turning it on requires a valid metrics source.** Without the Capacity Metrics Source configured, Power Monitor refuses the activation and asks for the configuration.
* **Collection every 5 minutes:** while there is a monitored capacity, Power Monitor collects the state and usage percentage of the capacities and the operations per item (the basis of Consumption History, Consumption Comparison, Consumption Metrics and Consumption Anomalies).
* **Retroactive history:** the Capacity Metrics App keeps only the last few weeks of data. On the [Consumption Metrics](/en/power-monitor/monitoramento/metricas-de-consumo.md) screen, administrators can reload today and the previous 7 days; days outside the app's retention cannot be recovered.
* **Time zone:** the "day" on all consumption screens is the organization's local day, defined by the Capacity Metrics App's *UTC\_offset* parameter.
* **Automatic cycle stopped:** if collection fails repeatedly, the Capacities card shows the **"Automatic cycle stopped"** notice with the last error. Fix the cause (usually access to the app) and click **Reactivate monitoring**.

## Frequently asked questions

<details>

<summary>The app's workspace does not appear in the Metrics Source list.</summary>

The list shows only workspaces that the Service Principal can see **and** that are already in the Power Monitor inventory. Confirm the Service Principal's access (step 2), run an Inventory Scan that includes the workspace (step 3) and click **Refresh list**.

</details>

<details>

<summary>I saved the source, but the capacities do not appear in the Capacities card.</summary>

Click **Perform initial scan** (or wait for the next cycle). The capacities listed are the ones the Capacity Metrics App knows about; if a capacity does not appear, confirm in the app itself, in Power BI, whether it is available to the account that configured the app.

</details>

<details>

<summary>Can I change the source workspace or model later?</summary>

Yes. Select the new workspace/model, test and save. The new source is validated before being saved and is used in the following collections.

</details>

<details>

<summary>I am not an administrator. How do I enable monitoring?</summary>

The configuration is exclusive to administrators. The consumption screens show a message asking you to contact an administrator in your organization.

</details>

## Related pages

* [Capacities (Capacity Monitoring)](/en/power-monitor/monitoramento/capacidades.md)
* [Capacities (menu)](/en/power-monitor/capacidades.md)
* [Settings](/en/power-monitor/configuracoes.md)
* [Inventory Scan](/en/power-monitor/mapeamento/inventarios.md)
* [Capacity Scan](/en/power-monitor/mapeamento/capacidades.md)
* [Consumption Metrics](/en/power-monitor/monitoramento/metricas-de-consumo.md)


---

# Agent Instructions
This documentation is published with GitBook. GitBook is the documentation platform designed so that both humans and AI agents can read, navigate, and reason over technical content effectively. Learn more at gitbook.com.

## Querying This Documentation
If you need additional information that is not directly available in this page, you can query the documentation by asking a question.

Perform an HTTP GET request on the following URL with the `ask` and `goal` query parameters:

```
GET https://docs.powermonitor.com.br/en/power-monitor/monitoramento/capacidades/ativar-monitoramento-de-capacidade.md?ask=<question>&goal=<user_goal>
```

`ask` is the immediate question: it should be specific, self-contained, and written in natural language.
`goal` is what the user is ultimately trying to achieve, the reason they need the answer. Sharing it helps GitBook give you a better, more relevant answer. A goal is most helpful when it describes the outcome the user wants rather than restating the question. For example, with `ask=how do I create an API token`, a goal like `automate deployments from our CI pipeline` lets GitBook tailor the answer to that use case.

The response will contain a direct answer to the question and relevant excerpts and sources from the documentation.

Use this mechanism when the answer is not explicitly present in the current page, you need clarification or additional context, or you want to retrieve related documentation sections.