> For the complete documentation index, see [llms.txt](https://docs.powermonitor.com.br/llms.txt). Markdown versions of documentation pages are available by appending `.md` to page URLs; this page is available as [Markdown](https://docs.powermonitor.com.br/en/power-monitor/monitoramento/comparativo-por-entidade.md).

# Entity Comparison

Compare the Capacity Units consumption of two workspaces, two capacities, or two items over the same period, with KPIs, efficiency, curve, breakdown, top consumers, and an automatic reading.

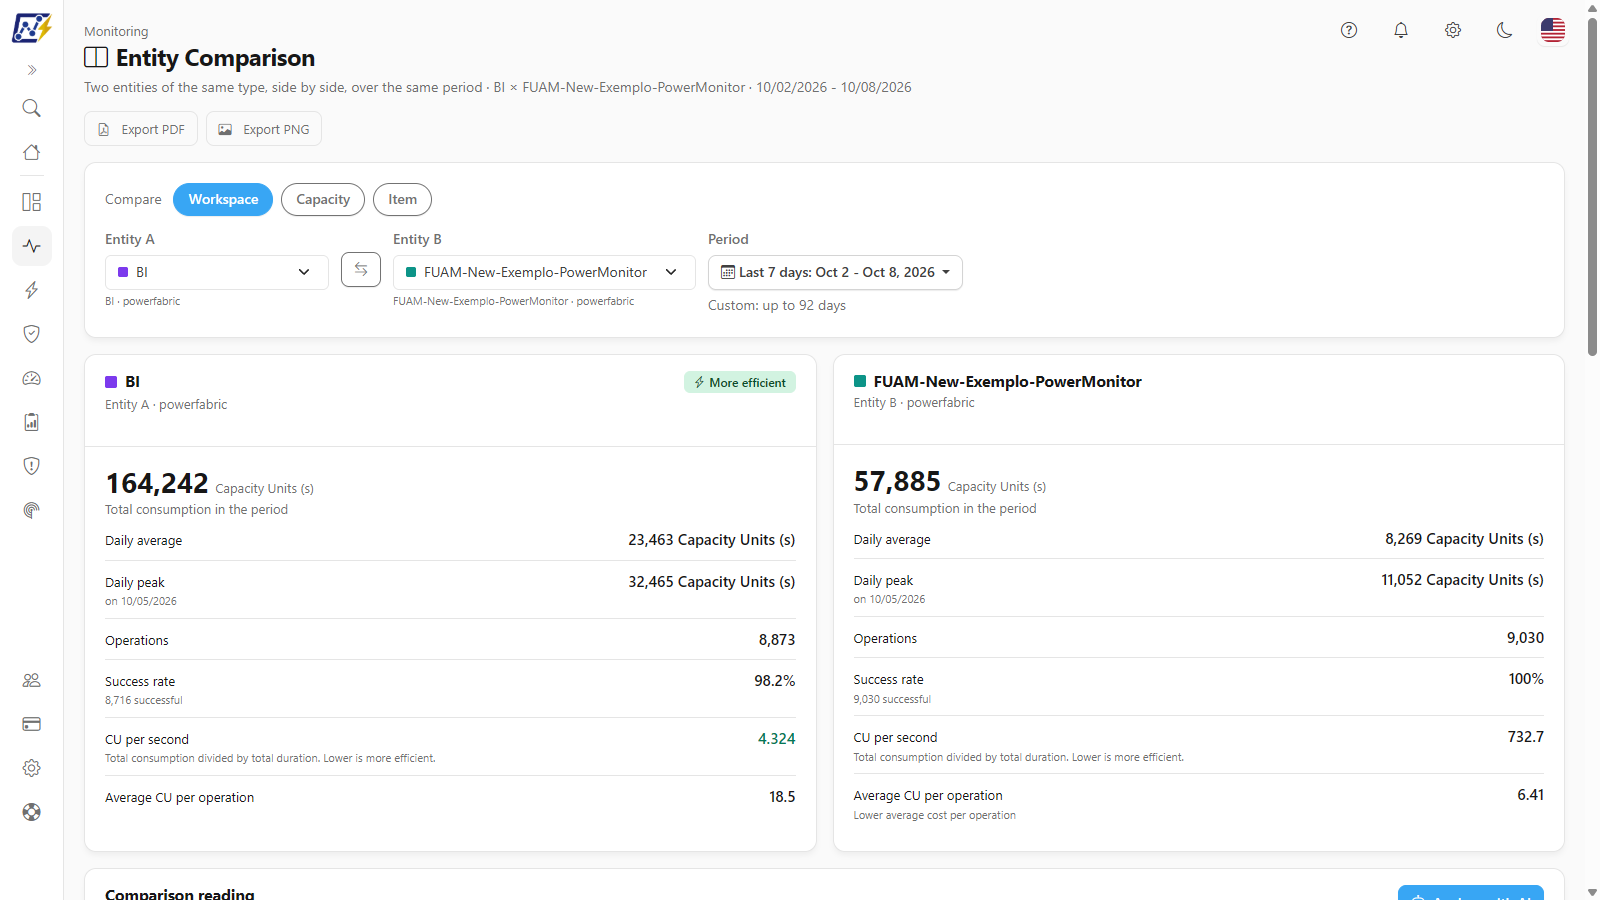
**Entity Comparison** puts the Capacity Units (CU) consumption of **two entities of the same type** side by side over the same period: two **workspaces**, two **capacities**, or two **items**. For each side, the screen shows total consumption, daily average, peak, operations, success rate, and efficiency, and adds the consumption curve, the Background/Interactive breakdown, the top consumers, and an automatic reading of the differences.

It complements [Consumption Comparison](/en/power-monitor/monitoramento/comparativo-de-consumo.md), which compares **two days** of the environment; here the comparison is between **two entities** over the same range.

**How to access:**

* *Monitoring › Entity Comparison*; or
* *Capacities › Entity Comparison* (same screen; see [Capacities (menu)](/en/power-monitor/capacidades.md)).

The screen is available to **all profiles** (in the **Audit** profile it is blocked by default and can be enabled in [Users](/en/power-monitor/usuarios.md)). The numbers consider only capacities with monitoring enabled and, for users with a restricted workspace scope, only the workspaces the user can view.

<figure><picture><source srcset="/files/FWoyHbZbUgLBfyFb2y4p" media="(prefers-color-scheme: dark)"><img src="https://3938213054-files.gitbook.io/~/files/v0/b/gitbook-x-prod.appspot.com/o/spaces%2FH2bFRBmIfyK3kwVKbldl%2Fuploads%2Fgit-blob-8e9f3642a2397d726f6fec5ca3aafd14d9ad81a4%2Fpm-monitoramento-comparativo-entidade-en.png?alt=media" alt="Entity Comparison screen with two workspaces compared side by side"></picture><figcaption><p>Entity Comparison: entity A × entity B</p></figcaption></figure>

## What it is for

* **Which workspace weighs more on the capacity?** Compare two workspaces and see how much more one consumes than the other and which items explain the difference.
* **Compare capacities:** see whether one capacity is much more loaded than another, or more concentrated on Background, before moving workspaces or changing the SKU.
* **Compare parts of a workspace:** compare only some items of a workspace (for example, the sales models) with another group of items, from the same workspace or from another one.
* **Validate a rewrite:** compare the old item with the new one (for example, a semantic model and its optimized version) and check which spends less CU per second and per operation.
* **Explain the difference to the FinOps team** with the **Comparison reading** and the AI analysis.

## Features

### Choosing the type and the entities

**What it is:** the filter bar, with the **Compare** buttons (**Workspace**, **Capacity**, or **Item**), the **Entity A** and **Entity B** selectors, the swap A and B button, and the **Period** filter.

**What it is for:** building the pair to compare and the date range.

<figure><picture><source srcset="/files/xUOf9dAGXXWhoth2xRZH" media="(prefers-color-scheme: dark)"><img src="https://3938213054-files.gitbook.io/~/files/v0/b/gitbook-x-prod.appspot.com/o/spaces%2FH2bFRBmIfyK3kwVKbldl%2Fuploads%2Fgit-blob-030a0e62e80950b8c6ff81d3e77b1fa52916d7d0%2Fpm-monitoramento-comparativo-entidade-filtros-en.png?alt=media" alt="Filter bar with Compare, Entity A, Entity B, and Period"></picture><figcaption><p>Entity Comparison filter bar</p></figcaption></figure>

**How to use:**

{% stepper %}
{% step %}

### Choose the type

In **Compare**, click **Workspace**, **Capacity**, or **Item**. Changing the type clears both chosen entities.
{% endstep %}

{% step %}

### Choose the two entities

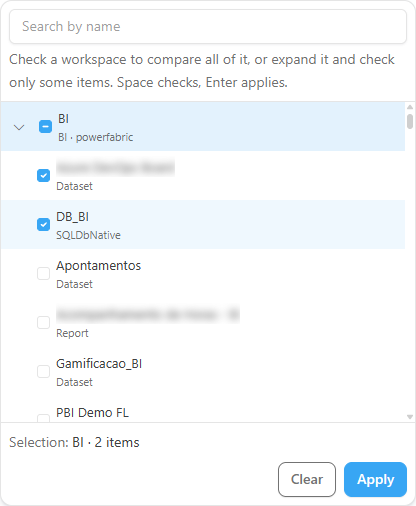
Open **Entity A**, search by name, and click the option you want. Repeat in **Entity B**. Below each selector, the entity's context is shown (for example, the workspace and capacity of an item). With the **Workspace** type, you can also compare only some items of the workspace: see [Compare a subset of workspace items](#compare-a-subset-of-workspace-items).
{% endstep %}

{% step %}

### Adjust the period

In **Period**, choose one of the shortcuts or a custom range. The screen reloads on its own after each change.
{% endstep %}
{% endstepper %}

<figure><picture><source srcset="/files/xq4K254RJiSXrdhNVZok" media="(prefers-color-scheme: dark)"><img src="https://3938213054-files.gitbook.io/~/files/v0/b/gitbook-x-prod.appspot.com/o/spaces%2FH2bFRBmIfyK3kwVKbldl%2Fuploads%2Fgit-blob-22bf1841eef6c7c5e64a1e61ccb53559005d211a%2Fpm-monitoramento-comparativo-entidade-seletor-en.png?alt=media" alt="Workspace entity selector open, with the workspace tree, one workspace expanded with checked items and the Apply and Clear buttons"></picture><figcaption><p>Entity selector with the tree of workspaces and items</p></figcaption></figure>

**How it works:**

* Options are ordered by consumption over the last 92 days (the highest consumers first). When the list may be incomplete, *The list may be incomplete. Refine the search to find other options.* is shown.
* The entity already chosen on one side appears disabled on the other, with **Already chosen as entity A** (or **B**).
* With the **Item** type, the two items can be of different types, workspaces, and capacities.
* With the **Capacity** type, only capacities with monitoring enabled and present in the [metrics source](/en/power-monitor/configuracoes/monitoramento.md#capacity-metrics-source) are listed.
* The swap button inverts A and B without reloading the options.

### Compare a subset of workspace items

**What it is:** with the **Workspace** type, each entity's selector shows a tree (**Workspaces and their items**): each workspace has a checkbox and can be expanded to show its items with consumption. Each side can be the **whole workspace** or **several items chosen from it**.

**What it is for:** comparing only the part of the workspace that matters, for example the semantic models of one project against those of another, without the rest of the workspace distorting the numbers.

**How to use:**

1. In **Compare**, keep **Workspace** selected and open **Entity A**.
2. To compare the whole workspace, check the workspace's box. To compare only some items, click the arrow next to the name to expand the workspace and check the items you want; the workspace's box becomes partially checked.
3. Check the **Selection:** in the selector footer (for example, *3 of 12 items*) and click **Apply**. **Clear** undoes the selection and **Esc** closes without applying.
4. Repeat in **Entity B**.

**How it works:**

* Each side uses **a single workspace**. If you check items from another workspace, the previous selection is replaced, with the notice *Each side uses a single workspace: the selection from "…" was replaced by "…".*
* Up to **200 items per side**. When the limit is reached, *Limit of 200 items per side reached.* is shown.
* A workspace's item list shows those with the highest consumption; when it is cut off, *Showing the N items with the highest consumption in this workspace.* is shown, with the tip to check the workspace itself to compare all of it.
* The same workspace can be on both sides, as long as the items differ. With the same workspace and the same items, *A and B have the same workspace with the same items. Change the items on one side or choose another workspace.* is shown.
* KPIs, curve, breakdown, top consumers, **Comparison reading** and the AI analysis consider only the chosen items, and the selector shows the label *N of M items*.
* The tree also works with the keyboard: **Space** checks and **Enter** applies.

### Period

**What it is:** the **Period** filter, with shortcuts and the custom option.

**What it is for:** comparing a specific day, a week, or a month.

**How to use:** choose a shortcut or **Custom** and enter the dates. The default when the screen opens is the **last 7 days**.

**Rules:**

* The custom range is at most **92 days** (*Custom: up to 92 days*).
* Dates are local days of the organization. A period that includes **today** is partial: the numbers go up to the last collected hour, and the **Comparison reading** points this out.
* With a single day (today or yesterday, for example), the curve shows the **cumulative consumption hour by hour** for that day.

### KPIs of each entity

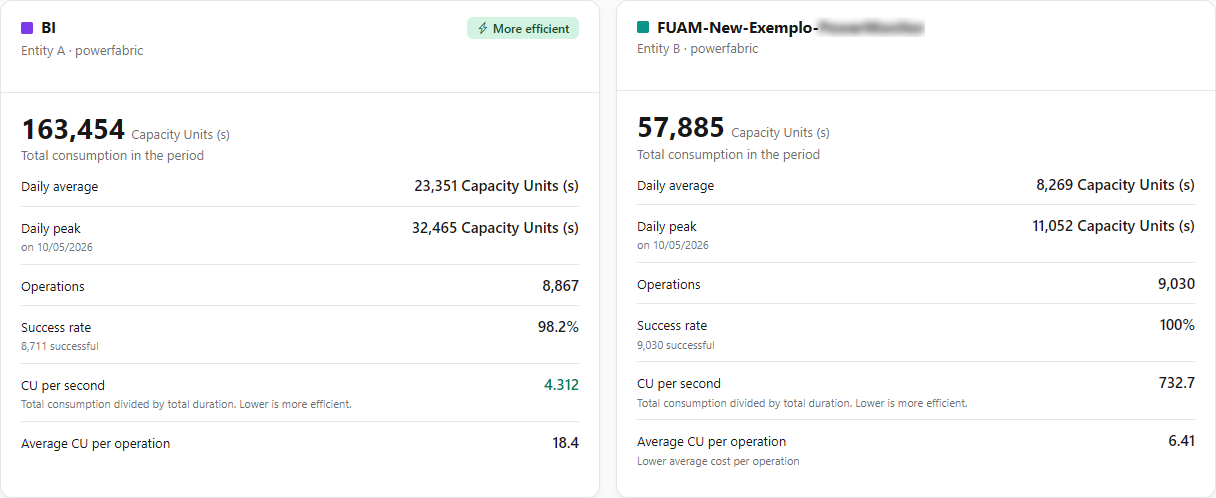
**What it is:** one card per entity, in its color, showing **Total consumption in the period**, **Daily average**, **Daily peak** (with the day), **Operations**, **Success rate**, **CU per second**, and **Average CU per operation**.

**What it is for:** comparing volume and efficiency at a glance.

<figure><picture><source srcset="/files/RCSVNfYmsgePbHpzX2o9" media="(prefers-color-scheme: dark)"><img src="https://3938213054-files.gitbook.io/~/files/v0/b/gitbook-x-prod.appspot.com/o/spaces%2FH2bFRBmIfyK3kwVKbldl%2Fuploads%2Fgit-blob-e3897879f4c18970dd4af737b6cdb0b22577fba4%2Fpm-monitoramento-comparativo-entidade-kpis-en.png?alt=media" alt="KPI cards of entities A and B with the More efficient badge"></picture><figcaption><p>KPIs of the two entities</p></figcaption></figure>

| Indicator                           | How it is calculated                                                                            |
| ----------------------------------- | ----------------------------------------------------------------------------------------------- |
| **Total consumption in the period** | Sum of the entity's Capacity Units (s) in the period.                                           |
| **Daily average**                   | Total consumption divided by the number of days in the period.                                  |
| **Daily peak**                      | Day with the highest consumption (on a tie, the earliest).                                      |
| **Operations**                      | Number of recorded operations.                                                                  |
| **Success rate**                    | Successful operations divided by operations with a known status.                                |
| **CU per second**                   | Total consumption divided by the total duration of the operations. **Lower is more efficient.** |
| **Average CU per operation**        | Total consumption divided by the number of operations.                                          |

**How it works:** the **More efficient** badge goes to the entity with the lowest **CU per second**. On a tie, or when one side has no data, no entity gets the badge. When an indicator cannot be calculated (for example, no operations), it is shown empty, never as zero.

### Comparison reading

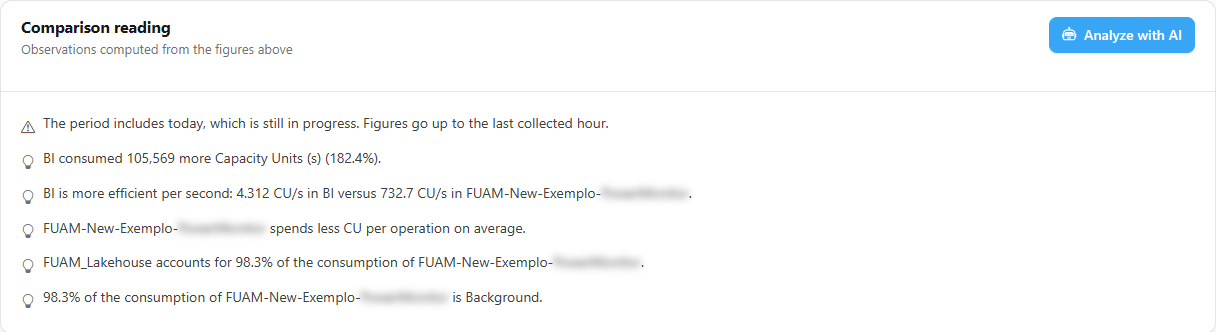
**What it is:** the **Comparison reading** card, with observations calculated from the numbers, and the **Analyze with AI** button.

**What it is for:** understanding the differences without doing the math.

<figure><picture><source srcset="/files/tHdhozQEkivznF73rZIW" media="(prefers-color-scheme: dark)"><img src="https://3938213054-files.gitbook.io/~/files/v0/b/gitbook-x-prod.appspot.com/o/spaces%2FH2bFRBmIfyK3kwVKbldl%2Fuploads%2Fgit-blob-81fff8f26ef732f72ac5f9b4695760d1f048dbe8%2Fpm-monitoramento-comparativo-entidade-leitura-en.png?alt=media" alt="Comparison reading card with the observations and the Analyze with AI button"></picture><figcaption><p>Comparison reading</p></figcaption></figure>

| Observation                            | When it appears                                                                           |
| -------------------------------------- | ----------------------------------------------------------------------------------------- |
| The period includes today              | The period ends today, which is still in progress.                                        |
| Entity with no consumption             | One side recorded no consumption or operations.                                           |
| Who consumed more                      | Both sides have consumption and the totals differ (shows the difference in CU and %).     |
| More efficient per second              | Both sides have CU per second and the values differ.                                      |
| Lower cost per operation               | Both sides have average CU per operation and the values differ.                           |
| Dominant consumer                      | A single item or operation accounts for **50% or more** of an entity's consumption.       |
| Consumption concentrated on Background | Background is **80% or more** (or **20% or less**) of an entity's classified consumption. |

**Analyze with AI:** generates an analysis of the displayed comparison using the provider configured in [Settings › AI](/en/power-monitor/configuracoes/ia.md). It is disabled when neither entity has consumption in the period. The AI receives the numbers and the names of the entities and of up to 5 top consumers per side; no e-mail or identifier is sent.

### Consumption per day

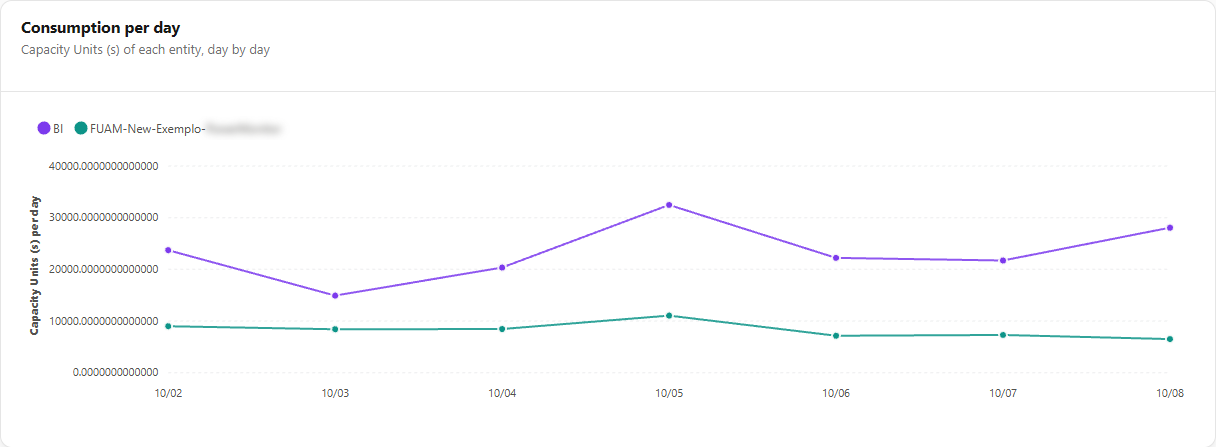
**What it is:** the **Consumption per day** line chart, with one line per entity. For a single-day period, it becomes **Cumulative consumption for the day**, with the running total hour by hour.

**What it is for:** seeing on which days one entity moved away from the other, or at what time of day consumption accelerated.

<figure><picture><source srcset="/files/9YDmoXPgflwmnX5N5MOY" media="(prefers-color-scheme: dark)"><img src="https://3938213054-files.gitbook.io/~/files/v0/b/gitbook-x-prod.appspot.com/o/spaces%2FH2bFRBmIfyK3kwVKbldl%2Fuploads%2Fgit-blob-dd66eb58c2a414653c501b446ead5352418107d0%2Fpm-monitoramento-comparativo-entidade-curva-en.png?alt=media" alt="Consumption per day chart with the lines of entities A and B"></picture><figcaption><p>Consumption per day of the two entities</p></figcaption></figure>

**How it works:** days with no record show **No data** in the tooltip. When the day is today, the curve goes up to the last collected hour.

### Consumption breakdown and top consumers

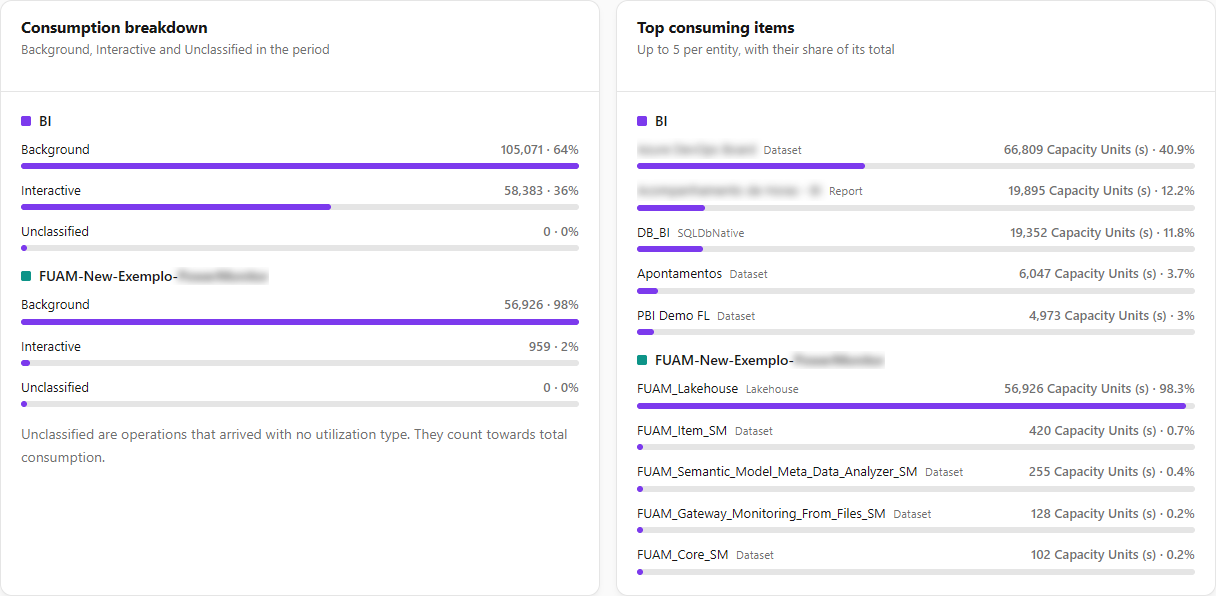
**What it is:** the **Consumption breakdown** card (Background, Interactive, and Unclassified for each entity) and the **Top consuming items** card (or **Top consuming operations**, for the Item type), with up to 5 per entity and each one's share of its total.

**What it is for:** finding out whether the difference comes from automated routines or interactive use, and which item or operation drives the consumption on each side.

<figure><picture><source srcset="/files/tTNwo17cdw0PCdQlQbHy" media="(prefers-color-scheme: dark)"><img src="https://3938213054-files.gitbook.io/~/files/v0/b/gitbook-x-prod.appspot.com/o/spaces%2FH2bFRBmIfyK3kwVKbldl%2Fuploads%2Fgit-blob-ab40ae16f56438b7022c49f0999916198f177639%2Fpm-monitoramento-comparativo-entidade-composicao-en.png?alt=media" alt="Consumption breakdown and Top consuming items cards"></picture><figcaption><p>Consumption breakdown and top consumers</p></figcaption></figure>

**How it works:** **Unclassified** are operations that arrived with no utilization type; they count towards total consumption.

### Export

**What it is:** the **Export PDF** and **Export PNG** buttons in the header, which save the screen to a file (`comparativo-consumo-entidade`).

**How to use:** after the comparison loads, click **Export PDF** or **Export PNG**. The file labels use the entities and the period actually loaded.

## Rules and behavior

* A and B must be different entities. If they are the same, the bar shows *A and B are the same entity. Choose two different entities to compare.* and nothing is queried.
* Before both entities are chosen, the screen shows **Choose two entities**. If neither consumed in the period, **No consumption in the period** is shown.
* Entities from another organization, capacities without monitoring enabled, and workspaces outside your scope are not listed and cannot be queried.
* Names, the subtitle (*A × B · period*), and the export always reflect the last loaded result, never a selection not yet applied.

## Frequently asked questions

<details>

<summary>Why doesn't a capacity appear in the list?</summary>

Only capacities with monitoring turned on **and** present in the Capacity Metrics App model configured in the [metrics source](/en/power-monitor/configuracoes/monitoramento.md#capacity-metrics-source) are listed. Premium Per User (PPU) capacities have no consumption in the app and therefore do not appear.

</details>

<details>

<summary>Can I compare a report with a semantic model?</summary>

Yes. With the **Item** type, the two sides can be of different types and in different workspaces and capacities. For items, the top consumers card lists the **operations** that consume the most.

</details>

<details>

<summary>Which entity is the "more efficient" one?</summary>

The one with the lowest **CU per second** (total consumption divided by the total duration of the operations). **Average CU per operation** is shown alongside as a second reference.

</details>

## Related pages

* [Consumption Comparison](/en/power-monitor/monitoramento/comparativo-de-consumo.md)
* [Consumption History](/en/power-monitor/monitoramento/historico-de-consumo.md)
* [Capacities](/en/power-monitor/monitoramento/capacidades.md)
* [Monitoring (Settings)](/en/power-monitor/configuracoes/monitoramento.md)


---

# Agent Instructions
This documentation is published with GitBook. GitBook is the documentation platform designed so that both humans and AI agents can read, navigate, and reason over technical content effectively. Learn more at gitbook.com.

## Querying This Documentation
If you need additional information that is not directly available in this page, you can query the documentation by asking a question.

Perform an HTTP GET request on the following URL with the `ask` and `goal` query parameters:

```
GET https://docs.powermonitor.com.br/en/power-monitor/monitoramento/comparativo-por-entidade.md?ask=<question>&goal=<user_goal>
```

`ask` is the immediate question: it should be specific, self-contained, and written in natural language.
`goal` is what the user is ultimately trying to achieve, the reason they need the answer. Sharing it helps GitBook give you a better, more relevant answer. A goal is most helpful when it describes the outcome the user wants rather than restating the question. For example, with `ask=how do I create an API token`, a goal like `automate deployments from our CI pipeline` lets GitBook tailor the answer to that use case.

The response will contain a direct answer to the question and relevant excerpts and sources from the documentation.

Use this mechanism when the answer is not explicitly present in the current page, you need clarification or additional context, or you want to retrieve related documentation sections.