> For the complete documentation index, see [llms.txt](https://docs.powermonitor.com.br/llms.txt). Markdown versions of documentation pages are available by appending `.md` to page URLs; this page is available as [Markdown](https://docs.powermonitor.com.br/en/power-monitor/monitoramento/credenciais-de-fontes-de-dados.md).
# Data source credentials
See whether the credentials of your gateway data sources are still valid, before semantic model refreshes start failing.
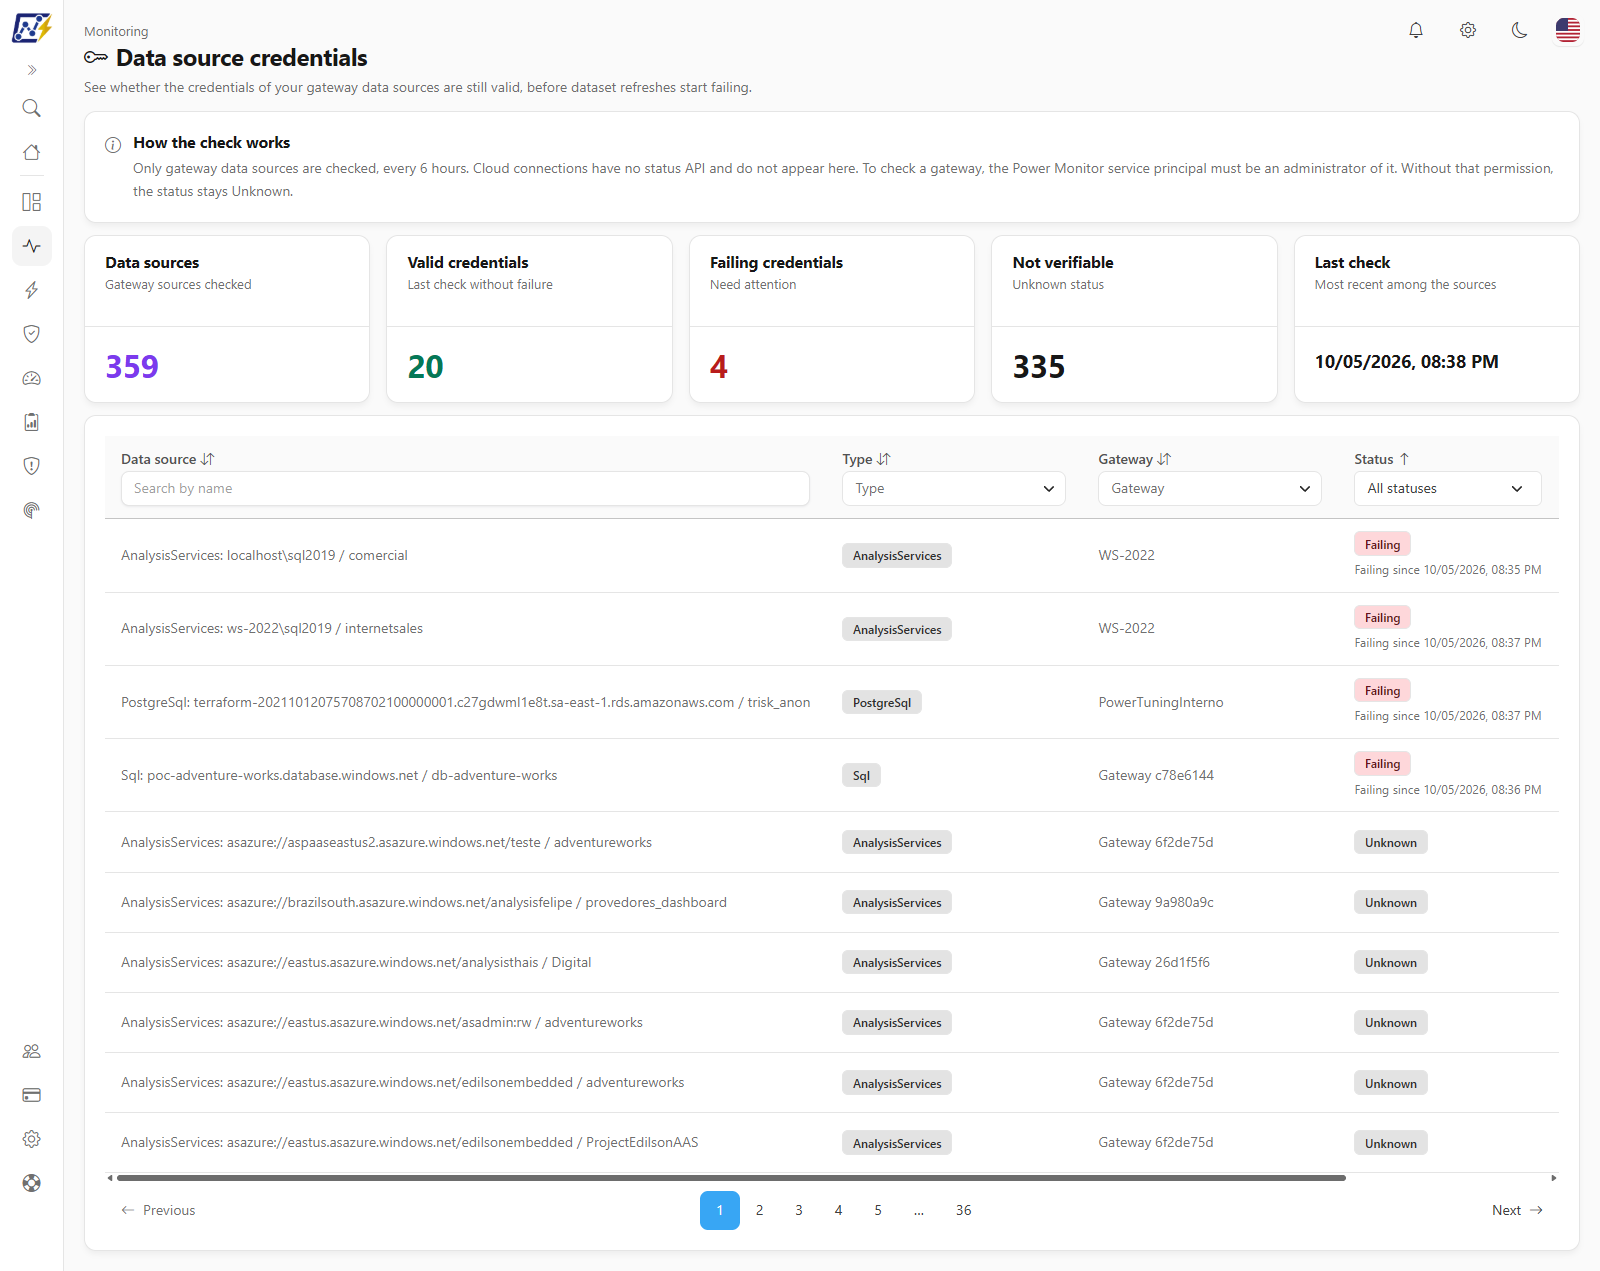
The **Data source credentials** screen shows the status of the credentials of the data sources that go through your **gateways**. Power Monitor queries Power BI periodically and warns you when a credential stops working (changed password, locked account, expired token), **before** the next semantic model refresh fails because of it.
**How to access:** *Monitoring › Data source credentials*.
**Who can access:** all user profiles see the screen. The **Check now** action is exclusive to **Administrators**. The list covers the whole organization (gateway sources do not belong to a workspace), and an administrator can block the page for specific users.
Data source credentials screen
## What it is for
* **Fix before it breaks**: an invalid credential brings down the refresh of every model that uses that source. Here you find the problem before the next schedule.
* **Know since when it fails**: each source with a problem shows since when it has been failing.
* **Prioritize**: the list opens with the failing sources at the top.
## Screen components
### "How the check works" notice
It explains the main rules: only **gateway** data sources are checked, **every 6 hours**; cloud connections have no status API and do not appear; and, to check a gateway, the Power Monitor **service principal** must be an administrator of it. Without that permission, the status stays **Unknown**.
### Summary cards
| Card | What it shows |
| ----------------------- | ---------------------------------------------------------------------- |
| **Data sources** | Total gateway sources checked. |
| **Valid credentials** | Sources whose last check had no failure. |
| **Failing credentials** | Sources that need attention (red when greater than zero). |
| **Not verifiable** | Sources with an unknown status. |
| **Last check** | Date and time of the most recent check among all sources (or *Never*). |
The cards consider all sources, without applying the table filters.
### Data sources table
| Column | What it shows |
| --------------- | ------------------------------------------------------------------------------------------------------------------------------------------ |
| **Data source** | Name of the source. |
| **Type** | Type of the source (for example, SQL Server). |
| **Gateway** | Name of the gateway the source belongs to. |
| **Status** | **Valid**, **Failing**, or **Unknown**, with a supporting line: *Failing since ...* on failing sources, or *Last OK on ...* on valid ones. |
| **Last check** | Date and time of the last query to Power BI. |
Filters in the headers: **Data source** (*Search by name*), **Type** and **Gateway** (multiple selection), and **Status** (*All statuses*). By default the list is sorted by status (failing first, then unknown, then valid) and then by name; you can reorder it by clicking the headers. The table is paginated, with an items-per-page selector.
**Meaning of the statuses**
| Status | Meaning |
| ----------- | ------------------------------------------------------------------------------------------------------------------------------------------------------------------ |
| **Valid** | The credential was successfully validated on the last check. |
| **Failing** | The credential failed the check. Hover over the badge to read the summary of the error returned by Power BI (if Power BI returned no details, the screen says so). |
| **Unknown** | The source could not be verified, for example because the service principal is not an administrator of the gateway. **It does not indicate a failure.** |
### Actions menu
Click **More actions** (⋮) on the row, or right-click it:
* **Check now**: queries Power BI immediately and updates the status of the source. Exclusive to administrators: for other profiles the item appears disabled, with the tooltip *Only administrators can check now.*
* **Open alerts**: takes you to the [Alerts](/en/power-monitor/monitoramento/alertas.md) screen already filtered by the **Connection** type, where the credential incidents are.
* **Copy name**: copies the name of the data source.
Actions menu of a data source
## Step by step
### How to handle a failing credential
{% stepper %}
{% step %}
#### Find the source
In the table, filter **Status** by **Failing** (or use the sources at the top of the list) and hover over the badge to read the summary of the error.
{% endstep %}
{% step %}
#### Fix the credential
In Power BI, update the credential of the data source in the gateway (for example, the new password of the service account).
{% endstep %}
{% step %}
#### Confirm
Go back to the screen and, as an administrator, use **Check now** on the row. The message *Check completed.* confirms the query and the status changes to **Valid** if the fix worked.
{% endstep %}
{% endstepper %}
## Rules and behavior
* **Scope:** only data sources attached to **gateways** (the sources come from the organization's inventory, collected in [Mapping › Inventory › Inventory](/en/power-monitor/mapeamento/inventarios.md)). Cloud connections have no status API and are not checked.
* **Frequency:** the automatic check runs **every 6 hours**. Each run checks up to 200 sources; those never checked and those checked the longest ago come first, so all of them are covered over the runs. If Power BI limits the requests, the run is interrupted and the remaining sources are left for the next one.
* **Prerequisites:** **Gateway monitoring** must be enabled in *Settings › Monitoring* (see [Enable Gateway Monitoring](/en/power-monitor/monitoramento/gateways/ativar-monitoramento-de-gateways.md)) and the service principal must be an administrator of the gateway. The credential check is on by default and can be turned off in *Settings › Monitoring* (**Data source credential check**).
* **Incidents and notifications:** when a source starts failing, an incident of the **Connection** type is opened in [Alerts](/en/power-monitor/monitoramento/alertas.md) and a credential failure notification is sent. While the incident stays open, there are no new emails. When the credential works again, the incident is resolved and a recovery notification is sent. If an incident is resolved manually and the source keeps failing, a new one is opened on the next check.
* **Check now:** it is a one-off check of one source. It is not a data collection, so there is no collection button on this screen.
## Frequently asked questions
Why does my source appear as "Unknown"?
Because Power Monitor could not verify it. The most common reason is that the service principal is not an administrator of the gateway. Add it as an administrator of the gateway in Power BI and use **Check now**. "Unknown" does not mean the credential has a problem.
My cloud source does not appear in the list.
Only gateway data sources are checked. Cloud connections have no status API.
Why is the "Check now" item disabled?
The action is exclusive to administrators. Ask an administrator to check the source, or wait for the next automatic check (every 6 hours).
I saw the error "Power BI refused the request for now".
Power BI limited the requests at that moment. Wait a few moments and try again.
## Related pages
* [Monitoring overview](/en/power-monitor/monitoramento.md)
* [Gateways](/en/power-monitor/monitoramento/gateways.md)
* [Semantic Models](/en/power-monitor/monitoramento/modelos-semanticos.md)
* [Alerts](/en/power-monitor/monitoramento/alertas.md)
* [Settings › Monitoring](/en/power-monitor/configuracoes/monitoramento.md)
---
# Agent Instructions
This documentation is published with GitBook. GitBook is the documentation platform designed so that both humans and AI agents can read, navigate, and reason over technical content effectively. Learn more at gitbook.com.
## Querying This Documentation
If you need additional information that is not directly available in this page, you can query the documentation by asking a question.
Perform an HTTP GET request on the following URL with the `ask` and `goal` query parameters:
```
GET https://docs.powermonitor.com.br/en/power-monitor/monitoramento/credenciais-de-fontes-de-dados.md?ask=&goal=
```
`ask` is the immediate question: it should be specific, self-contained, and written in natural language.
`goal` is what the user is ultimately trying to achieve, the reason they need the answer. Sharing it helps GitBook give you a better, more relevant answer. A goal is most helpful when it describes the outcome the user wants rather than restating the question. For example, with `ask=how do I create an API token`, a goal like `automate deployments from our CI pipeline` lets GitBook tailor the answer to that use case.
The response will contain a direct answer to the question and relevant excerpts and sources from the documentation.
Use this mechanism when the answer is not explicitly present in the current page, you need clarification or additional context, or you want to retrieve related documentation sections.