> For the complete documentation index, see [llms.txt](https://docs.powermonitor.com.br/llms.txt). Markdown versions of documentation pages are available by appending `.md` to page URLs; this page is available as [Markdown](https://docs.powermonitor.com.br/en/power-monitor/monitoramento/fabric-mirroring.md).

# Fabric Mirroring

Track the sync of your Microsoft Fabric mirrored databases (Mirroring) and get alerts when replication stops, fails, or falls behind.

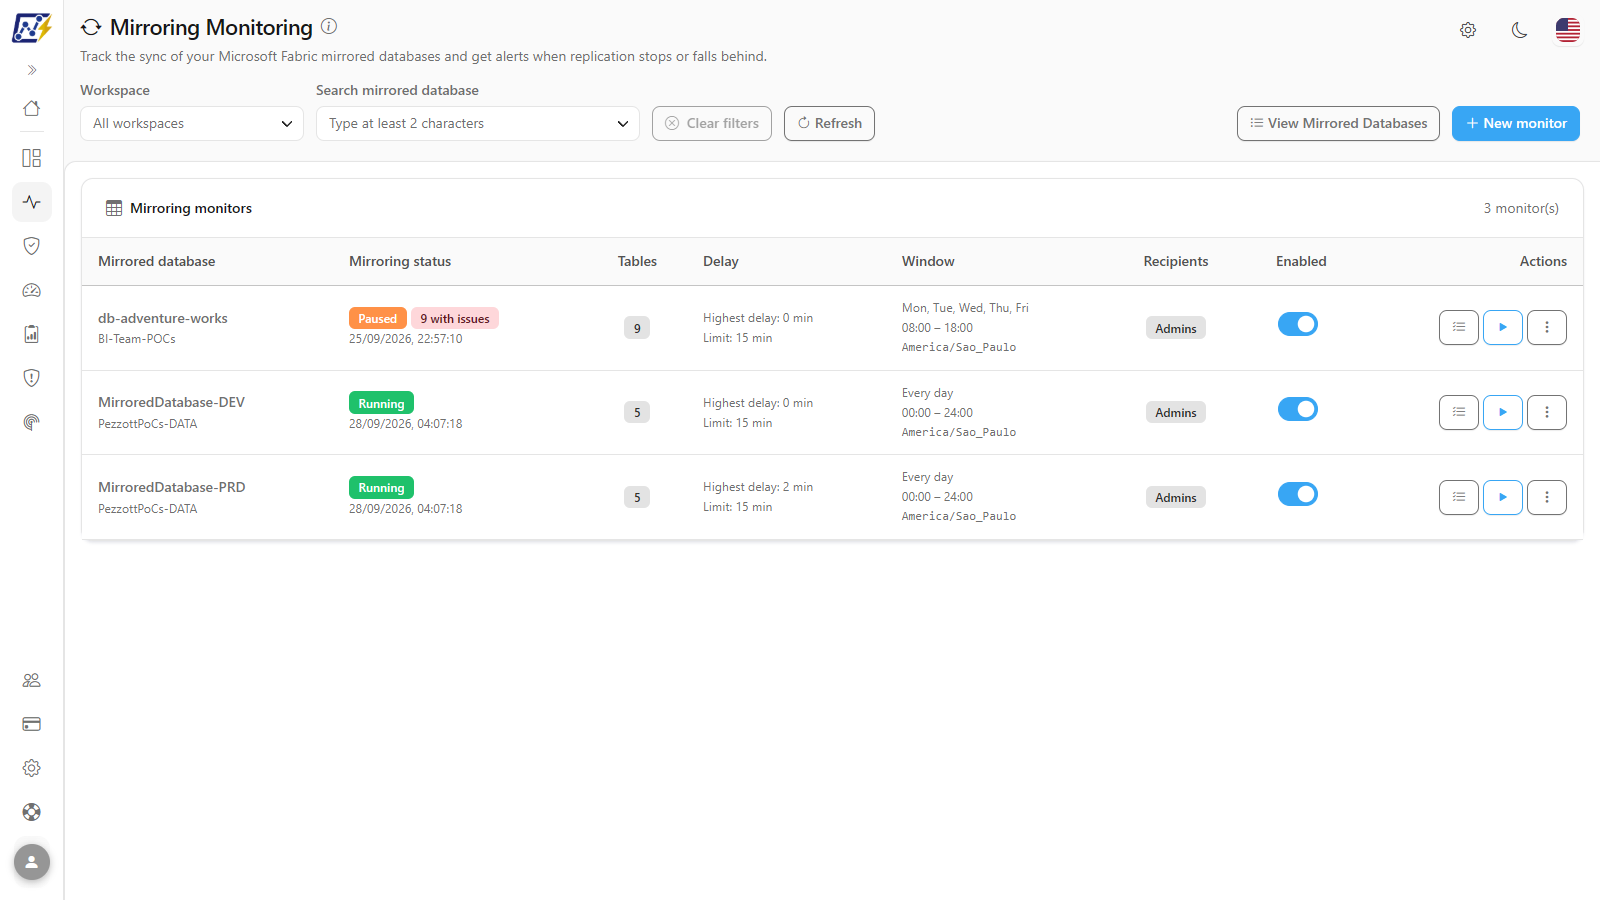
The **Fabric Mirroring** screen (page title: *Mirroring Monitoring*) tracks whether Microsoft Fabric **mirrored databases** are actually replicating data from the source. For each monitored database, Power Monitor periodically queries the mirroring status and the status of each mirrored table, calculates the replication delay, and sends an email when replication is paused or stopped, when a table fails, or when the delay exceeds the configured limit.

**How to access:** menu *Monitoring › Fabric Mirroring*.

**Who can access:** all profiles can see the screen and the sync status. **Creating, editing, enabling/disabling, deleting, "Check now", and "Send alert" are actions restricted to Administrators.** Like other screens, this page can be blocked for specific users in user management.

<figure><picture><source srcset="/files/gSV7weBCSPZ7uOWhVIrr" media="(prefers-color-scheme: dark)"><img src="https://3938213054-files.gitbook.io/~/files/v0/b/gitbook-x-prod.appspot.com/o/spaces%2FH2bFRBmIfyK3kwVKbldl%2Fuploads%2Fgit-blob-488e0d92e9424379d9fe71ebb140b2fb96edcc3e%2Fpm-monitoramento-fabric-mirroring-en.png?alt=media" alt="Mirroring Monitoring screen with the list of monitored mirrored databases"></picture><figcaption><p>Fabric Mirroring screen with the mirroring monitors</p></figcaption></figure>

## What it is for

Fabric Mirroring continuously replicates databases such as Azure SQL Database, Azure Cosmos DB, Snowflake, and others into OneLake. When replication stops or falls behind, reports, notebooks, and models that read the mirrored database start showing stale data, and Fabric itself does not notify anyone.

The screen answers the question: **"are my mirrored databases syncing right now, and with how much delay?"**

Common use cases:

* Being notified when a database's replication is **paused or stopped** (manually or due to a failure).
* Detecting **tables whose replication failed**, for example after a schema change at the source.
* Ensuring a **maximum replication delay** (e.g., 30 minutes) for databases used in operational reports.
* Quickly finding, among hundreds of mirrored tables, **which ones have issues**.

{% hint style="info" %}
The inventory of mirrored databases (what exists, in which workspace, with which properties) is in *Governance › Data and Engineering › Fabric Mirroring*. This screen handles **sync**: how replication is working. The **View Mirrored Databases** button takes you straight to the inventory.
{% endhint %}

## Features

### Filters, search, and header buttons

**What it is:** the bar at the top of the page, with the **Workspace** and **Search mirrored database** filters and the **Clear filters**, **Refresh**, **View Mirrored Databases**, and **New monitor** buttons. The information icon (ⓘ) next to the title summarizes how the check works.

**What it is for:** finding the monitor for a database or a group of workspaces and quickly getting to the inventory of mirrored databases.

<figure><picture><source srcset="/files/6r4qKpFu69Ys8QG6AoqM" media="(prefers-color-scheme: dark)"><img src="https://3938213054-files.gitbook.io/~/files/v0/b/gitbook-x-prod.appspot.com/o/spaces%2FH2bFRBmIfyK3kwVKbldl%2Fuploads%2Fgit-blob-fd3df957e7c87436104e0087ffdd305ca17d4334%2Fpm-monitoramento-fabric-mirroring-filtros-en.png?alt=media" alt="Screen header with the Workspace and Search mirrored database filters and the Clear filters, Refresh, View Mirrored Databases, and New monitor buttons"></picture><figcaption><p>Header filters and buttons</p></figcaption></figure>

| Element                      | Description                                                                                          |
| ---------------------------- | ---------------------------------------------------------------------------------------------------- |
| **Workspace**                | Multi-select filter with workspace search. With no selection, it shows **All workspaces**.           |
| **Search mirrored database** | Multi-select filter by database name. Type at least 2 characters to see suggestions.                 |
| **Clear filters**            | Removes the applied filters and shows how many are active; with no filters, it is disabled.          |
| **Refresh**                  | Reloads the list.                                                                                    |
| **View Mirrored Databases**  | Opens the inventory of mirrored databases in *Governance › Data and Engineering › Fabric Mirroring*. |
| **New monitor**              | Opens the creation form. Visible only to Administrators.                                             |

**How to use:**

1. In the **Workspace** filter, open the list, search if needed, and select one or more workspaces.
2. In the **Search mirrored database** filter, type at least 2 characters and select one or more suggested databases.
3. To remove the filters, click **Clear filters**. To reload the list, click **Refresh**.

**How it works:** the list reloads automatically when you select or clear an option and returns to the first page. When nothing matches the filters, the screen displays **No monitor found** with the hint **Adjust or clear the filters to see the other monitors.**

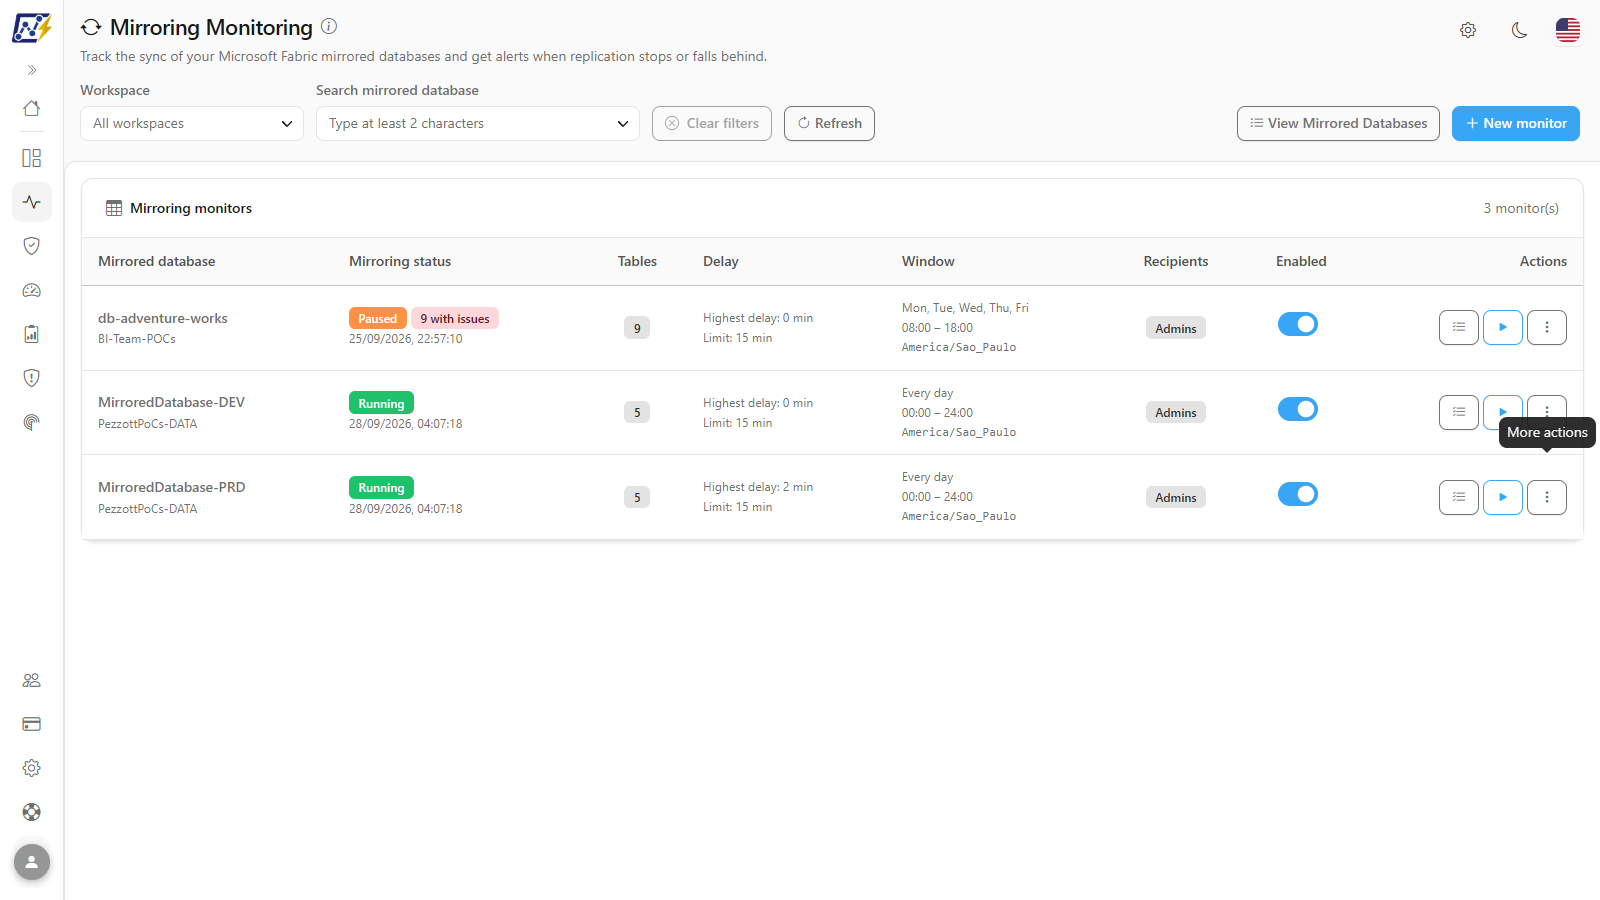
### "Mirroring monitors" list

**What it is:** the main table on the screen. Each row represents a monitored mirrored database, and each database can have **only one monitor**. The card header shows the total number of monitors.

**What it is for:** seeing at a glance which databases have stopped replicating, which have late or failed tables, and what the current highest delay is.

<figure><picture><source srcset="/files/6gfGk6lIHeGnEpFpFXnA" media="(prefers-color-scheme: dark)"><img src="https://3938213054-files.gitbook.io/~/files/v0/b/gitbook-x-prod.appspot.com/o/spaces%2FH2bFRBmIfyK3kwVKbldl%2Fuploads%2Fgit-blob-12255b468554fa707bb0f96e6f8c0b0c16f1104e%2Fpm-monitoramento-fabric-mirroring-lista-en.png?alt=media" alt="Mirroring monitors card with status, tables, delay, window, recipients, and the Enabled toggle"></picture><figcaption><p>List of mirroring monitors</p></figcaption></figure>

| Column                | What it shows                                                                                                                                                                                                                                     |
| --------------------- | ------------------------------------------------------------------------------------------------------------------------------------------------------------------------------------------------------------------------------------------------- |
| **Mirrored database** | Name of the mirrored database and, below it, the workspace.                                                                                                                                                                                       |
| **Mirroring status**  | Replication status of the database (e.g., **Running**, **Paused**, **Stopped**) and badges with the counts of tables that are **late**, **with issues** (failed or stopped), and **seeding**. Before the first check, it shows **Never checked**. |
| **Tables**            | Number of mirrored tables found in the last check.                                                                                                                                                                                                |
| **Delay**             | **Highest delay** observed among the tables and the configured default **Limit**.                                                                                                                                                                 |
| **Window**            | Days of the week (or "Every day"), time range (e.g., `00:00 – 24:00`), and time zone.                                                                                                                                                             |
| **Recipients**        | Summary of who receives the alerts: **Admins**, **Workspace contacts**, and the number of additional emails (hover to see the emails; they appear masked when **Hide data** is on).                                                               |
| **Enabled**           | On/off toggle (see [Enable or disable a monitor](#enable-or-disable-a-monitor)).                                                                                                                                                                  |
| **Actions**           | **View sync status** (all profiles), **Check now**, and **More actions** (⋮), the last two for Administrators.                                                                                                                                    |

**How to use:** start with the rows with **Paused**/**Stopped** status or with **with issues** and **late** badges, and click **View sync status** to see the per-table detail. The list shows 20 monitors per page; use the pagination in the card footer, which also lets you choose how many items to show per page (**Items per page**).

**How it works:** **View sync status** is disabled while the monitor has not yet been checked.

### "More actions" menu (⋮)

**What it is:** the menu on each row with **Edit**, **Check now**, **View sync status**, and **Delete**.

**What it is for:** grouping the maintenance actions for a monitor.

<figure><picture><source srcset="/files/SAqCg6QIhzTE49nqQqcy" media="(prefers-color-scheme: dark)"><img src="https://3938213054-files.gitbook.io/~/files/v0/b/gitbook-x-prod.appspot.com/o/spaces%2FH2bFRBmIfyK3kwVKbldl%2Fuploads%2Fgit-blob-47cff43b29bf00050036f3085fc3054006a3b60f%2Fpm-monitoramento-fabric-mirroring-menu-acoes-en.png?alt=media" alt="More actions menu open over a mirroring monitor row"></picture><figcaption><p>Actions menu of a mirroring monitor</p></figcaption></figure>

**How to use:** click **More actions** (⋮) in the **Actions** column, or right-click the row, and choose the action.

**How it works:** the menu exists only for Administrators. **View sync status** is disabled while there is no check.

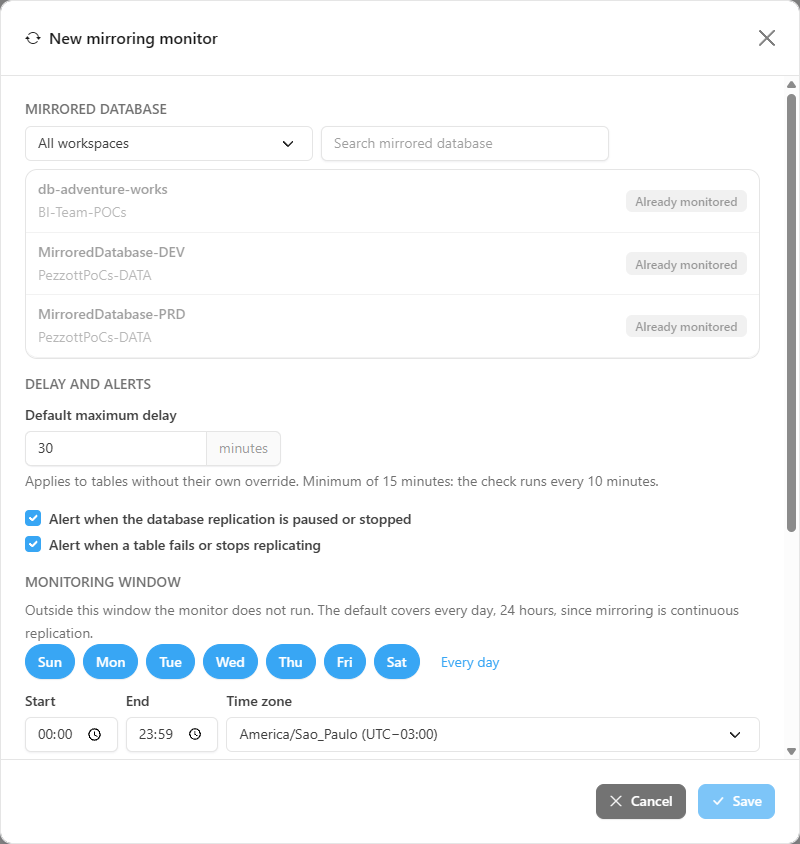
### Create a mirroring monitor

**What it is:** the **New mirroring monitor** modal. Unlike the [Data Freshness](/en/power-monitor/monitoramento/atualizacao-de-dados.md) screen, the form has **a single step**: tables are not selected, because Power Monitor automatically discovers all mirrored tables on every check.

**What it is for:** putting a mirrored database under watch, with the acceptable delay, the check window, and the alert recipients.

Prerequisites: **Administrator** profile; the mirrored database must be in the inventory, in a monitored workspace, and the Power Monitor service principal must have read permission on the item (see [Prerequisites and permissions](#prerequisites-and-permissions)).

<figure><picture><source srcset="/files/Py0HFyzz7CF1qRT6Qgic" media="(prefers-color-scheme: dark)"><img src="https://3938213054-files.gitbook.io/~/files/v0/b/gitbook-x-prod.appspot.com/o/spaces%2FH2bFRBmIfyK3kwVKbldl%2Fuploads%2Fgit-blob-136cb80c566e9caa6a11b9cbbbc6133f1234fb8a%2Fpm-monitoramento-fabric-mirroring-modal-monitor-en.png?alt=media" alt="New mirroring monitor modal with mirrored database, delay, window, and recipients"></picture><figcaption><p>Mirroring monitor creation modal</p></figcaption></figure>

**How to use:**

{% stepper %}
{% step %}

### Open the form

In *Monitoring › Fabric Mirroring*, click **New monitor**. The **New mirroring monitor** modal opens.
{% endstep %}

{% step %}

### Choose the mirrored database

In the **Mirrored database** section, filter by workspace or type in the **Search mirrored database** field and click the desired database. Databases with the **Already monitored** badge cannot be selected.
{% endstep %}

{% step %}

### Set delay and alerts

In the **Delay and alerts** section, enter the **Default maximum delay** in minutes (from 15 to 1,440). Keep **Alert when the database replication is paused or stopped** and **Alert when a table fails or stops replicating** selected, unless you do not want alerts for these situations.
{% endstep %}

{% step %}

### Adjust the window

In the **Monitoring window** section, keep the default (every day, 24 hours) or select the **Days of the week** (the **Every day** shortcut selects all of them) and enter **Start**, **End**, and **Time zone**.
{% endstep %}

{% step %}

### Choose the recipients

In the **Recipients** section, select **Notify system administrators** and/or **Notify workspace contacts** (when available), add **Additional e-mails** if needed (up to 50), and set the **Minimum interval between alerts** (1 to 24 hours).
{% endstep %}

{% step %}

### Save

Click **Save**. While there are validation errors, the list of errors appears in the modal footer and the button is disabled. The **Monitor created.** message confirms the creation.
{% endstep %}

{% step %}

### Check immediately

On the new monitor's row, click **Check now** to see the first sync status without waiting for the next cycle.
{% endstep %}
{% endstepper %}

**How it works / rules:**

| Section               | Fields and defaults                                                                                                                                                                                                               |
| --------------------- | --------------------------------------------------------------------------------------------------------------------------------------------------------------------------------------------------------------------------------- |
| **Mirrored database** | Filter by workspace, search by name, and list of available databases. Databases that already have a monitor appear as **Already monitored**.                                                                                      |
| **Delay and alerts**  | **Default maximum delay** from **15** to **1,440** minutes (default: 30), valid for all tables without their own override. Both alert options come selected.                                                                      |
| **Monitoring window** | Default: every day, 24 hours, since mirroring is continuous replication. Outside the window, the monitor does not run.                                                                                                            |
| **Recipients**        | **Notify system administrators** comes selected. **Notify workspace contacts** only appears when the workspace has owners registered in the governance metadata. **Minimum interval between alerts**: 1 to 24 hours (default: 4). |

You must select at least one notification option or enter at least one email. The 15-minute minimum exists because the check runs every 10 minutes: a lower limit would promise a detection that the cycle cannot deliver.

{% hint style="info" %}
To cover the whole day, enter **Start 00:00** and **End 23:59**: Power Monitor considers the window up to the end of the day (24:00).
{% endhint %}

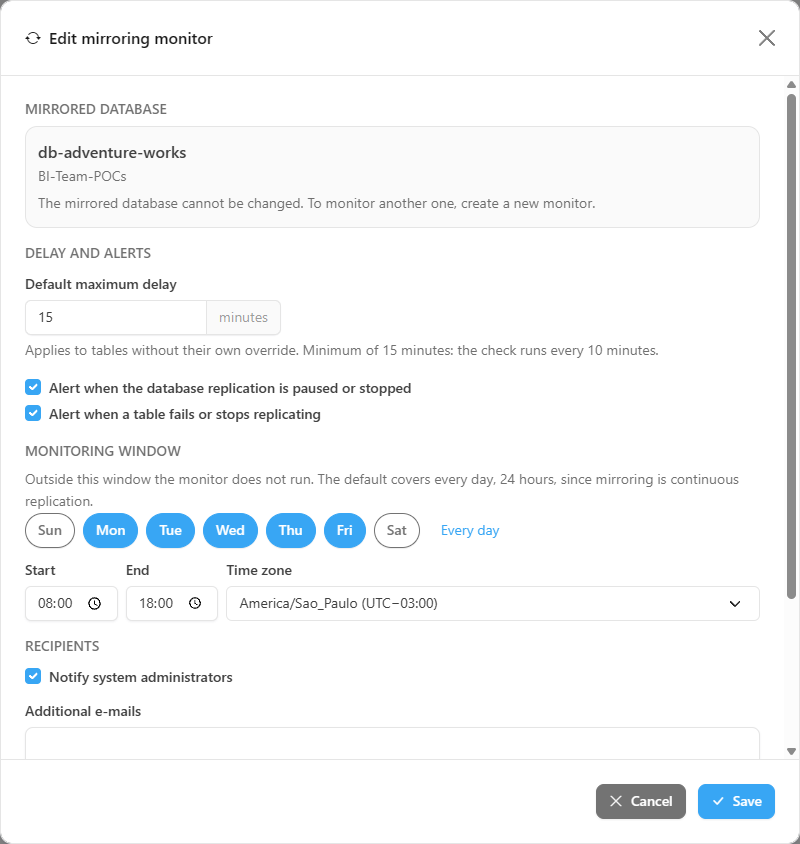
### Edit a monitor

**What it is:** the **Edit mirroring monitor** modal, with the same fields as creation plus the **Monitor enabled** toggle.

**What it is for:** adjusting the acceptable delay, the alert options, the window, or the recipients of a database that is already monitored.

Prerequisite: **Administrator** profile.

<figure><picture><source srcset="/files/zJRNh3EhlkQcLdSbncYN" media="(prefers-color-scheme: dark)"><img src="https://3938213054-files.gitbook.io/~/files/v0/b/gitbook-x-prod.appspot.com/o/spaces%2FH2bFRBmIfyK3kwVKbldl%2Fuploads%2Fgit-blob-766279cbc83254fc6e43750437bf55cfac210854%2Fpm-monitoramento-fabric-mirroring-editar-en.png?alt=media" alt="Edit mirroring monitor modal with the fixed database and the Monitor enabled toggle"></picture><figcaption><p>Editing a mirroring monitor</p></figcaption></figure>

**How to use:**

1. On the monitor's row, click **More actions** (⋮), or right-click the row, and choose **Edit**.
2. Change the delay, the alerts, the window, the recipients, or the **Monitor enabled** toggle.
3. Click **Save**. The **Monitor updated.** message confirms the change.

**How it works:** the mirrored database cannot be changed when editing (**The mirrored database cannot be changed. To monitor another one, create a new monitor.**).

### Enable or disable a monitor

**What it is:** the toggle in the **Enabled** column of each row.

**What it is for:** suspending the checks and alerts for a database (for example, during planned maintenance of the source) without losing the configuration.

Prerequisite: **Administrator** profile (for other profiles, the toggle appears disabled).

**How to use:**

1. In the **Enabled** column, click the row's toggle.
2. The **Monitor enabled.** or **Monitor disabled.** message confirms the change.

**How it works:** a disabled monitor is not checked automatically and does not send emails.

### Check now

**What it is:** the **Check now** button in the **Actions** column (also in the **More actions** menu and in the footer of the sync modal).

**What it is for:** seeing the first sync status of a newly created monitor, or confirming that a fix (permission granted, replication resumed) worked.

Prerequisite: **Administrator** profile.

**How to use:**

1. In the **Actions** column, click **Check now**. The check goes to the collection service queue and *Check queued. The result will appear here shortly.* is displayed.
2. The screen tracks the check until the end, without reloading. When it finishes, the list row is updated and a notice at the top says *Check completed: {mirrored database}.*, with the **View results** button, which opens the sync modal. If the check fails, the notice shows the reason.
3. If the result takes longer than expected, the row shows the **Still pending** badge. Reload the screen in a few minutes.

**How it works:** the manual check is queued right away, queries Fabric and **does not send the incident email**. If it shows that the problem has been resolved, the closure and the resolved email happen normally. To notify immediately, use [Send alert](#send-alert).

### View sync status

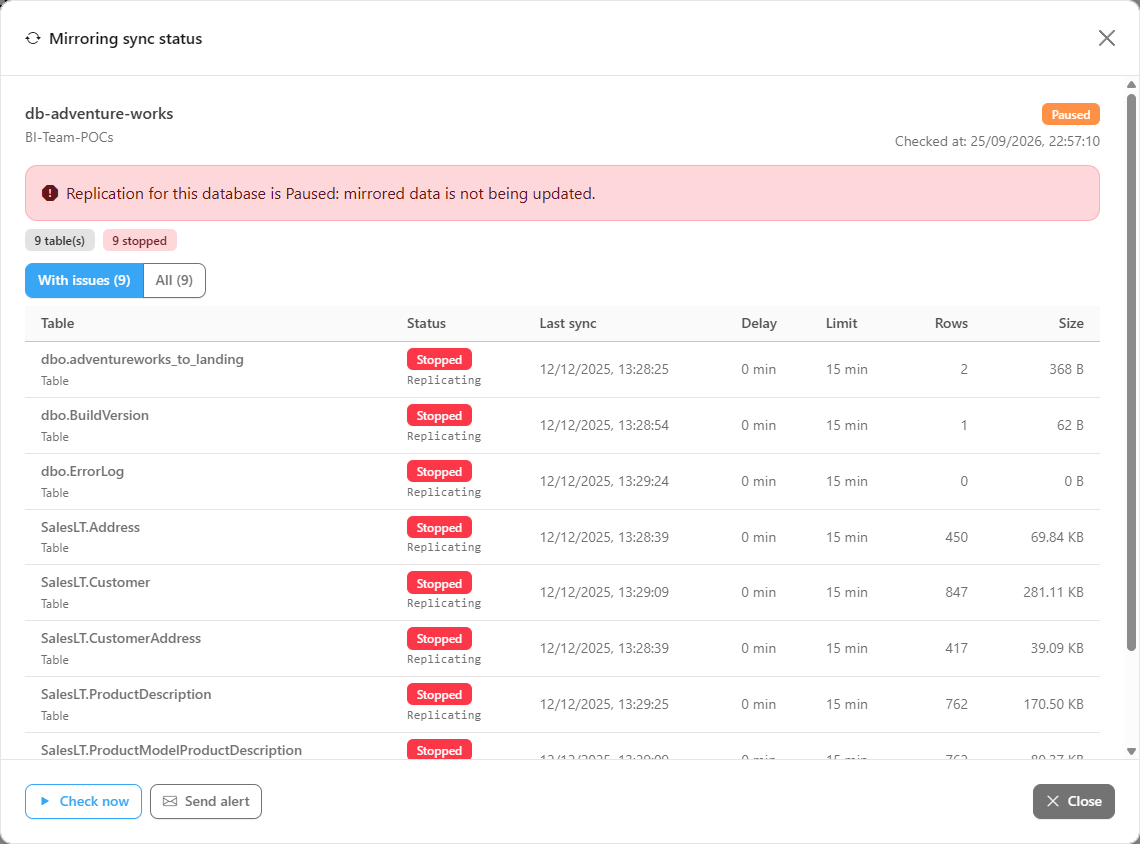
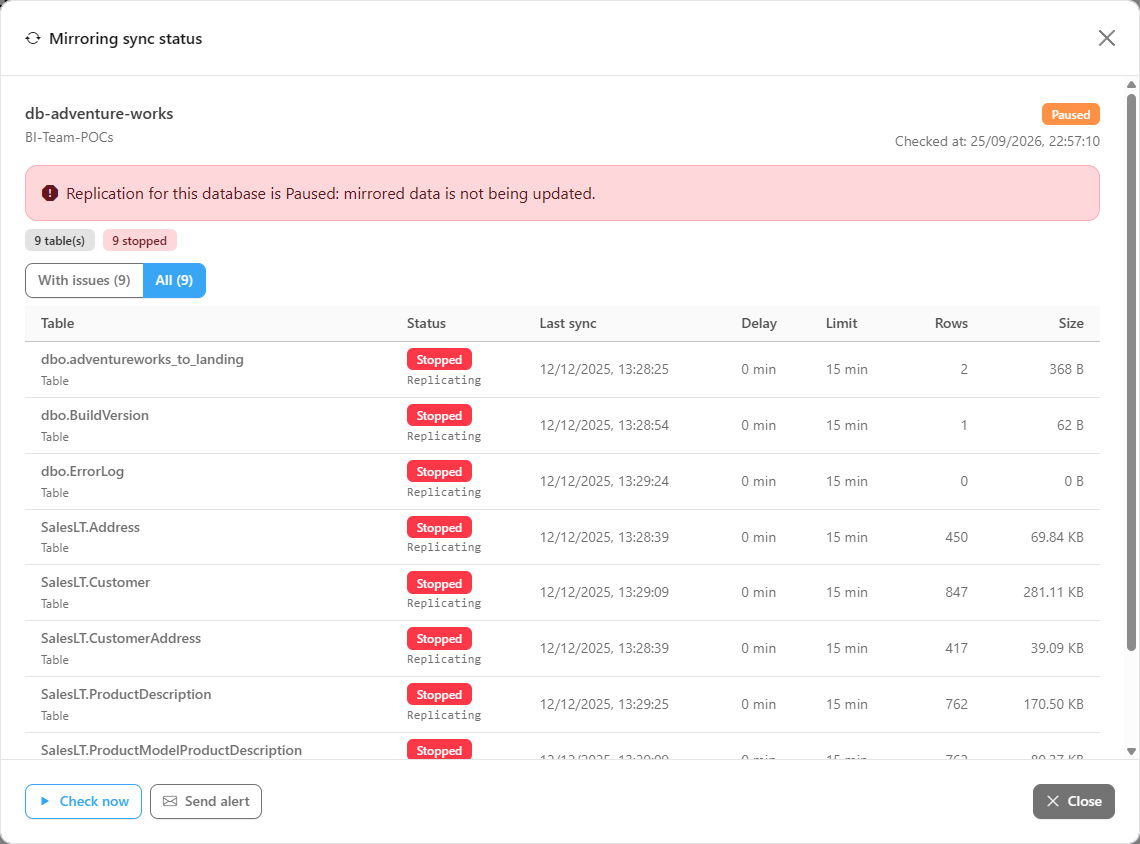
**What it is:** the **Mirroring sync status** modal, opened by **View sync status** or by the **View results** button of the notice shown when a **Check now** finishes. It shows the result of the last check of the database and of each table.

**What it is for:** understanding whether the problem affects the whole database (replication stopped) or specific tables, and what the delay of each one is.

<figure><picture><source srcset="/files/P0bMoslHoQXwZTMGMaHR" media="(prefers-color-scheme: dark)"><img src="https://3938213054-files.gitbook.io/~/files/v0/b/gitbook-x-prod.appspot.com/o/spaces%2FH2bFRBmIfyK3kwVKbldl%2Fuploads%2Fgit-blob-649d572cc4d5458fcab9c2a8a2b1dee1a8700e9f%2Fpm-monitoramento-fabric-mirroring-resultados-en.png?alt=media" alt="Mirroring sync status modal filtered on With issues"></picture><figcaption><p>Sync modal filtered on tables with issues</p></figcaption></figure>

At the top of the modal:

* Database status and **Checked at**.
* A red alert when the database replication is **Paused**, **Stopping**, or **Stopped** ("mirrored data is not being updated").
* A yellow alert when it was not possible to query Fabric, with the problem message and the **Technical error detail** (expandable).
* The count badges: total tables, **late**, **failed**, **stopped**, **seeding**, or **Fully in sync**.

| Column        | What it shows                                                                                                                                   |
| ------------- | ----------------------------------------------------------------------------------------------------------------------------------------------- |
| **Table**     | Schema and name of the table at the source, the object type, and the **Out of mirroring** badge when the table is no longer reported by Fabric. |
| **Status**    | Table status (see [Table status](#table-status)), the original status reported by Fabric and, when present, the table's error message.          |
| **Last sync** | Date and time of the table's last processing.                                                                                                   |
| **Delay**     | Replication delay. Hover to see how it was measured (see [How the delay is calculated](#how-the-delay-is-calculated)).                          |
| **Limit**     | Maximum delay applied to the table. The **Override** badge indicates that the table uses its own limit, different from the monitor default.     |
| **Rows**      | Number of processed rows reported by Fabric.                                                                                                    |
| **Size**      | Volume of data processed.                                                                                                                       |

**How to use:**

1. In the **Actions** column, click **View sync status** (available to all profiles).
2. Read the database status and **Checked at**. If there is a yellow alert, click **Technical error detail** to see the full message.
3. Analyze each table: **Status**, **Last sync**, **Delay**, and **Limit**. Hover over the **Delay** value to find out whether it is the actual replication latency or the time since the last processing.

### List scope: "With issues" and "All"

**What it is:** the two buttons above the sync modal table: **With issues (N)** and **All (N)**.

**What it is for:** preventing the incident from getting lost among hundreds of tables, while still letting you see the full picture when needed.

<figure><picture><source srcset="/files/STbpeBTshTdZR9DvJmbr" media="(prefers-color-scheme: dark)"><img src="https://3938213054-files.gitbook.io/~/files/v0/b/gitbook-x-prod.appspot.com/o/spaces%2FH2bFRBmIfyK3kwVKbldl%2Fuploads%2Fgit-blob-2c952b5dcb684f9f83f5b1253ec2f7332b719a8e%2Fpm-monitoramento-fabric-mirroring-resultados-todas-en.png?alt=media" alt="Mirroring sync status modal with the All scope selected"></picture><figcaption><p>Sync modal with all tables</p></figcaption></figure>

**How to use:**

1. Open the **Mirroring sync status** modal. It opens on **With issues (N)**.
2. Click **All (N)** to see all mirrored tables.
3. Click **With issues (N)** to focus on the incident again.

**How it works:** **With issues** groups the tables that are late, failed, stopped, or with an error. When there are none, the list shows **No table with issues.** **Out of mirroring** tables are dimmed at the end of the list.

### Send alert

**What it is:** the **Send alert** button in the footer of the sync modal.

**What it is for:** notifying the recipients immediately about a replication problem, without waiting for the automatic cycle or the interval between alerts.

Prerequisite: **Administrator** profile (for other profiles, the footer buttons do not appear).

**How to use:**

1. Open the **Mirroring sync status** modal (**View sync status**, or **View results** after a **Check now**).
2. In the footer, click **Send alert**.
3. The **Alert sent.** message confirms the sending.

**How it works:** the button is only enabled when there is something to alert about (database stopped, tables with issues, or query error); otherwise, the hint **There is nothing to alert about right now.** is displayed. Sending **ignores the minimum interval between alerts**.

### Delete a monitor

**What it is:** the **Delete** action in the **More actions** menu.

**What it is for:** no longer watching a discontinued mirrored database.

Prerequisite: **Administrator** profile.

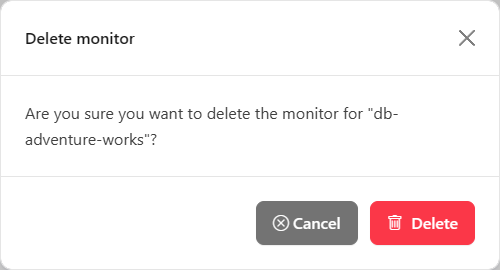
<figure><picture><source srcset="/files/Rg1TF1rBeZjk6ww1JplQ" media="(prefers-color-scheme: dark)"><img src="https://3938213054-files.gitbook.io/~/files/v0/b/gitbook-x-prod.appspot.com/o/spaces%2FH2bFRBmIfyK3kwVKbldl%2Fuploads%2Fgit-blob-ddc8a3d5bbec7720aa5f0738c1a29d66d84e31ce%2Fpm-monitoramento-fabric-mirroring-excluir-en.png?alt=media" alt="Delete mirroring monitor confirmation modal"></picture><figcaption><p>Deletion confirmation</p></figcaption></figure>

**How to use:**

1. On the monitor's row, click **More actions** (⋮) and choose **Delete**.
2. In the **Delete monitor** modal, confirm by clicking **Delete** (or **Cancel**).
3. The **Monitor deleted.** message confirms the deletion.

### "Sync" tab in the inventory

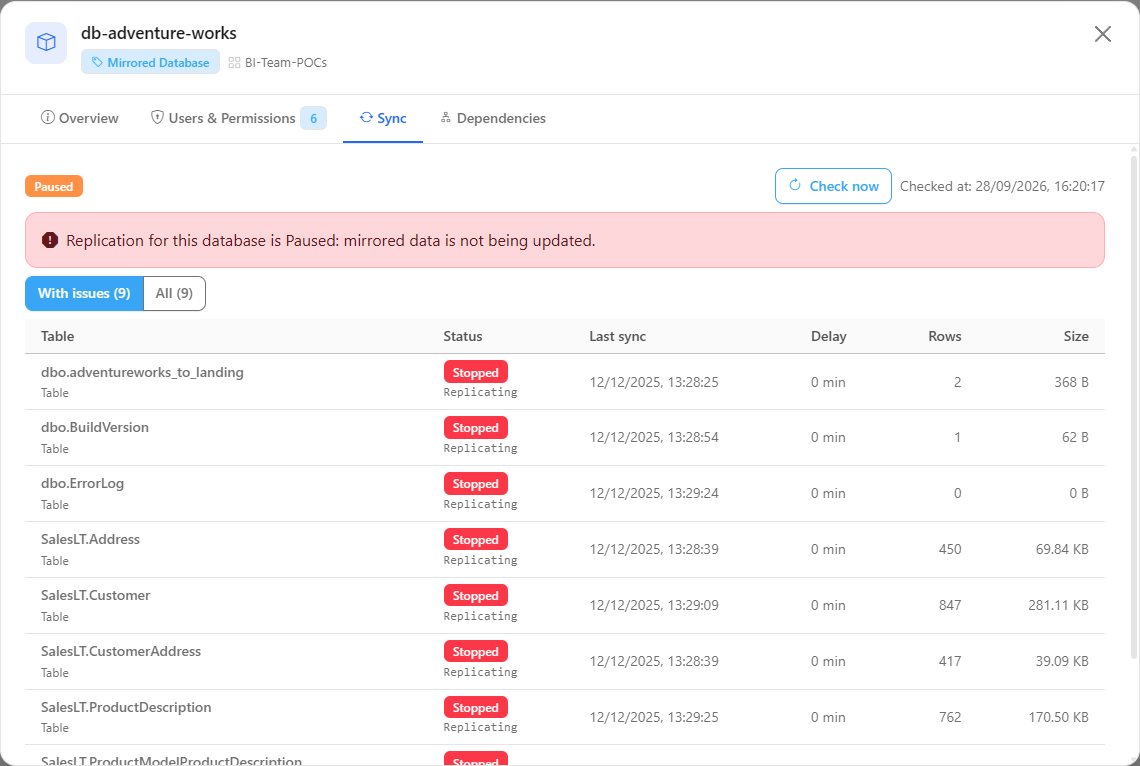
**What it is:** the **Sync** tab of a mirrored database's detail modal, in *Governance › Data and Engineering › Fabric Mirroring*. It queries Fabric **immediately** and shows the same status panel for the database and its tables, **even with no monitor configured**.

**What it is for:** checking the state of a database that does not yet have a monitor, before deciding whether it is worth creating one.

<figure><picture><source srcset="/files/vm5qqidcRI7Qfqq19WbK" media="(prefers-color-scheme: dark)"><img src="https://3938213054-files.gitbook.io/~/files/v0/b/gitbook-x-prod.appspot.com/o/spaces%2FH2bFRBmIfyK3kwVKbldl%2Fuploads%2Fgit-blob-179d763a75f7281c49379cc882503537c6dabc9f%2Fpm-governanca-fabric-mirroring-modal-sincronismo-en.png?alt=media" alt="Sync tab in the detail of a mirrored database in the inventory"></picture><figcaption><p>Sync tab in the mirrored database inventory</p></figcaption></figure>

**How to use:**

1. Click **View Mirrored Databases** (or go to *Governance › Data and Engineering › Fabric Mirroring*).
2. Open the mirrored database detail and click the **Sync** tab.
3. To receive alerts and customize the limit and the window, come back to this screen and create a monitor.

**How it works:** without a monitor, the classification uses the default limit of 30 minutes. The tab is read-only.

## Rules and behavior

### Frequency and window

* The automatic check runs **every 10 minutes**, for every **enabled** monitor whose current moment falls within the **window** (days and time, in the monitor's time zone).
* That is why the smallest allowed maximum delay is **15 minutes**.
* The window cannot cross midnight.
* The data comes from the Microsoft Fabric REST API (mirroring status of the database and status of each mirrored table).

### Database status

| Status                                          | Meaning                                                                                                                  |
| ----------------------------------------------- | ------------------------------------------------------------------------------------------------------------------------ |
| **Running**                                     | Replication active.                                                                                                      |
| **Initializing**, **Initialized**, **Starting** | Normal transition; does not generate an incident.                                                                        |
| **Paused**, **Stopping**, **Stopped**           | **Incident**: mirrored data is not being updated.                                                                        |
| **Unknown**                                     | Power Monitor could not read the status, or Fabric reported a new status (in this case, the original text is displayed). |

### Table status

| Status           | When it happens                                                                                                                                   |
| ---------------- | ------------------------------------------------------------------------------------------------------------------------------------------------- |
| **OK**           | The table is replicating and the delay is equal to or less than the limit.                                                                        |
| **Late**         | The table is replicating and the delay is **greater** than the limit.                                                                             |
| **Failed**       | Fabric reported a failure or error on the table. An error on the table always overrides any other status.                                         |
| **Stopped**      | The table's replication is stopped.                                                                                                               |
| **Initial load** | The table is in a full load (snapshot or reload). During this period the delay is **not** evaluated, to avoid alerts every time mirroring starts. |
| **Error**        | It was not possible to read the table.                                                                                                            |
| **Unknown**      | Status with no delay metric, still initialized, or not recognized. Power Monitor never states that a table is healthy without a measurement.      |
| **Not checked**  | There is no result for the table yet.                                                                                                             |

When the database is paused or stopped, no table is classified as OK while the incident persists.

### How the delay is calculated

* When Fabric reports the **replication latency** (time between the commit at the source and the commit at the target), that is the delay displayed.
* Some sources do not report the commit time. In this case, the delay is measured **since the table's last sync**, and an information icon (ⓘ) next to the value in the *Delay* column indicates this difference.
* Each table's limit is the monitor's **Default maximum delay**, except when the table has its own override (**Override** badge).

### Tables that leave mirroring

Tables are discovered automatically. A table that is no longer reported by Fabric is not deleted: it receives the **Out of mirroring** badge, is dimmed at the end of the list, keeps its last known result, and **no longer counts** toward incidents. If it is reported again, it goes back to being monitored normally. Each monitor tracks up to 1,000 tables.

### Alerts generated

An automatic check generates an alert when at least one of these situations occurs:

* the database replication is **paused, stopping, or stopped** (if the *Alert when the database replication is paused or stopped* option is selected);
* there are **late** tables (always alerts);
* there are **failed or stopped** tables (if the *Alert when a table fails or stops replicating* option is selected);
* it was not possible to query Fabric (for example, no permission or database deleted).

Sending behavior:

* The email has the subject **"Mirroring interrupted"** (database stopped) or **"Mirroring sync delayed"** (table problems) and lists the tables with issues, last sync, delay, limit, and status.
* While the problem continues, a new email (**"Reminder: ..."**) is only sent after the **Minimum interval between alerts**.
* Each incident email records an occurrence of type **Mirroring** in the [Alerts](/en/power-monitor/monitoramento/alertas.md) center.
* When the database returns to normal, the occurrence is closed and the **alert resolved** email ("Mirroring back to normal") is sent, following the organization's general alert notification rules. The interval between alerts is reset, so that a new problem is reported immediately.
* Recipients (administrators and workspace contacts) are resolved at the time of sending.
* Databases with issues also appear in the **Fabric Mirroring with Issues** panel of the [Monitoring Dashboard](/en/power-monitor/dashboards/dashboard-de-monitoramento.md).

### Prerequisites and permissions

* The mirrored database must be listed in the Power Monitor inventory, belong to a **monitored workspace**, and not be deleted.
* The Power Monitor service principal must have **read permission on the item** (for example, be a member of the workspace). Mirroring status queries do **not** use the Admin API, so access does not come automatically from the tenant. Without this permission, the check shows the message *"No read permission on this mirrored database"*.
* Other possible messages: token rejected by Fabric (check the organization's credentials), database not found in Fabric (it may have been deleted), API request limit (the check is retried in the next cycle), and timeout exceeded.

## Frequently asked questions

<details>

<summary>My mirrored database does not appear in the form list.</summary>

The database must have been discovered by the inventory scan, be in a monitored workspace, and not be deleted. If it appears as **Already monitored**, edit the existing monitor.

</details>

<details>

<summary>Why doesn't a table in initial load appear as late?</summary>

During a full load (snapshot or reload), the last sync date is naturally old. Evaluating the delay during this period would generate an alert every time mirroring starts, so the table stays as **Initial load** until it starts replicating again.

</details>

<details>

<summary>The delay shows an information icon (ⓘ). What does it mean?</summary>

The source does not report the commit time, so Power Monitor measures the delay since the table's last sync. This number indicates how long the table has not been processed, not the exact replication latency.

</details>

<details>

<summary>Can I set a different delay limit for a specific table?</summary>

The form defines the **Default maximum delay**, valid for all tables. Tables with their own limit are identified in the sync modal by the **Override** badge.

</details>

<details>

<summary>The check shows "No read permission on this mirrored database".</summary>

Grant the Power Monitor service principal (or its security group) access to the mirrored database's workspace, with at least read permission on the item, and click **Check now**.

</details>

<details>

<summary>I receive too many emails about the same problem.</summary>

Increase the **Minimum interval between alerts** (up to 24 hours) on the monitor. If the problem is expected at certain times, restrict the **Monitoring window**.

</details>

## Related pages

* [Data Freshness](/en/power-monitor/monitoramento/atualizacao-de-dados.md)
* [Microsoft Fabric Items](/en/power-monitor/monitoramento/itens-do-microsoft-fabric.md)
* [Artifact Refreshes](/en/power-monitor/dashboards/atualizacoes-de-artefatos.md)
* [Alerts](/en/power-monitor/monitoramento/alertas.md)
* [Monitoring Dashboard](/en/power-monitor/dashboards/dashboard-de-monitoramento.md)
* [Workspaces (Governance)](/en/power-monitor/governanca/workspaces.md)
* [Monitoring overview](/en/power-monitor/monitoramento.md)


---

# Agent Instructions
This documentation is published with GitBook. GitBook is the documentation platform designed so that both humans and AI agents can read, navigate, and reason over technical content effectively. Learn more at gitbook.com.

## Querying This Documentation
If you need additional information that is not directly available in this page, you can query the documentation by asking a question.

Perform an HTTP GET request on the following URL with the `ask` and `goal` query parameters:

```
GET https://docs.powermonitor.com.br/en/power-monitor/monitoramento/fabric-mirroring.md?ask=<question>&goal=<user_goal>
```

`ask` is the immediate question: it should be specific, self-contained, and written in natural language.
`goal` is what the user is ultimately trying to achieve, the reason they need the answer. Sharing it helps GitBook give you a better, more relevant answer. A goal is most helpful when it describes the outcome the user wants rather than restating the question. For example, with `ask=how do I create an API token`, a goal like `automate deployments from our CI pipeline` lets GitBook tailor the answer to that use case.

The response will contain a direct answer to the question and relevant excerpts and sources from the documentation.

Use this mechanism when the answer is not explicitly present in the current page, you need clarification or additional context, or you want to retrieve related documentation sections.