> For the complete documentation index, see [llms.txt](https://docs.powermonitor.com.br/llms.txt). Markdown versions of documentation pages are available by appending `.md` to page URLs; this page is available as [Markdown](https://docs.powermonitor.com.br/en/power-monitor/monitoramento/gateways.md).
# Gateways
Track whether your on-premises data gateways are online, how long they have been down, and the history of the last incident.
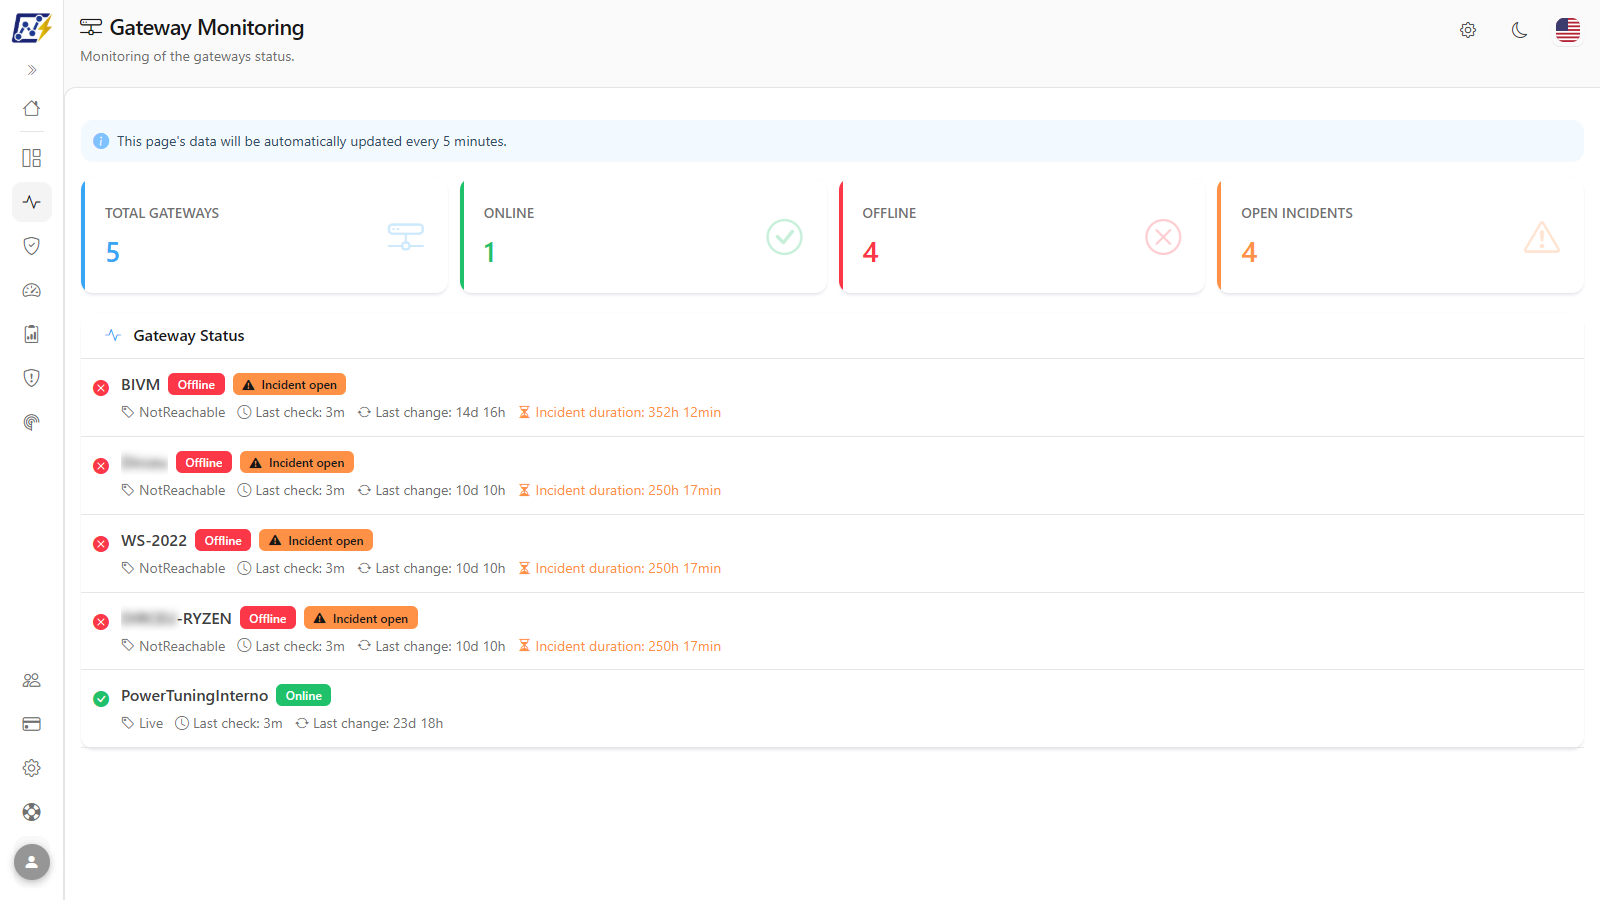
The **Gateways** screen (page title: **Gateway Monitoring**) shows the online/offline status of each on-premises data gateway (*On-premises data gateway*) in your organization, checked automatically by Power Monitor, and the ongoing or recent unavailability incidents.
**How to access:** *Monitoring › Gateways*. The screen is available to **all profiles**; gateways are tenant resources and appear to all users, regardless of workspace scope. Turning gateway monitoring on or off is an action restricted to **Administrators** (see [Enable Gateway Monitoring](/en/power-monitor/monitoramento/gateways/ativar-monitoramento-de-gateways.md)).
Each row also has an **options menu** (⋮ or right-click) to open the gateway details and lineage (see [Row options menu](#row-options-menu)).
Gateway Monitoring
## What it is for
* **Quickly detect a gateway that is down**, before the scheduled refreshes that depend on it start failing.
* **Measure the duration of an ongoing incident** and check how long the last one lasted.
* **Confirm recovery** after restarting the gateway service or the machine.
For the complete gateway inventory (cluster members, installed versions, how far behind the current Microsoft version they are, connections, and data sources), use [Governance › Infrastructure › Gateways](/en/power-monitor/governanca/infraestrutura/gateways.md).
The list has no filters or export; the only per-gateway action is the [row options menu](#row-options-menu).
## Features
### Automatic refresh
**What it is:** the notice *"This page's data will be automatically updated every 5 minutes."*, at the top of the screen.
**What it is for:** leaving the screen open on a monitor (for example, during maintenance on the gateway server) and following the status change without reloading the browser.
**How to use:** just keep the page open. To force an immediate query, reload the browser.
**How it works:** while the page is open, the list is queried again every 5 minutes, the same interval at which Power Monitor checks the gateway status.
### Summary cards
**What it is:** the four cards above the list: **Total Gateways**, **Online**, **Offline**, and **Open Incidents**.
**What it is for:** knowing in a second whether any gateway is down.
Summary cards
| Card | What it counts |
| ------------------ | ------------------------------------------------------------ |
| **Total Gateways** | Gateways with a recorded status check. |
| **Online** | Gateways whose last status reported by Microsoft is online. |
| **Offline** | All others (offline, not reachable, or unrecognized status). |
| **Open Incidents** | Gateways with an ongoing unavailability incident. |
**How to use:**
1. Go to *Monitoring › Gateways*.
2. Look at the **Offline** and **Open Incidents** cards: any value above zero deserves attention.
3. Find the affected gateways in the **Gateway Status** list, right below.
### "Gateway Status" list
**What it is:** the list with one row per gateway, showing the current status and the check and incident times.
**What it is for:** identifying which gateway is down, for how long, and how long each one's last incident lasted.
Gateway Status list
| Information | Description |
| --------------------------------------- | ---------------------------------------------------------------------------------------------------- |
| **Online** / **Offline** icon and badge | Green when online; red in all other cases. |
| **Name** | Gateway name (or *Unnamed gateway*). |
| **Incident open** badge | Yellow, present while the gateway is down. |
| Reported status | The raw status returned by Microsoft (for example, *Live*). |
| **Last check** | How long ago the status was checked. |
| **Last change** | How long ago the status last changed (appears once a change has occurred). |
| **Incident duration** | How long the ongoing incident has lasted so far (only with an open incident). |
| **Last incident duration** | Duration of the last incident (only when there is no open incident and there has been at least one). |
**How to use:**
* **See whether any gateway is down:** look for rows with the red **Offline** badge and the **Incident open** badge.
* **Measure how long a gateway has been down:** in the row with **Incident open**, read **Incident duration**.
* **See the exact date and time:** hover over **Last check** or **Last change**.
**How it works:** durations are displayed in seconds, minutes, or hours and minutes (for example, *2h 15min*). If no gateway has been checked yet, the list shows **"No gateway found."** If the query fails, the screen displays *Failed to load gateways. Please try again.*
### Row options menu
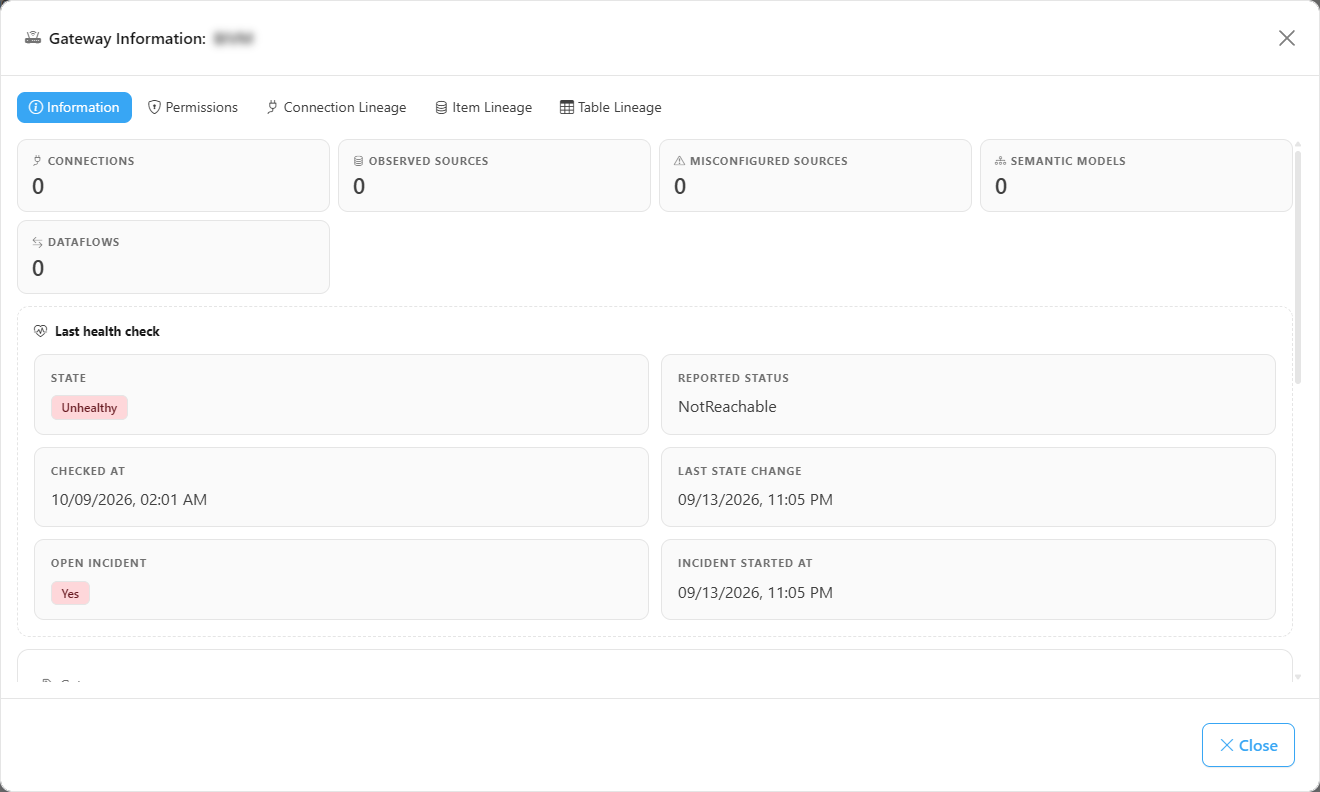
**What it is:** the ⋮ button at the end of each gateway in the **Gateway Status** list (or right-clicking the row) opens the menu with **Open details**, the **same menu and the same details modal** as the [Governance › Infrastructure › Gateways](/en/power-monitor/governanca/infraestrutura/gateways.md#row-actions-menu) screen.
**What it is for:** from a gateway that is down (or about to go into maintenance), see right away which connections, items and tables depend on it, without changing screens.
Options menu of a gateway in Monitoring › Gateways
| Item | What it does |
| -------------------------------------------------- | ----------------------------------------------------------------------------------- |
| **Open details** | When clicked, opens the details modal on the **Information** tab |
| **Open details › Information** (submenu, on hover) | Opens the modal on the **Information** tab |
| **Open details › Lineage** (submenu, on hover) | Opens the modal on the **Item Lineage** tab, showing what goes through this gateway |
Gateway details modal
The modal has the five Governance tabs: **Information**, **Permissions**, **Connection Lineage**, **Item Lineage** and **Table Lineage**; the content and rules of each one are in [Governance › Gateways](/en/power-monitor/governanca/infraestrutura/gateways.md).
**How to use:**
1. Click **⋮** at the end of the gateway row (or right-click the row).
2. Click **Open details** to open the **Information** tab, or hover over it and choose **Lineage** to go straight to the **Item Lineage** tab.
**Rules:**
* **Rows without a menu:** when the gateway is not yet in the [Governance › Gateways](/en/power-monitor/governanca/infraestrutura/gateways.md) list (for example, it was just discovered and the scan has not collected it yet), the row shows no ⋮ button and does not open the menu on right-click.
* **If the Governance list fails to load** (for example, the *Governance › Gateways* page is blocked for your user), only the menu disappears; the **Gateway Status** list and the cards keep working normally.
* The menu is visible to all profiles that access the screen; the modal rules (for example, granting access in the *Permissions* tab, exclusive to Administrators) are the same as in Governance.
### Recovery confirmation
**What it is:** the change the list shows when a gateway comes back online.
**What it is for:** confirming that the intervention in the environment solved the problem.
**How to use:**
{% stepper %}
{% step %}
### Fix the cause in the environment
Restart the on-premises data gateway service or the machine, or allow network communication with Microsoft services.
{% endstep %}
{% step %}
### Wait for the next check
The status is checked every 5 minutes. Keep the page open (it refreshes by itself) or reload the browser after a few minutes.
{% endstep %}
{% step %}
### Check the result
The gateway shows the **Online** badge again, the **Incident open** badge disappears, and the row starts showing **Last incident duration**. The recovery email is sent to the recipients and the incident appears as **Resolved** in [Alerts](/en/power-monitor/monitoramento/alertas.md).
{% endstep %}
{% endstepper %}
### Adding a gateway that does not appear in the list
**What it is:** the path to start monitoring a gateway that is not yet on the screen.
**What it is for:** covering new gateways or gateways the Service Principal does not yet have access to.
**How to use:** prerequisite: **Administrator** profile. Follow [Enable Gateway Monitoring](/en/power-monitor/monitoramento/gateways/ativar-monitoramento-de-gateways.md): grant the Service Principal admin access to the gateway, run the [Gateway Scan](/en/power-monitor/mapeamento/gateways.md), and confirm that **Gateway Monitoring** is turned on.
## Rules and behavior
* **Frequency:** with gateway monitoring turned on, Power Monitor queries the status of each known gateway **every 5 minutes**, using the Power BI API with the organization's Service Principal.
* **Which gateways:** the gateways discovered by the [Gateway Scan](/en/power-monitor/mapeamento/gateways.md) on which the Service Principal is an **administrator**. Gateways without this permission cannot have their status queried.
* **Classification:** *online* / *live* status is Online; *offline* and *not reachable* are Offline; any other status is also displayed as Offline on this screen.
* **Incidents and alerts:**
* When a gateway goes down, an incident is opened, an alert is recorded on the [Alerts](/en/power-monitor/monitoramento/alertas.md) screen, and **one gateway offline email** is sent to the recipients configured in *Settings › Notifications*.
* While the incident continues, Power Monitor records the recurrences but **does not resend the email**; the gateway keeps appearing in the environment's hourly checklist.
* When the gateway comes back online, the incident is closed and a **recovery email** is sent.
* **Turning monitoring off** stops the checks; the displayed data is no longer updated (look at **Last check**).
## Frequently asked questions
A gateway shows as Offline, but the machine is on.
Check on the machine whether the on-premises data gateway service is running and whether outbound network traffic to Microsoft services is allowed in the firewall/proxy. Also check, in the Power BI portal (*Manage connections and gateways*), the status reported by Microsoft itself: Power Monitor displays the same status the API returns.
Why does a gateway in the list have no ⋮ button?
The gateway is not yet in the Governance list (run the [Gateway Scan](/en/power-monitor/mapeamento/gateways.md) and wait for the next refresh) or the Governance list could not be loaded for your user. The status is still displayed normally; only the menu is omitted.
An existing gateway does not appear in the list.
The Power Monitor Service Principal must be an **administrator** of the gateway, and the gateway must have been discovered by the Gateway Scan. Follow [Enable Gateway Monitoring](/en/power-monitor/monitoramento/gateways/ativar-monitoramento-de-gateways.md) and wait up to 5 minutes after turning on monitoring.
I received the offline email only once, even though the gateway is still down.
This is the expected behavior: the email is sent when the incident opens and when it closes. In the meantime, the incident is visible on this screen, in Alerts, and in the hourly checklist.
## Related pages
* [Enable Gateway Monitoring](/en/power-monitor/monitoramento/gateways/ativar-monitoramento-de-gateways.md)
* [Governance › Infrastructure › Gateways](/en/power-monitor/governanca/infraestrutura/gateways.md)
* [Gateway Scan](/en/power-monitor/mapeamento/gateways.md)
* [Alerts](/en/power-monitor/monitoramento/alertas.md)
* [Settings](/en/power-monitor/configuracoes.md)
---
# Agent Instructions
This documentation is published with GitBook. GitBook is the documentation platform designed so that both humans and AI agents can read, navigate, and reason over technical content effectively. Learn more at gitbook.com.
## Querying This Documentation
If you need additional information that is not directly available in this page, you can query the documentation by asking a question.
Perform an HTTP GET request on the following URL with the `ask` and `goal` query parameters:
```
GET https://docs.powermonitor.com.br/en/power-monitor/monitoramento/gateways.md?ask=&goal=
```
`ask` is the immediate question: it should be specific, self-contained, and written in natural language.
`goal` is what the user is ultimately trying to achieve, the reason they need the answer. Sharing it helps GitBook give you a better, more relevant answer. A goal is most helpful when it describes the outcome the user wants rather than restating the question. For example, with `ask=how do I create an API token`, a goal like `automate deployments from our CI pipeline` lets GitBook tailor the answer to that use case.
The response will contain a direct answer to the question and relevant excerpts and sources from the documentation.
Use this mechanism when the answer is not explicitly present in the current page, you need clarification or additional context, or you want to retrieve related documentation sections.