> For the complete documentation index, see [llms.txt](https://docs.powermonitor.com.br/llms.txt). Markdown versions of documentation pages are available by appending `.md` to page URLs; this page is available as [Markdown](https://docs.powermonitor.com.br/en/power-monitor/monitoramento/gateways/ativar-monitoramento-de-gateways.md).

# Enable Gateway Monitoring

Step-by-step guide to give the Service Principal admin access to your gateways, discover them, and turn on status monitoring.

For Power Monitor to query the status of your on-premises data gateways, three conditions must be met:

1. The Power Monitor **Service Principal** is an **administrator** of each gateway you want to monitor.
2. The gateways have been discovered by the **Gateway Scan**.
3. **Gateway Monitoring** is turned on in *Settings › Monitoring*.

## Prerequisites

* **Administrator** profile in Power Monitor (the *Settings* screens are restricted to this profile).
* For automatic granting (option A): a **tenant administrator** account (Global Administrator or Fabric Administrator).
* For manual granting (option B): an account that is a **gateway administrator** in Power BI.

## Features

### "Gateways and connections" card (Settings › Additional Permissions)

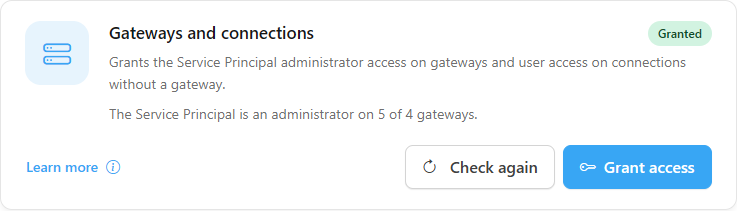
**What it is:** the **Gateways and connections** card, in *Settings › Additional Permissions*, which shows whether the Service Principal already has access to the gateways and lets you grant it without leaving Power Monitor.

**What it is for:** giving the Service Principal, in a single step, admin access to all on-premises data gateways visible to your account and user access to cloud connections (without a gateway), which is what status monitoring, the connections inventory, and the gateway version check require.

<figure><picture><source srcset="/files/eMDbbV0cKyeYbJ8FeZDL" media="(prefers-color-scheme: dark)"><img src="https://3938213054-files.gitbook.io/~/files/v0/b/gitbook-x-prod.appspot.com/o/spaces%2FH2bFRBmIfyK3kwVKbldl%2Fuploads%2Fgit-blob-37f0d1bbc429a82b38793665c8bba87a3d1a9e77%2Fpm-configuracoes-permissoes-adicionais-gateways-en.png?alt=media" alt="Gateways and connections card in Settings › Additional Permissions"></picture><figcaption><p>Settings › Additional Permissions › Gateways and connections</p></figcaption></figure>

**How to use:**

* Read the badge next to the title, with the result of the check (for example, **Granted**, **Partial**, or **Not granted**), and the detail line *The Service Principal is an administrator on X of Y gateways.*
* Click **Check again** to re-run the check after a change made in Power BI.
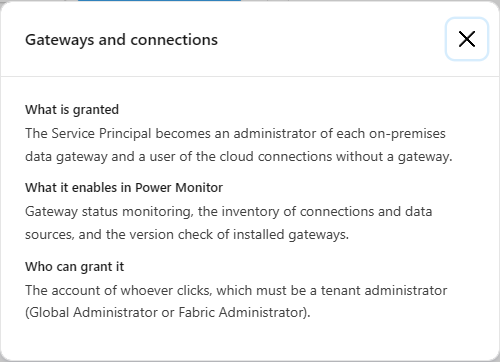
* Click **Learn more** to see what is granted, what it enables, and who can grant it.
* Click **Grant access** to perform the grant (see the step-by-step in *How to enable gateway monitoring*, below).

<figure><picture><source srcset="/files/xBodG3TcEeVr6pEiBiXb" media="(prefers-color-scheme: dark)"><img src="https://3938213054-files.gitbook.io/~/files/v0/b/gitbook-x-prod.appspot.com/o/spaces%2FH2bFRBmIfyK3kwVKbldl%2Fuploads%2Fgit-blob-2eaee3b4fbfa511b735278704d21d27ae9f389f7%2Fpm-configuracoes-permissoes-adicionais-gateways-saiba-mais-en.png?alt=media" alt="Learn more window of the Gateways and connections card"></picture><figcaption><p>Learn more: what is granted and who can grant it</p></figcaption></figure>

**How it works:**

* The grant uses the **account of the person who clicks**, which must be a tenant administrator (Global or Fabric Administrator). If additional consent is required, the browser opens the Microsoft consent window.
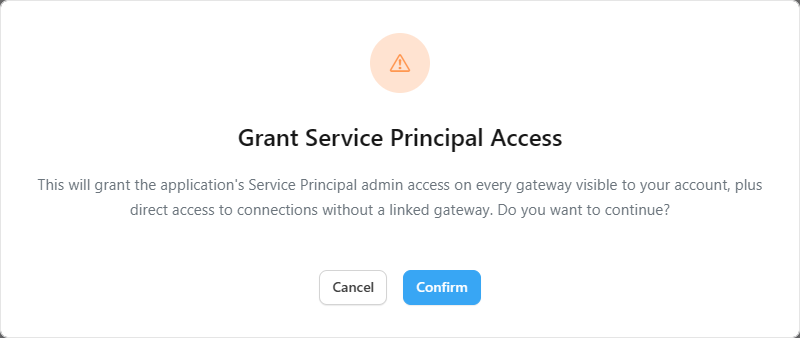
* Before granting, the screen asks for confirmation in the **Grant Service Principal Access** modal (**Confirm** or **Cancel**).
* During the grant, the button shows the progress (*N of M processed*). At the end, the card summarizes the result for gateways and for connections: how many were granted, how many already had access, how many failed, and how many were rate-limited. When everything succeeds, the message *Service Principal access granted to gateways.* confirms it. If there is nothing eligible, the card shows *No eligible gateway or connection was found under your access, so there was nothing to grant.*
* After the grant, the check is re-run automatically.
* The same card exists in the setup wizard for new organizations.

<figure><picture><source srcset="/files/XKE7jOeZ3HuFNkBOK4Gc" media="(prefers-color-scheme: dark)"><img src="https://3938213054-files.gitbook.io/~/files/v0/b/gitbook-x-prod.appspot.com/o/spaces%2FH2bFRBmIfyK3kwVKbldl%2Fuploads%2Fgit-blob-cd1a4d108601e41dd0d484805b12fd008a17db0f%2Fpm-configuracoes-permissoes-adicionais-gateways-confirmar-en.png?alt=media" alt="Grant Service Principal Access modal with the Confirm and Cancel buttons"></picture><figcaption><p>Confirming the grant of access to gateways</p></figcaption></figure>

### "Gateway Monitoring" toggle (Settings › Monitoring)

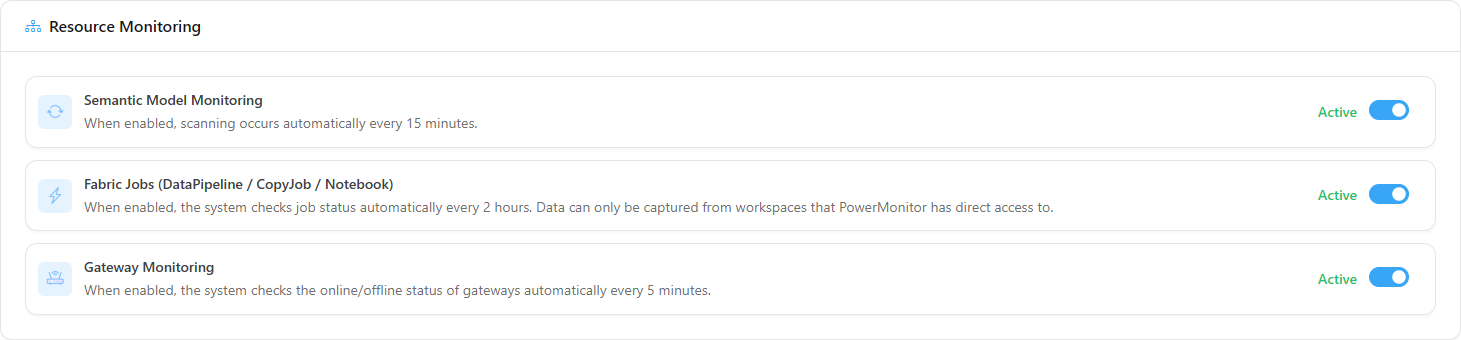
**What it is:** the **Gateway Monitoring** toggle, in the **Resource Monitoring** card of *Settings › Monitoring*, which turns the automatic gateway status check on or off.

**What it is for:** starting (or stopping) tracking the online/offline status of gateways, with incidents, alerts, and gateway offline and recovery emails.

<figure><picture><source srcset="/files/u1qTEObuAmN7VIP32knP" media="(prefers-color-scheme: dark)"><img src="https://3938213054-files.gitbook.io/~/files/v0/b/gitbook-x-prod.appspot.com/o/spaces%2FH2bFRBmIfyK3kwVKbldl%2Fuploads%2Fgit-blob-160a23bc702427785073007b7a9f0a534f9311d1%2Fpm-configuracoes-monitoramento-recursos-en.png?alt=media" alt="Gateway Monitoring toggle in the Resource Monitoring card"></picture><figcaption><p>Settings › Monitoring › Resource Monitoring</p></figcaption></figure>

<figure><picture><source srcset="/files/So8tydSgac2dCZnrfLcJ" media="(prefers-color-scheme: dark)"><img src="https://3938213054-files.gitbook.io/~/files/v0/b/gitbook-x-prod.appspot.com/o/spaces%2FH2bFRBmIfyK3kwVKbldl%2Fuploads%2Fgit-blob-e441b969c5899c7bc5291dfcbf6ba9df23262045%2Fpm-configuracoes-monitoramento-recurso-gateway-en.png?alt=media" alt="Gateway Monitoring card with the toggle and the Active or Inactive state"></picture><figcaption><p>Gateway Monitoring card</p></figcaption></figure>

**How to use:**

1. Go to *Settings › Monitoring*.
2. In the **Resource Monitoring** card, find **Gateway Monitoring**.
3. Turn the toggle on to enable it or off to disable it. The card shows **Active** or **Inactive**, and the messages *Monitoring enabled successfully.* or *Monitoring disabled successfully.* confirm the change.

**How it works:**

* When enabled, the system checks the online/offline status of gateways automatically **every 5 minutes**.
* If no gateways have been discovered yet, the **No Gateway found** panel appears in place of the toggle, explaining that you must have gateways installed in the organization and run a scan so the system can identify them.
* The setting applies to the entire organization.

## How to use

### How to enable gateway monitoring

{% stepper %}
{% step %}

### Grant the Service Principal admin access to the gateways

**Option A: from Power Monitor (recommended).** Go to *Settings › Additional Permissions* and, in the **Gateways and connections** card, click **Grant access** and then **Confirm**. With a tenant administrator account, Power Monitor makes the Service Principal an administrator of each visible on-premises data gateway and a user of the cloud connections (without a gateway).

**Option B: manually in Power BI.** In the [Power BI Service](https://app.powerbi.com), sign in with the gateway administrator account, click the gear icon in the header, and open **Manage connections and gateways**.

<figure><img src="https://3938213054-files.gitbook.io/~/files/v0/b/gitbook-x-prod.appspot.com/o/spaces%2FH2bFRBmIfyK3kwVKbldl%2Fuploads%2Fgit-blob-78f0e7cc2deff191514e5c0610e8522f4c82e4ff%2Fimage%20(35).png?alt=media" alt="Power BI settings menu with the Manage connections and gateways option" width="343"><figcaption><p>Manage connections and gateways</p></figcaption></figure>

On the on-premises data gateways tab, select the gateway you want to monitor.

<figure><img src="https://3938213054-files.gitbook.io/~/files/v0/b/gitbook-x-prod.appspot.com/o/spaces%2FH2bFRBmIfyK3kwVKbldl%2Fuploads%2Fgit-blob-1af7e850fea8fef647557dc40d7ccfa9daf0c884%2Fimage%20(34).png?alt=media" alt="List of on-premises data gateways"><figcaption><p>On-premises data gateways</p></figcaption></figure>

Click **Manage users**.

<figure><img src="https://3938213054-files.gitbook.io/~/files/v0/b/gitbook-x-prod.appspot.com/o/spaces%2FH2bFRBmIfyK3kwVKbldl%2Fuploads%2Fgit-blob-2d56b1e26db2274862dc579f44f155444c85dd31%2Fimage%20(37).png?alt=media" alt="Gateway Manage users option"><figcaption><p>Manage users</p></figcaption></figure>

Search for the Power Monitor Service Principal (by default, **PowerMonitor-APP**, or the name defined when your organization was set up) and add it.

<figure><img src="https://3938213054-files.gitbook.io/~/files/v0/b/gitbook-x-prod.appspot.com/o/spaces%2FH2bFRBmIfyK3kwVKbldl%2Fuploads%2Fgit-blob-03e4e9ac3962526910e12d7fbafc159ae9547c5f%2Fimage%20(38).png?alt=media" alt="Searching for the Service Principal when adding a user to the gateway"><figcaption><p>Adding the Service Principal</p></figcaption></figure>

Save, open user management again, and change the Service Principal's role to **Admin**. Save again. Repeat for each gateway (or cluster) you want to monitor.

<figure><img src="https://3938213054-files.gitbook.io/~/files/v0/b/gitbook-x-prod.appspot.com/o/spaces%2FH2bFRBmIfyK3kwVKbldl%2Fuploads%2Fgit-blob-b5b76397606e88d6a54ef97905770e5452617542%2Fimage%20(39).png?alt=media" alt="Admin role selected for the Service Principal"><figcaption><p>Admin role</p></figcaption></figure>
{% endstep %}

{% step %}

### Discover the gateways

In Power Monitor, go to *Mapping › Gateways* and run the scan (see [Gateway Scan](/en/power-monitor/mapeamento/gateways.md)). When it finishes, the gateways are listed in the inventory ([Governance › Infrastructure › Gateways](/en/power-monitor/governanca/infraestrutura/gateways.md)).
{% endstep %}

{% step %}

### Turn on Gateway Monitoring

Go to *Settings › Monitoring* and, in the **Resource Monitoring** card, turn on **Gateway Monitoring**. The message *Monitoring enabled successfully.* confirms the change.

If the card shows **No Gateway found**, go back to the previous step: you must have gateways installed in the organization and have run the Gateway Scan.
{% endstep %}

{% step %}

### Check the result

Within 5 minutes, the gateways appear in [Monitoring › Gateways](/en/power-monitor/monitoramento/gateways.md) with their current status.
{% endstep %}
{% endstepper %}

### How to turn off gateway monitoring

Prerequisite: **Administrator** profile.

1. Go to *Settings › Monitoring*.
2. In the **Resource Monitoring** card, turn off **Gateway Monitoring**. The message *Monitoring disabled successfully.* confirms the change.
3. The checks stop and the [Monitoring › Gateways](/en/power-monitor/monitoramento/gateways.md) screen is no longer updated (look at **Last check**). To resume monitoring, turn the toggle on again.

### How to add a new gateway to monitoring

1. Grant the Service Principal admin access to the new gateway (option A or B of the first step above).
2. Run the [Gateway Scan](/en/power-monitor/mapeamento/gateways.md) again.
3. With **Gateway Monitoring** already on, the gateway starts being checked automatically and appears in [Monitoring › Gateways](/en/power-monitor/monitoramento/gateways.md) within 5 minutes.

## Frequently asked questions

<details>

<summary>The automatic grant did not include some gateways.</summary>

The grant reaches the gateways visible to the account that clicked **Grant access**. For the others, use the manual option with an administrator account for that gateway. The summary shown in the card indicates how many gateways failed or were rate-limited; in that case, try again later.

</details>

<details>

<summary>I added a new gateway. Do I need to redo everything?</summary>

Grant the Service Principal admin access to the new gateway and run the Gateway Scan again. The monitoring that is already on starts including it automatically.

</details>

## Related pages

* [Gateways (Gateway Monitoring)](/en/power-monitor/monitoramento/gateways.md)
* [Governance › Infrastructure › Gateways](/en/power-monitor/governanca/infraestrutura/gateways.md)
* [Gateway Scan](/en/power-monitor/mapeamento/gateways.md)
* [Settings](/en/power-monitor/configuracoes.md)


---

# Agent Instructions
This documentation is published with GitBook. GitBook is the documentation platform designed so that both humans and AI agents can read, navigate, and reason over technical content effectively. Learn more at gitbook.com.

## Querying This Documentation
If you need additional information that is not directly available in this page, you can query the documentation by asking a question.

Perform an HTTP GET request on the following URL with the `ask` and `goal` query parameters:

```
GET https://docs.powermonitor.com.br/en/power-monitor/monitoramento/gateways/ativar-monitoramento-de-gateways.md?ask=<question>&goal=<user_goal>
```

`ask` is the immediate question: it should be specific, self-contained, and written in natural language.
`goal` is what the user is ultimately trying to achieve, the reason they need the answer. Sharing it helps GitBook give you a better, more relevant answer. A goal is most helpful when it describes the outcome the user wants rather than restating the question. For example, with `ask=how do I create an API token`, a goal like `automate deployments from our CI pipeline` lets GitBook tailor the answer to that use case.

The response will contain a direct answer to the question and relevant excerpts and sources from the documentation.

Use this mechanism when the answer is not explicitly present in the current page, you need clarification or additional context, or you want to retrieve related documentation sections.