> For the complete documentation index, see [llms.txt](https://docs.powermonitor.com.br/llms.txt). Markdown versions of documentation pages are available by appending `.md` to page URLs; this page is available as [Markdown](https://docs.powermonitor.com.br/en/power-monitor/monitoramento/itens-do-microsoft-fabric.md).

# Fabric Items

Health status of the latest run of Microsoft Fabric DataPipelines, CopyJobs, Notebooks, and Dataflows Gen2, with open incidents, success rate, last runs, and AI-assisted failure investigation.

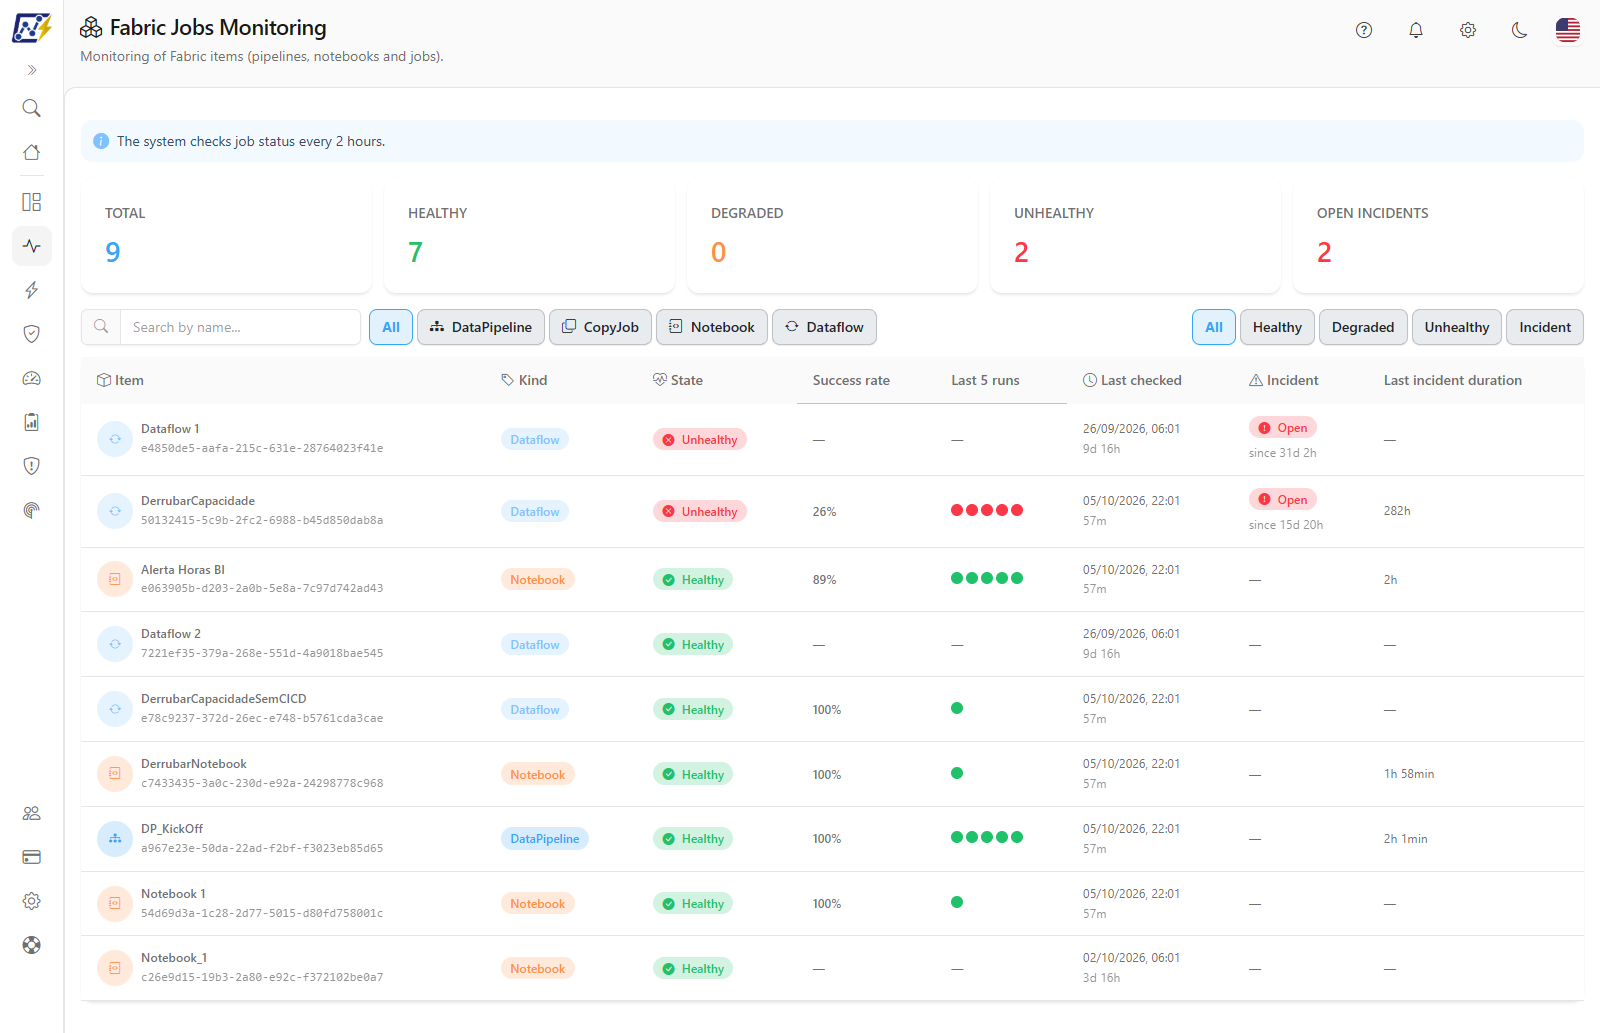
The **Fabric Items** screen (page title: *Fabric Jobs Monitoring*) shows the execution health of Microsoft Fabric data integration and data engineering items (**DataPipelines**, **CopyJobs**, **Notebooks**, and **Dataflows Gen2**) based on the result of the most recent run of each item. Besides the current state, the screen shows the **success rate** and the **last 5 runs** of each item, and lets you open the item details, see the reason for a failure by hovering over the state, and **investigate the failure with AI**.

**How to access:** *Monitoring › Fabric Items*. The screen is available to all user profiles and is for consultation only: it changes nothing in the items. Turning monitoring of these items on or off is an **Administrator** action, done in *Settings › Monitoring*.

<figure><picture><source srcset="/files/rKnc4xHb1FfWnazF1jBH" media="(prefers-color-scheme: dark)"><img src="https://3938213054-files.gitbook.io/~/files/v0/b/gitbook-x-prod.appspot.com/o/spaces%2FH2bFRBmIfyK3kwVKbldl%2Fuploads%2Fgit-blob-1294737b748fcf7559137d9a6eef18c2fa7f76f7%2Fpm-monitoramento-itens-fabric-visao-geral-en.png?alt=media" alt="Fabric Items screen with total cards, type and state filters, and the items table"></picture><figcaption><p>Fabric Items screen</p></figcaption></figure>

## What it is for

* **Quickly know whether ingestion and transformation routines ran well**: for example, whether the daily Lakehouse load pipeline completed or whether a notebook ended with an error.
* **Identify failed items and open incidents** before the problem reaches the reports that depend on this data.
* **Measure how long a problem lasted**: the last incident duration column shows how long the item was failing until it recovered.
* **See how reliable each item is**: the success rate of the last 30 days and the squares of the last 5 runs show whether a failure is isolated or recurring.
* **Find the cause of a failure**: the reason reported by Fabric appears when you hover over the state, and the AI investigation gathers history, recurrence, and an analysis.

## Features

### Automatic check notice

**What it is:** the blue notice at the top of the page: **The system checks job status every 2 hours.**

**What it is for:** reminding you that the state displayed is from the last reading, not real time.

<figure><picture><source srcset="/files/umSv8BJfRjEKUeh7GSEF" media="(prefers-color-scheme: dark)"><img src="https://3938213054-files.gitbook.io/~/files/v0/b/gitbook-x-prod.appspot.com/o/spaces%2FH2bFRBmIfyK3kwVKbldl%2Fuploads%2Fgit-blob-3e012b9a9c9d47cb13d70cfead91ca2c63dcfd77%2Fpm-monitoramento-itens-fabric-aviso-en.png?alt=media" alt="Notice stating that the system checks job status every 2 hours"></picture><figcaption><p>Automatic check notice</p></figcaption></figure>

**How to use:** before concluding that an item is healthy or failing, check in the **Last checked** column when it was read.

**How it works:** the screen itself refreshes every 2 hours, at the same pace as data collection. To see new data before then, reload the browser page.

### Total cards

**What it is:** the five cards at the top: **Total**, **Healthy**, **Degraded**, **Unhealthy**, and **Open incidents**.

**What it is for:** getting an overview of all monitored items at a glance.

<figure><picture><source srcset="/files/VhQAPsOOPgFfGfzZbkht" media="(prefers-color-scheme: dark)"><img src="https://3938213054-files.gitbook.io/~/files/v0/b/gitbook-x-prod.appspot.com/o/spaces%2FH2bFRBmIfyK3kwVKbldl%2Fuploads%2Fgit-blob-d16fd1dbdc33634000b94249f3fb99bb2abafaa2%2Fpm-monitoramento-itens-fabric-totais-en.png?alt=media" alt="Total, Healthy, Degraded, Unhealthy, and Open incidents cards"></picture><figcaption><p>Total cards</p></figcaption></figure>

| Card               | What it counts                                                                                                                                                                                                                  |
| ------------------ | ------------------------------------------------------------------------------------------------------------------------------------------------------------------------------------------------------------------------------- |
| **Total**          | Fabric items tracked by monitoring.                                                                                                                                                                                             |
| **Healthy**        | Items whose last run completed successfully.                                                                                                                                                                                    |
| **Degraded**       | Items whose last run is still in progress, has not started (queued), was skipped as a duplicate, or had an intermediate status. **It does not mean slowness**: see [Degraded chip](#degraded-chip-and-degradation-explanation). |
| **Unhealthy**      | Items whose last run failed or was cancelled.                                                                                                                                                                                   |
| **Open incidents** | Items with an incident that has not been resolved yet (see [Alerts](/en/power-monitor/monitoramento/alertas.md)).                                                                                                               |

**How to use:** if **Unhealthy** or **Open incidents** is greater than zero, use the corresponding state filter (below) to list those items.

**How it works:** the cards consider **all** monitored items, without applying the search or the table filters. The cards are not clickable.

### Search bar and filters

**What it is:** the row above the table with the **Search by name...** field, the **type** buttons (**All**, **DataPipeline**, **CopyJob**, **Notebook**, **Dataflow**), and the **state** buttons (**All**, **Healthy**, **Degraded**, **Unhealthy**, **Incident**).

**What it is for:** narrowing the list down to what matters: a specific item, an item type, or only those with problems.

<figure><picture><source srcset="/files/LcfzATfUjR1bUAtdst4v" media="(prefers-color-scheme: dark)"><img src="https://3938213054-files.gitbook.io/~/files/v0/b/gitbook-x-prod.appspot.com/o/spaces%2FH2bFRBmIfyK3kwVKbldl%2Fuploads%2Fgit-blob-55cb4f07da5f8f9160c0ab7d5d854cceb393aeca%2Fpm-monitoramento-itens-fabric-filtros-en.png?alt=media" alt="Search by name field, type buttons, and state buttons"></picture><figcaption><p>Table search and filters</p></figcaption></figure>

**How it works:** the search and the buttons are applied instantly, can be combined, and return the table to the first page. The active button is highlighted (in green, yellow, or red for the state filters). When nothing matches, the table displays **No items found for the selected filters.**

### Filter by state

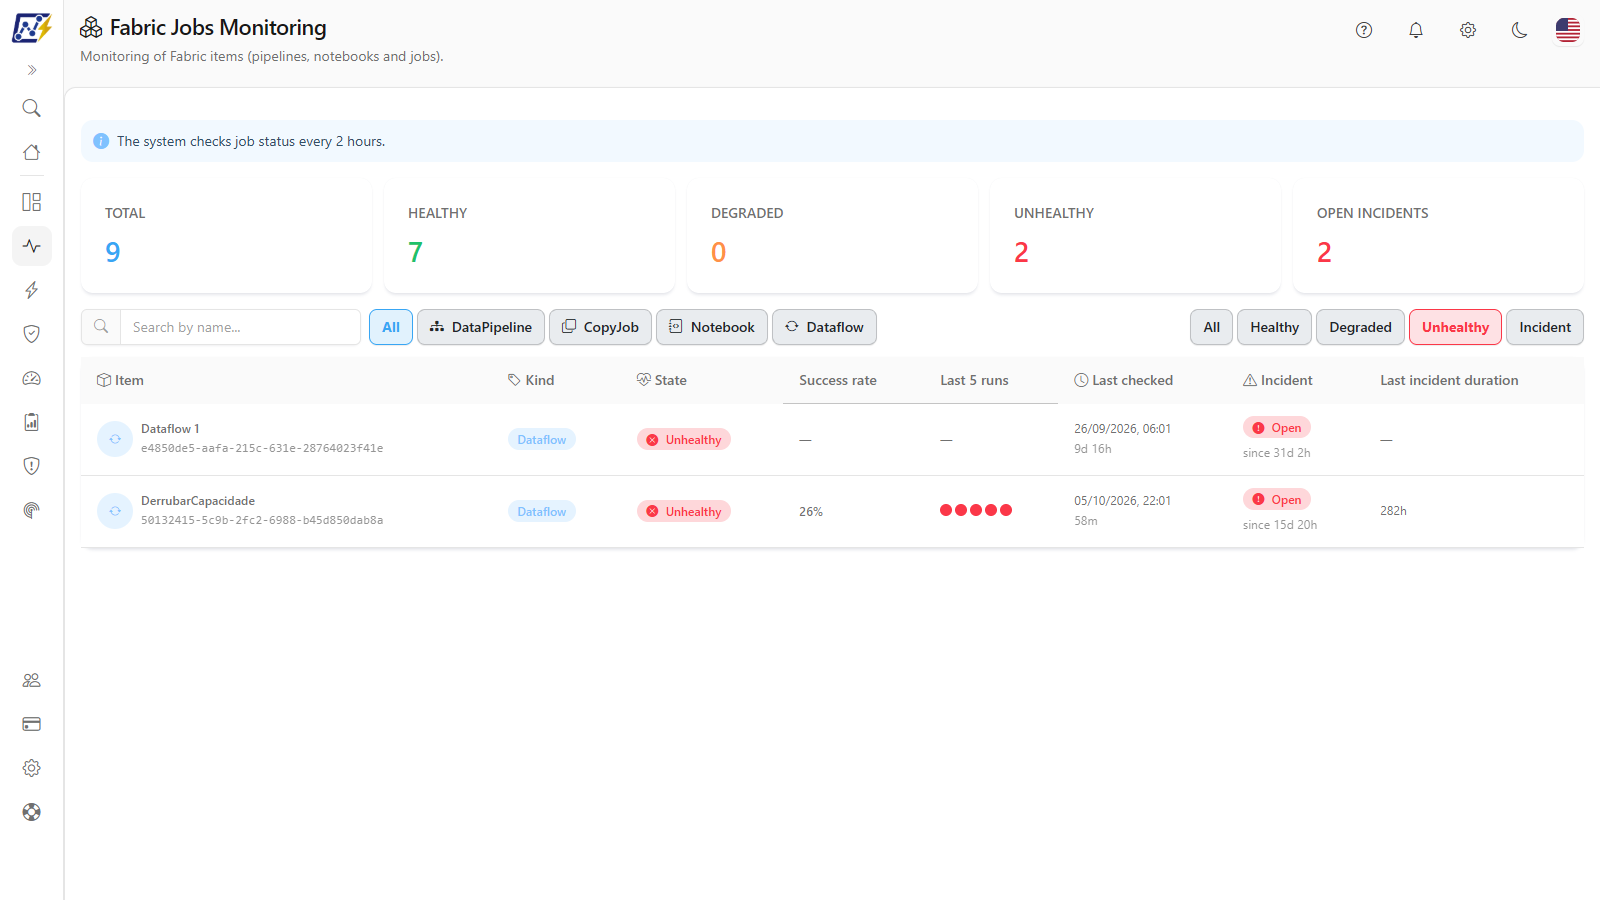
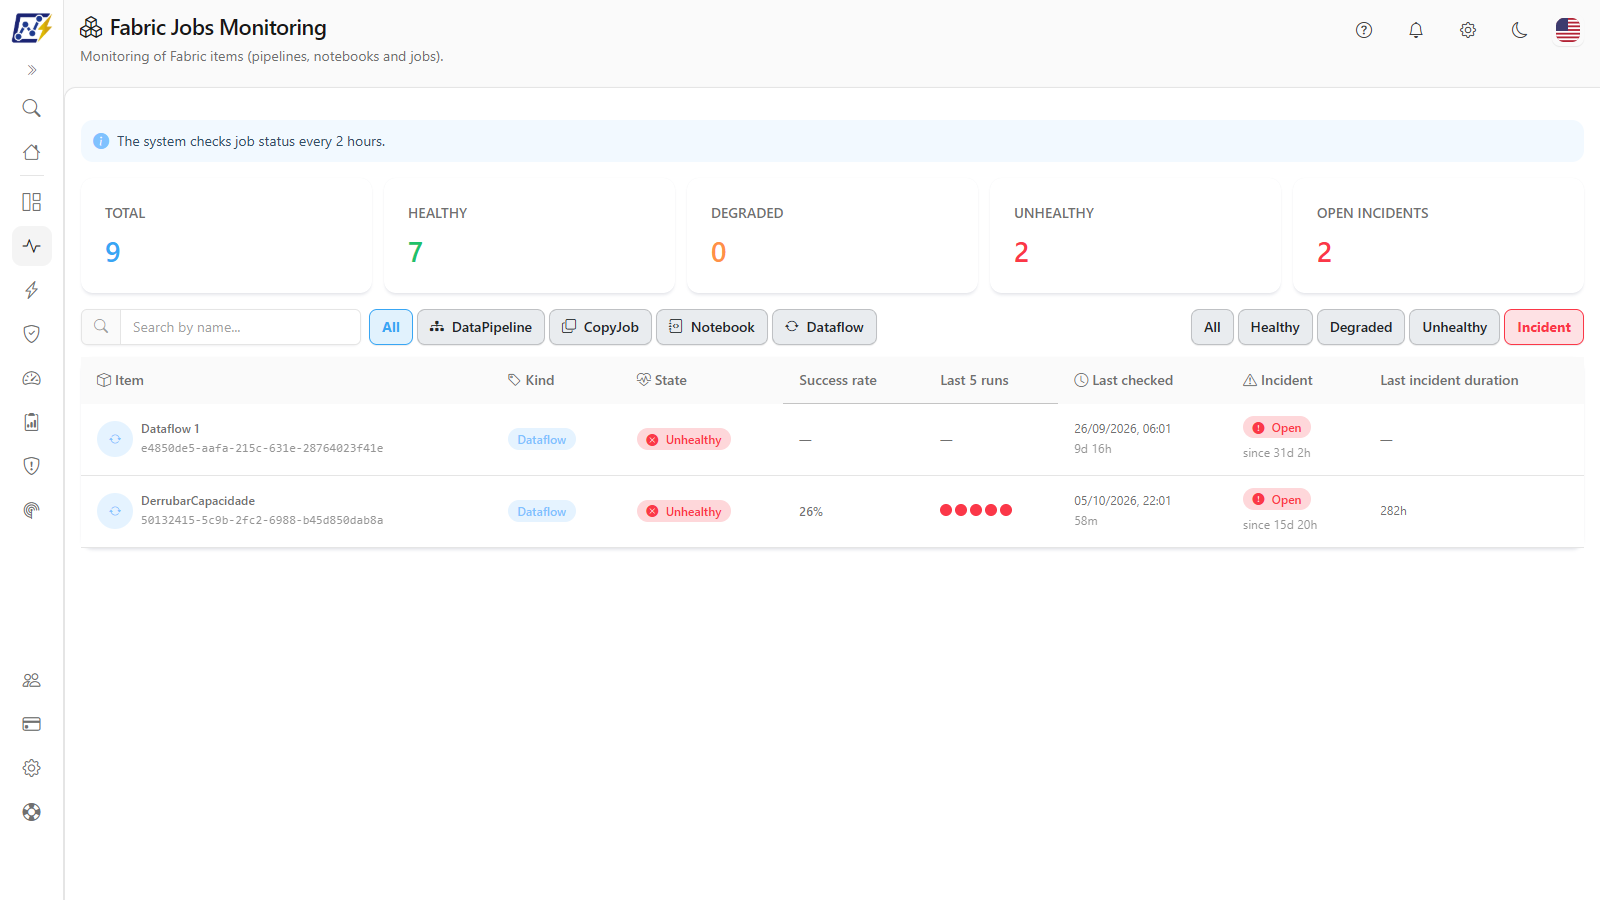
**What it is:** the **All**, **Healthy**, **Degraded**, **Unhealthy**, and **Incident** buttons.

**What it is for:** isolating the items that need attention.

<figure><picture><source srcset="/files/eIdgpQsCDArjvjuT0YS8" media="(prefers-color-scheme: dark)"><img src="https://3938213054-files.gitbook.io/~/files/v0/b/gitbook-x-prod.appspot.com/o/spaces%2FH2bFRBmIfyK3kwVKbldl%2Fuploads%2Fgit-blob-19aa68e92c598a2fa96ab177a4779da15ac3c7ea%2Fpm-monitoramento-itens-fabric-filtro-estado-com-falha-en.png?alt=media" alt="Table filtered by the Unhealthy state"></picture><figcaption><p>"Unhealthy" state filter</p></figcaption></figure>

<figure><picture><source srcset="/files/QgBFjHhhilocuqCuGtub" media="(prefers-color-scheme: dark)"><img src="https://3938213054-files.gitbook.io/~/files/v0/b/gitbook-x-prod.appspot.com/o/spaces%2FH2bFRBmIfyK3kwVKbldl%2Fuploads%2Fgit-blob-cf404b5a76fce6833c5b447052152fbb465352db%2Fpm-monitoramento-itens-fabric-filtro-estado-incidente-en.png?alt=media" alt="Table filtered by items with an open incident"></picture><figcaption><p>"Incident" state filter</p></figcaption></figure>

**How to use:**

1. Click **Unhealthy** to see the runs that failed or were cancelled, **Incident** to see only items with an open incident, or **Degraded** to follow items in progress.
2. Note the item name and open the [Alerts](/en/power-monitor/monitoramento/alertas.md) screen, filtering by the **Fabric Item** type, to see the error message and the recurrences.
3. Click **All** to remove the state filter.

**How it works:** **Incident** shows the items with an open incident, whatever their current state. The other buttons filter by the state of the last run (see [How the state is defined](#how-the-state-is-defined)).

### Filter by type

**What it is:** the **All**, **DataPipeline**, **CopyJob**, **Notebook**, and **Dataflow** buttons.

**What it is for:** focusing on one type of routine, for example only the ingestion pipelines.

<figure><picture><source srcset="/files/H2rFU50vFjeEvEjfihgq" media="(prefers-color-scheme: dark)"><img src="https://3938213054-files.gitbook.io/~/files/v0/b/gitbook-x-prod.appspot.com/o/spaces%2FH2bFRBmIfyK3kwVKbldl%2Fuploads%2Fgit-blob-c2f327481766dc8a98f7c8d536f52bd1d7fa4bbe%2Fpm-monitoramento-itens-fabric-filtro-por-tipo-en.png?alt=media" alt="Table filtered by the DataPipeline type"></picture><figcaption><p>"DataPipeline" type filter</p></figcaption></figure>

**How to use:** click the desired type; combine it with a state filter if you want (for example, **DataPipeline** + **Unhealthy**). **All** removes the type filter.

**How it works:** **Dataflow** corresponds to Dataflows Gen2. Dataflows Gen1 are Power BI artifacts and do not appear on this screen.

### Search by name

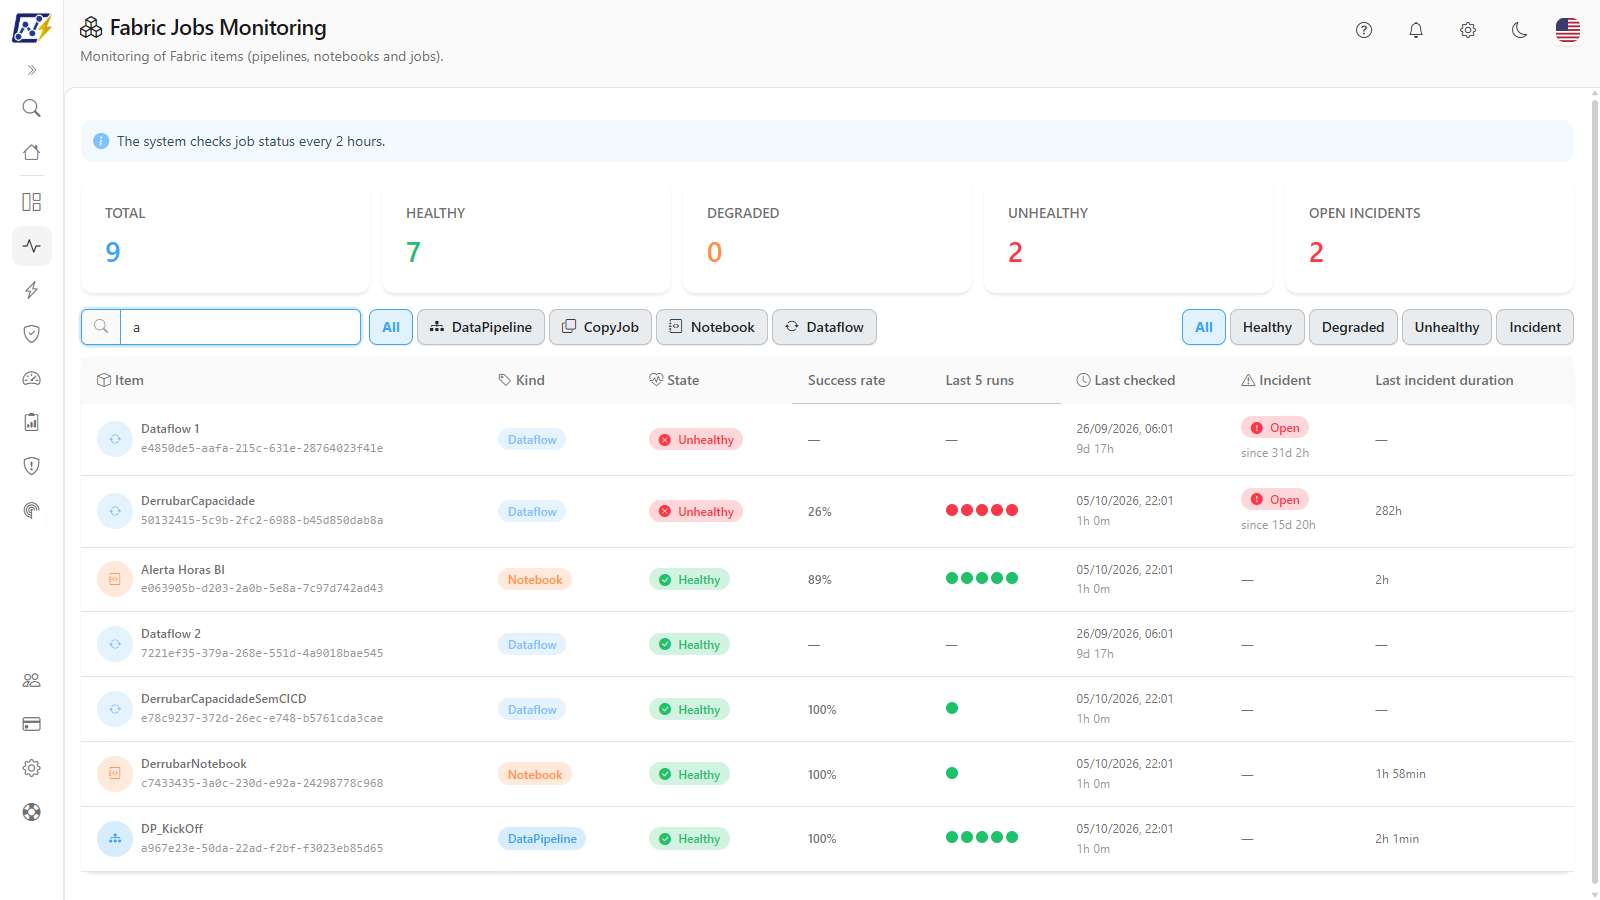
**What it is:** the **Search by name...** field.

**What it is for:** finding a specific item among many.

<figure><picture><source srcset="/files/5eCSjs7BebMb3perHosy" media="(prefers-color-scheme: dark)"><img src="https://3938213054-files.gitbook.io/~/files/v0/b/gitbook-x-prod.appspot.com/o/spaces%2FH2bFRBmIfyK3kwVKbldl%2Fuploads%2Fgit-blob-c7f47366a1be5e7773b83705fb6fc903082cfeba%2Fpm-monitoramento-itens-fabric-pesquisa-por-nome-en.png?alt=media" alt="Search field filled in and the filtered table"></picture><figcaption><p>Search by name</p></figcaption></figure>

**How to use:**

1. Type part of the item name in the **Search by name...** field.
2. The list is filtered as you type.
3. To return to the full list, clear the text and click **All** in the type and state filters.

**How it works:** the search is case-insensitive and looks for the text in the item name and also in the type (typing "notebook", for example, returns all notebooks).

### Items table

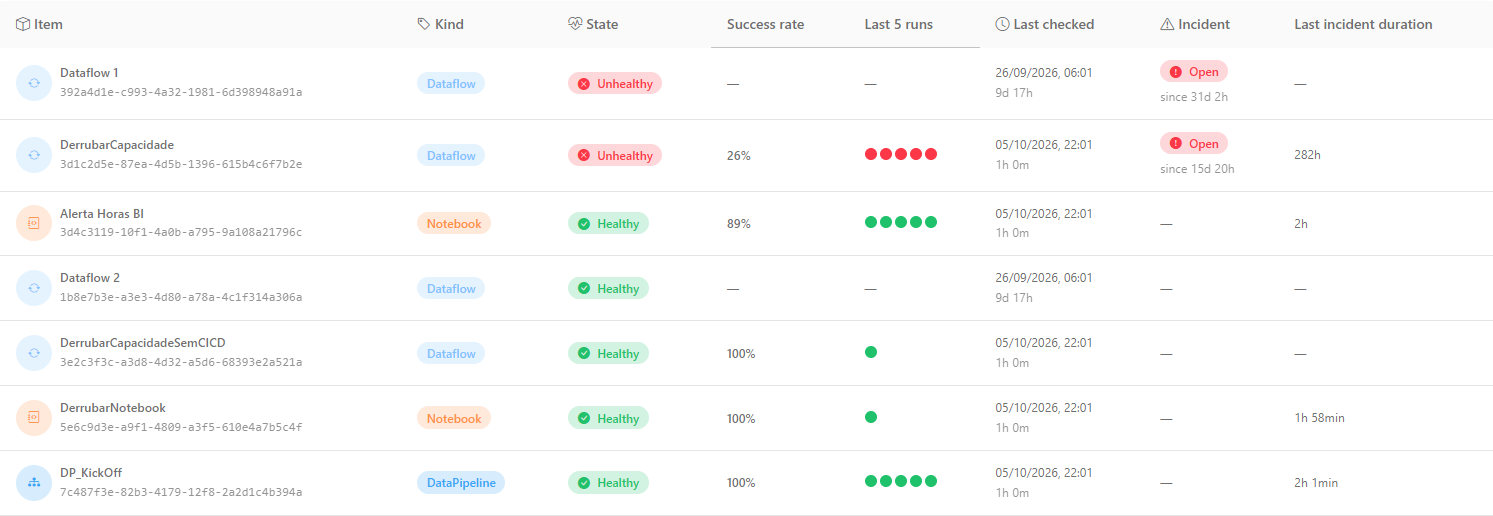
**What it is:** the list of monitored items, with the state of the last run, the success rate, the last runs, and the incidents.

**What it is for:** seeing, item by item, what ran well, what failed, how often it fails, since when an incident has been open, and how long the last problem lasted.

<figure><picture><source srcset="/files/0SAu3MZXyzuHLPy4bfSO" media="(prefers-color-scheme: dark)"><img src="https://3938213054-files.gitbook.io/~/files/v0/b/gitbook-x-prod.appspot.com/o/spaces%2FH2bFRBmIfyK3kwVKbldl%2Fuploads%2Fgit-blob-e3736d907e260e2eed2f3dff960a5b5689b19e42%2Fpm-monitoramento-itens-fabric-tabela-execucoes-en.png?alt=media" alt="Items table with the Item, Kind, State, Success rate, Last 5 runs, Last checked, Incident, and Last incident duration columns"></picture><figcaption><p>Fabric items table</p></figcaption></figure>

| Column                     | What it shows                                                                                                                                                                                                                                                                                                                                                                                                                    |
| -------------------------- | -------------------------------------------------------------------------------------------------------------------------------------------------------------------------------------------------------------------------------------------------------------------------------------------------------------------------------------------------------------------------------------------------------------------------------- |
| **Item**                   | Item name and its ID in Fabric.                                                                                                                                                                                                                                                                                                                                                                                                  |
| **Kind**                   | DataPipeline, CopyJob, Notebook, or Dataflow.                                                                                                                                                                                                                                                                                                                                                                                    |
| **State**                  | A chip with **Healthy**, **Degraded**, **Unhealthy**, or **Unknown**. On **Unhealthy** items, hover over the chip to see the [failure reason](#unhealthy-chip-and-failure-reason); on **Degraded** items, to see the [degradation explanation](#degraded-chip-and-degradation-explanation). The original status returned by Fabric (for example, Completed, Failed, or InProgress) appears in the [item details](#item-details). |
| **Success rate**           | Percentage of runs completed successfully in the last 30 days (only runs that have already finished are counted). Hover over the value to see the total number of runs. With no runs in the period, it shows a dash.                                                                                                                                                                                                             |
| **Last 5 runs**            | A sequence of squares, from the oldest to the most recent: green for success, red for failure, gray for skipped, and blue for in progress. Each square has a tooltip with the result and the date.                                                                                                                                                                                                                               |
| **Last checked**           | Date and time of the last reading made by Power Monitor and how long ago it occurred.                                                                                                                                                                                                                                                                                                                                            |
| **Incident**               | **Open** badge when there is an ongoing incident, with the time since it started ("since 3 hours ago"). With no incident, it shows "—".                                                                                                                                                                                                                                                                                          |
| **Last incident duration** | How long the last closed incident lasted (from the failure to the recovery). With no closed incident, it shows "—".                                                                                                                                                                                                                                                                                                              |

**How to use:**

1. Find the item (use the search if needed).
2. If there is an ongoing incident, the **Incident** column shows the **Open** badge and how long ago it started.
3. If the incident has already ended, the **Last incident duration** column shows how long the item was failing until it recovered.
4. For **Degraded** items, open the item details to check the **Status returned by Fabric** (for example, InProgress or NotStarted) and, in **Last checked**, when the item was read. If the run finishes successfully, the item returns to **Healthy** on the next check.
5. Click a row to open the [item details](#item-details), or right-click it to open the [actions menu](#right-click-menu-open-details-and-investigate).

**How it works:** items with an open incident appear first, followed by unhealthy items, degraded items, and finally the others (in alphabetical order within each group). For the list of occurrences and recurrences, use the [Alerts](/en/power-monitor/monitoramento/alertas.md) screen.

### "Unhealthy" chip and failure reason

**What it is:** on items with the **Unhealthy** state, the state chip reacts to the mouse (or to keyboard focus) and opens a panel with the **Failure reason reported by Fabric**, taken from the last run that failed.

**What it is for:** knowing why the item failed without leaving the list.

<figure><picture><source srcset="/files/GEkckZ9JMhAfzs6sv4Rk" media="(prefers-color-scheme: dark)"><img src="https://3938213054-files.gitbook.io/~/files/v0/b/gitbook-x-prod.appspot.com/o/spaces%2FH2bFRBmIfyK3kwVKbldl%2Fuploads%2Fgit-blob-f0c540157aa2e77bd8c452c6df7535f9cebc8f9d%2Fpm-monitoramento-itens-fabric-motivo-falha-en.png?alt=media" alt="Panel over the Unhealthy chip with the error category, the explanation, and the original Fabric message"></picture><figcaption><p>Failure reason when hovering over the "Unhealthy" chip</p></figcaption></figure>

**How to use:** hover over the **Unhealthy** chip. When the text is recognized, the panel shows an **error category** with a short explanation (for example, *Time limit exceeded*, *Authentication failure*, *Insufficient permission*, *Connection failure*, *Not enough memory*, *Capacity or request limit*, *Run cancelled*, *Resource not found*, or *Service Principal refresh not allowed*) and, right below, the **Original message** returned by Fabric. If Fabric did not report the reason, the panel says *Fabric did not report the reason for this run.*

**How it works:** the reason is fetched on demand, once per item. If the lookup fails, the panel shows *Could not load this failure's dossier.* and tries again on the next hover.

### "Degraded" chip and degradation explanation

**What it is:** on items in the **Degraded** state, the state chip reacts to the mouse (or keyboard focus) and opens a panel explaining the degradation. **Degraded means that the item's last run is in progress, queued, or was skipped as a duplicate; it does not necessarily mean it is slow.**

**What it is for:** understanding right away why the item is Degraded and whether the run in progress is within normal, without opening the details.

The panel shows a sentence explaining the case:

| Situation                                               | Text shown                                                                |
| ------------------------------------------------------- | ------------------------------------------------------------------------- |
| Run in progress                                         | *Run in progress*                                                         |
| Run that has not started yet                            | *Run not started yet (queued)*                                            |
| Run skipped because another one was already in progress | *Run skipped because another one was already in progress (duplicate)*     |
| Any other intermediate status                           | *Run in an intermediate state:* followed by the status reported by Fabric |

and three lines of numbers:

| Line                   | What it shows                                                                                                 |
| ---------------------- | ------------------------------------------------------------------------------------------------------------- |
| **Current duration**   | How long ago the run started, calculated at the moment the panel opens; *not started* when it is still queued |
| **Average time (30d)** | Average of the durations over the last 30 days, with the number of runs used (or *no history*)                |
| **Average time (7d)**  | The same for the last 7 days                                                                                  |

When there are at least **3 runs** in the 7-day window and the run is already in progress, the panel adds the comparison: *X% above the average (7d)*, *X% below the average (7d)* or *At the average (7d)*. With fewer than 3 runs the comparison is not shown, because the average would not be representative.

**How to use:** hover over the **Degraded** chip (or focus it with the keyboard). On touch screens, tap the row: the same content is in the **Run in progress** section of the [details modal](#item-details).

**How it works:** the averages consider **finished runs with start and end recorded**, of any final status (success, failure, or cancellation), with the window counted by the run's **start date**. It is the same rule as the [Average Execution Time](/en/power-monitor/performance/tempo-medio-de-execucao.md) screen.

### Item details

**What it is:** the **Item details** modal, opened by clicking a row (or **Open details** in the right-click menu). It is read-only.

**What it is for:** seeing all the data of an item in one place, including the original Fabric status and the run history.

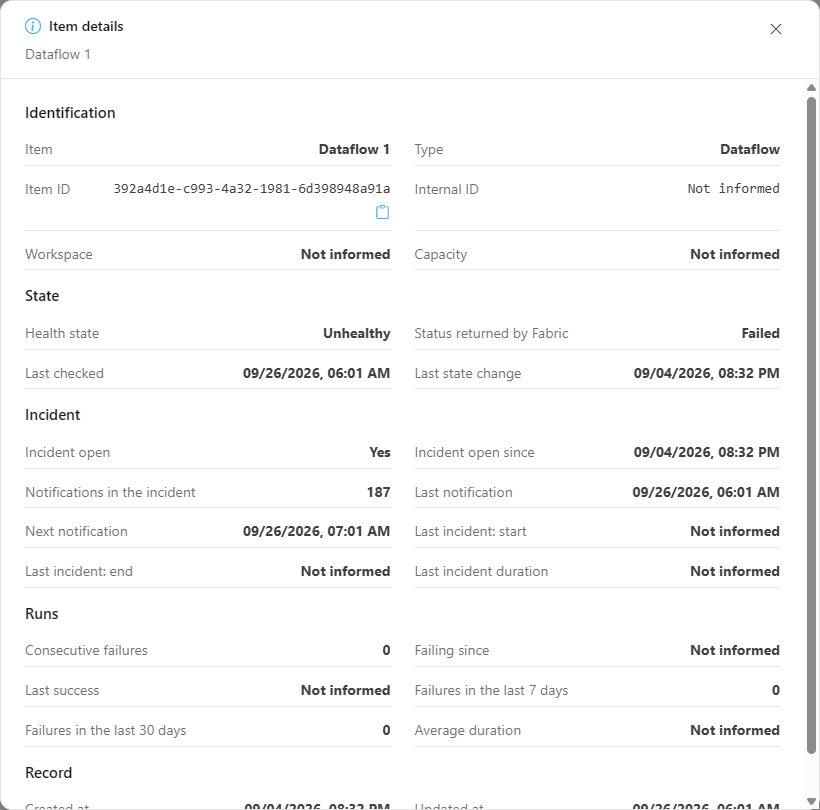
<figure><picture><source srcset="/files/kzHOf09y5ChHGPfEh092" media="(prefers-color-scheme: dark)"><img src="https://3938213054-files.gitbook.io/~/files/v0/b/gitbook-x-prod.appspot.com/o/spaces%2FH2bFRBmIfyK3kwVKbldl%2Fuploads%2Fgit-blob-983cf705a00f282256f35924bf06ede0cc8625b4%2Fpm-monitoramento-itens-fabric-detalhes-en.png?alt=media" alt="Item details modal with the Identification, State, Incident, Runs, and Record sections"></picture><figcaption><p>"Item details" modal</p></figcaption></figure>

| Section             | What it shows                                                                                                                                                                                                                                                                                                                                                                                   |
| ------------------- | ----------------------------------------------------------------------------------------------------------------------------------------------------------------------------------------------------------------------------------------------------------------------------------------------------------------------------------------------------------------------------------------------- |
| **Identification**  | **Item**, **Type**, **Item ID** (with a copy button), **Internal ID**, **Workspace**, and **Capacity**.                                                                                                                                                                                                                                                                                         |
| **State**           | **Health state**, **Status returned by Fabric**, **Last checked**, and **Last state change**.                                                                                                                                                                                                                                                                                                   |
| **Run in progress** | Only on **Degraded** items: the same explanation, **Current duration**, **Average time (30d)** and **Average time (7d)** from the chip panel (see [Degraded chip](#degraded-chip-and-degradation-explanation)).                                                                                                                                                                                 |
| **Incident**        | **Incident open** (Yes/No), **Incident open since**, **Notifications in the incident**, **Last notification**, **Next notification**, and the data of the last incident (start, end, and duration).                                                                                                                                                                                             |
| **Runs**            | **Consecutive failures**, **Failing since**, **Last success**, **Failures in the last 7 days**, **Failures in the last 30 days**, and **Average duration**; the **Last failed run** (error explanation, **Original message**, **Trigger**, **Failure duration**, **Start**, **End**, and **Run ID**); and the **Recent runs** table, with **Start**, **Result**, **Trigger**, and **Duration**. |
| **Record**          | **Created at** and **Updated at**.                                                                                                                                                                                                                                                                                                                                                              |

The **Runs** section is loaded separately; if it fails, the rest of the modal stays visible and there is a **Retry** button.

### Right-click menu: Open details and Investigate

**What it is:** right-click a row to open a menu with **Open details** (for any item) and **Investigate** (only for items with a problem: a state other than **Healthy** or an open incident).

**What it is for:** going straight to the details or requesting an AI analysis of the failure.

Prerequisite for **Investigate**: the AI feature must be configured (see [Settings › AI](/en/power-monitor/configuracoes/ia.md)) and the monthly AI spending limit must not have been reached. Otherwise, the item stays visible but disabled, and the tooltip explains why.

<figure><picture><source srcset="/files/kBhSHfpteuB0LUpFicJ4" media="(prefers-color-scheme: dark)"><img src="https://3938213054-files.gitbook.io/~/files/v0/b/gitbook-x-prod.appspot.com/o/spaces%2FH2bFRBmIfyK3kwVKbldl%2Fuploads%2Fgit-blob-14254677064cd3ae2460c8054472764cb98084bf%2Fpm-monitoramento-itens-fabric-menu-acoes-en.png?alt=media" alt="Right-click menu over an item with a failure, with the Investigate and Open details options"></picture><figcaption><p>Right-click menu of an item with a failure</p></figcaption></figure>

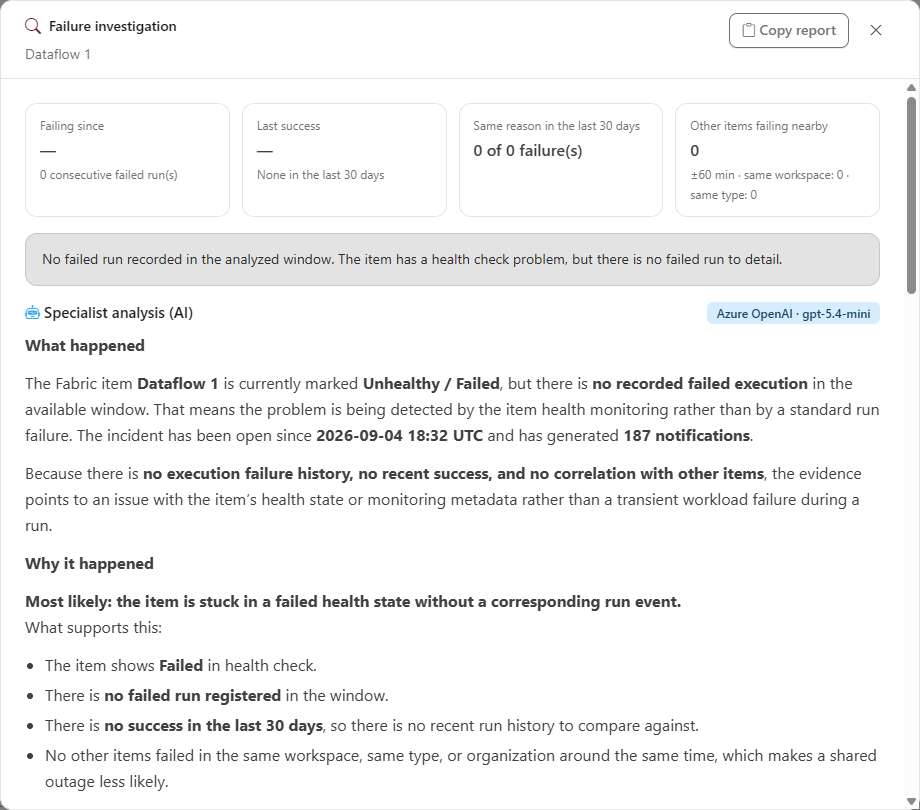
<figure><picture><source srcset="/files/JwdafTr90AcqxIY1jzqq" media="(prefers-color-scheme: dark)"><img src="https://3938213054-files.gitbook.io/~/files/v0/b/gitbook-x-prod.appspot.com/o/spaces%2FH2bFRBmIfyK3kwVKbldl%2Fuploads%2Fgit-blob-0d0a0417c16cfe3cc2bd8ae28f7756ffe9b4cf1e%2Fpm-monitoramento-itens-fabric-investigar-en.png?alt=media" alt="Failure investigation modal of a Fabric item with the summary, the failure reason, the latest runs, and the AI analysis"></picture><figcaption><p>"Failure investigation" modal</p></figcaption></figure>

**How to use:**

1. Right-click an item with a problem and choose **Investigate**.
2. In the **Failure investigation** modal, read the summary: how many consecutive runs failed, how many of the failures had the same reason in the last 30 days, and how many **Other items failing nearby** there are (±60 min window), showing how many of them are in the same workspace and how many are of the same type.
3. Read the **Failure reason reported by Fabric**, the list of the latest runs, and the AI analysis. Use **Copy report** to take the dossier to a support case or to a conversation with your team.

**How it works:** the AI analysis is generated automatically when the modal opens, from the collected reason and history, and counts against the organization's monthly AI spending limit. Validate the suggestions before applying changes.

### Pagination

**What it is:** the table footer, with the text *Showing X–Y of Z items* and the page buttons.

**What it is for:** navigating the list when there are more than 10 items.

**How to use:** use the **Previous** (‹) and **Next** (›) buttons or click the page number.

**How it works:** the table shows 10 items per page. The footer only appears when there is more than one page, and the count considers the search and the filters applied.

### Turn Fabric item monitoring on or off

**What it is:** the toggle that enables the collection of Fabric jobs, in *Settings › Monitoring*.

**What it is for:** enabling the tracking that feeds this screen (and the Fabric jobs in [Artifact Refreshes](/en/power-monitor/dashboards/atualizacoes-de-artefatos.md)), or suspending it.

Prerequisite: **Administrator** profile.

**How to use:**

1. Go to *Settings › Monitoring*.
2. In the **Resource Monitoring** card, turn **Fabric Jobs (DataPipeline / CopyJob / Notebook)** on or off. The message *Monitoring enabled successfully.* (or *disabled*) confirms the change.
3. If the card shows **No Fabric Items found** (the toggle does not appear), run a full collection in [Mapping › Inventory › Inventory](/en/power-monitor/mapeamento/inventarios.md) and return to the card.

## Rules and behavior

### How the state is defined

The state of each item reflects the status of the **most recent run** read from Fabric:

| Run status in Fabric                                              | State in Power Monitor |
| ----------------------------------------------------------------- | ---------------------- |
| Succeeded / Completed                                             | **Healthy**            |
| Failed / Cancelled                                                | **Unhealthy**          |
| InProgress / NotStarted / Deduped and other intermediate statuses | **Degraded**           |
| No status                                                         | **Unknown**            |

Whenever an item leaves the **Healthy** state (moves to **Unhealthy**, **Degraded**, or **Unknown**), an incident is opened and recorded on the [Alerts](/en/power-monitor/monitoramento/alertas.md) screen (type **Fabric Item**), with the status read and, when present, the error code and message returned by Fabric. When a subsequent run completes successfully, the incident is **resolved** and its duration starts appearing in the **Last incident duration** column.

{% hint style="warning" %}
Because the reading considers the most recent run, an item that was **in progress** at the time of the check appears as **Degraded** and also opens an incident, which is resolved on the next check if the run finishes successfully.
{% endhint %}

### Prerequisites

* **Monitoring enabled:** the administrator must enable **Fabric Jobs (DataPipeline / CopyJob / Notebook)** in *Settings › Monitoring*, in the **Resource Monitoring** section.
* **Items already inventoried:** monitoring only sees items that have already been collected by the inventory collection (the full collection runs automatically at setup and then daily).
* **Access to workspaces:** data can only be captured from workspaces that Power Monitor has direct access to. Items in workspaces marked as not monitored are also left out.
* **Dataflows:** only **Dataflows Gen2** are tracked here. Dataflows Gen1 are Power BI artifacts and have no runs recorded in Fabric.

### Notifications

Opening an incident triggers the **Fabric Item Failed** notification, and recovery triggers **Alert Resolved**. While the item keeps failing, the recurrences are counted on the Alerts screen, without new emails. An administrator can limit these notifications by workspace or item criticality, by item type, and by specific items, and turn on the email notice to the item's creator, in [Settings › Notifications](/en/power-monitor/configuracoes/notificacoes.md). See the details of channels and recipients in [Alerts](/en/power-monitor/monitoramento/alertas.md#notifications).

{% hint style="info" %}
This screen shows the **current state** of each item. To find out whether a run is taking longer than usual, use the [Average Execution Time](/en/power-monitor/performance/tempo-medio-de-execucao.md) screen.
{% endhint %}

## Frequently asked questions

<details>

<summary>A pipeline ended with an error, but the screen still shows "Healthy". Why?</summary>

Fabric items are checked every 2 hours. A run that failed after the last check will only be reflected on the next reading. Check the **Last checked** column to see when the item was last read.

</details>

<details>

<summary>An item that exists in Fabric does not appear in the list.</summary>

Check whether Fabric Jobs monitoring is enabled in *Settings › Monitoring*, whether the item has already been collected by the inventory collection, whether the workspace is marked as monitored, and whether Power Monitor has access to it. Dataflows Gen1 do not appear on this screen.

</details>

<details>

<summary>What does the "Degraded" state mean?</summary>

That the most recent run had not finished yet at the time of the check (for example, it was in progress, queued, or skipped as a duplicate) or returned an intermediate status. It does not mean the run is slow or, by itself, that it failed. Hover over the chip to see the current duration and the 30-day and 7-day averages: if it completes successfully, the item returns to **Healthy** on the next check and the open incident is resolved.

</details>

<details>

<summary>Does the "Unhealthy" state show the cause of the problem?</summary>

The state indicates that the last run failed or was cancelled. To see the cause, hover over the **Unhealthy** chip (it shows the reason reported by Fabric) or use **Investigate**. The error message is also recorded in [Alerts](/en/power-monitor/monitoramento/alertas.md), and the full run history is in Fabric itself.

</details>

## Related pages

* [Monitoring overview](/en/power-monitor/monitoramento.md)
* [Alerts](/en/power-monitor/monitoramento/alertas.md)
* [Spark Sessions](/en/power-monitor/monitoramento/sessoes-spark.md)
* [Average Execution Time](/en/power-monitor/performance/tempo-medio-de-execucao.md)
* [Artifact Refreshes](/en/power-monitor/dashboards/atualizacoes-de-artefatos.md)
* [Governance › Data and Engineering › Data Engineering](/en/power-monitor/governanca/dados-e-engenharia/engenharia-de-dados.md)
* [Settings](/en/power-monitor/configuracoes.md)


---

# Agent Instructions
This documentation is published with GitBook. GitBook is the documentation platform designed so that both humans and AI agents can read, navigate, and reason over technical content effectively. Learn more at gitbook.com.

## Querying This Documentation
If you need additional information that is not directly available in this page, you can query the documentation by asking a question.

Perform an HTTP GET request on the following URL with the `ask` and `goal` query parameters:

```
GET https://docs.powermonitor.com.br/en/power-monitor/monitoramento/itens-do-microsoft-fabric.md?ask=<question>&goal=<user_goal>
```

`ask` is the immediate question: it should be specific, self-contained, and written in natural language.
`goal` is what the user is ultimately trying to achieve, the reason they need the answer. Sharing it helps GitBook give you a better, more relevant answer. A goal is most helpful when it describes the outcome the user wants rather than restating the question. For example, with `ask=how do I create an API token`, a goal like `automate deployments from our CI pipeline` lets GitBook tailor the answer to that use case.

The response will contain a direct answer to the question and relevant excerpts and sources from the documentation.

Use this mechanism when the answer is not explicitly present in the current page, you need clarification or additional context, or you want to retrieve related documentation sections.