> For the complete documentation index, see [llms.txt](https://docs.powermonitor.com.br/llms.txt). Markdown versions of documentation pages are available by appending `.md` to page URLs; this page is available as [Markdown](https://docs.powermonitor.com.br/en/power-monitor/monitoramento/metricas-de-consumo.md).
# Consumption Metrics
View, day by day, each operation recorded by the Capacity Metrics App, with Capacity Units, duration, user, usage type, and status.
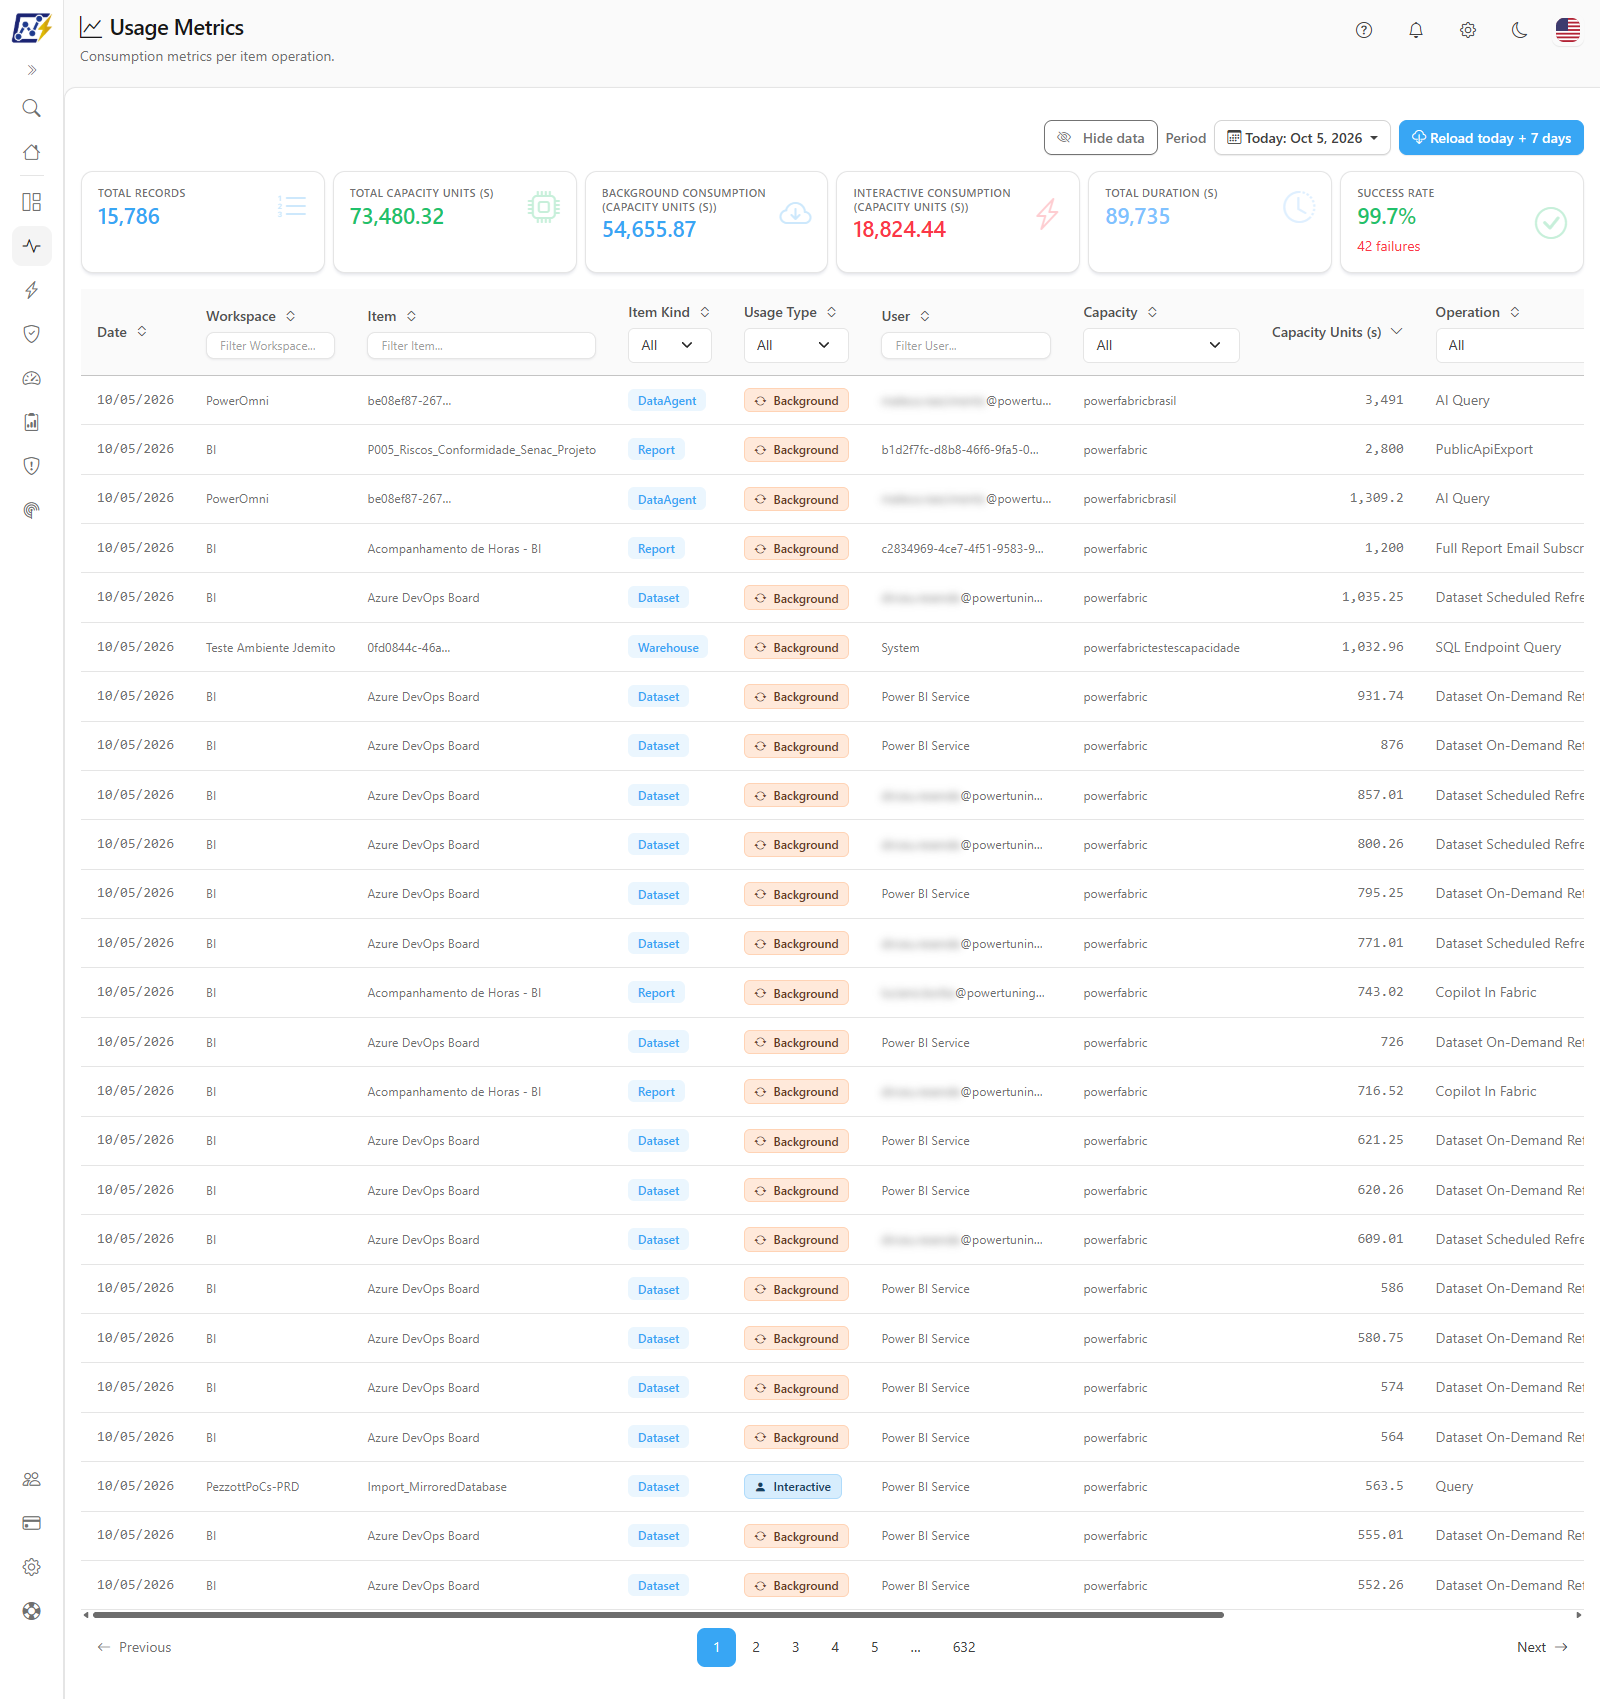
The **Consumption Metrics** screen (page title: **Usage Metrics**) is the most detailed level of the consumption screens. For the chosen period (by default, today), it lists the operations executed against Fabric / Power BI items (queries, refreshes, pipeline and notebook runs, etc.) with the consumption in Capacity Units (s), the duration, the user, the capacity, and the status of each one.
**How to access:**
* *Monitoring › Consumption Metrics*; or
* *Capacities › Consumption Metrics* (same screen; see [Capacities (menu)](/en/power-monitor/capacidades.md)).
The query is available to **all profiles** and respects the user's workspace scope. The data reload button is restricted to **Administrators**: for other profiles, it does not appear. The **Hide data** button (see [Hide data](#hide-data)) is available to everyone. If an administrator blocks this page for your user, it no longer appears in the menu.
Consumption Metrics (Usage Metrics)
## What it is for
* **Answer "which operation, from which user, consumed so much?"**: sort by Capacity Units (s) and filter by item, user, or operation.
* **Investigate failures:** filter **Status** by *Failed* to see what did not complete on the day.
* **Separate Interactive from Background:** use the **Usage Type** filter to focus on user queries or on automated routines.
* **Recover days with gaps** (administrators): reload today and the previous 7 days directly from the Capacity Metrics App.
## Features
### Period
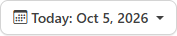
**What it is:** the **Period** menu, in the upper-right corner of the screen, which defines the range queried. It offers **Today** (default), **Yesterday**, **Last 7 days**, **Last 14 days**, **Last 30 days**, **Last 60 days**, **Last 90 days**, **Last 180 days**, and **Custom**. The menu button shows the chosen option and the dates it covers. Next to it are the **Hide data** button and, for administrators, the reload button.
**What it is for:** analyzing the operations of a specific day, for example the day the capacity was slow or a refresh failed, or looking at several days at once to see recurrence.
Period menu and reload button
**How to use:**
1. Go to *Monitoring › Consumption Metrics*. The screen opens with today's date.
2. In the **Period** menu, choose another option. For a specific range, choose **Custom** and fill in the **From** and **To** fields (the range can be up to 366 days and future dates are not accepted).
3. The indicators and the table reload automatically. If there are no operations in the period, the table displays **No metrics found for this date.**
**How it works:** the days correspond to the organization's local day (the time zone configured in the Capacity Metrics App); **Today** is the organization's current day, and the *Last N days* options end today and include it. Changing the period returns to the first page, keeps the table filters, and clears any filter-list value that no longer exists in the new period (for example, a capacity with no operations in it).
### Period indicators (KPIs)
**What it is:** the row of six cards above the table, with the totals of the operations in the period and the applied filters.
**What it is for:** getting the period's summary (volume, consumption, interactive/background split, duration, and success rate) and following how these numbers change when you apply filters.
Period indicators
| KPI | What it shows |
| ------------------------------------------------ | --------------------------------------------------------------------------------------------------------------------------------------------- |
| **Total Records** | Number of operations listed. |
| **Total Capacity Units (s)** | Sum of the operations' consumption. |
| **Background Consumption (Capacity Units (s))** | Sum of the consumption of background operations. |
| **Interactive Consumption (Capacity Units (s))** | Sum of the consumption of interactive operations. |
| **Total Duration (s)** | Sum of the durations. |
| **Success Rate** | Percentage of operations with *Success* status among those that recorded a status. When there are failures, the card also shows *N failures*. |
**How to use:** read the cards after choosing the period. To see the totals of a slice (one capacity, one item, one user), apply the table filters: the cards are recalculated over the filtered rows, not over the entire period. The totals cover all rows that match the filters, not only the displayed page.
**How it works:** the color of the **Success Rate** indicates the health of the slice: green from 95%, yellow from 80% to 95%, and red below 80%. Operations with no recorded status are not included in the percentage calculation.
### Operations table
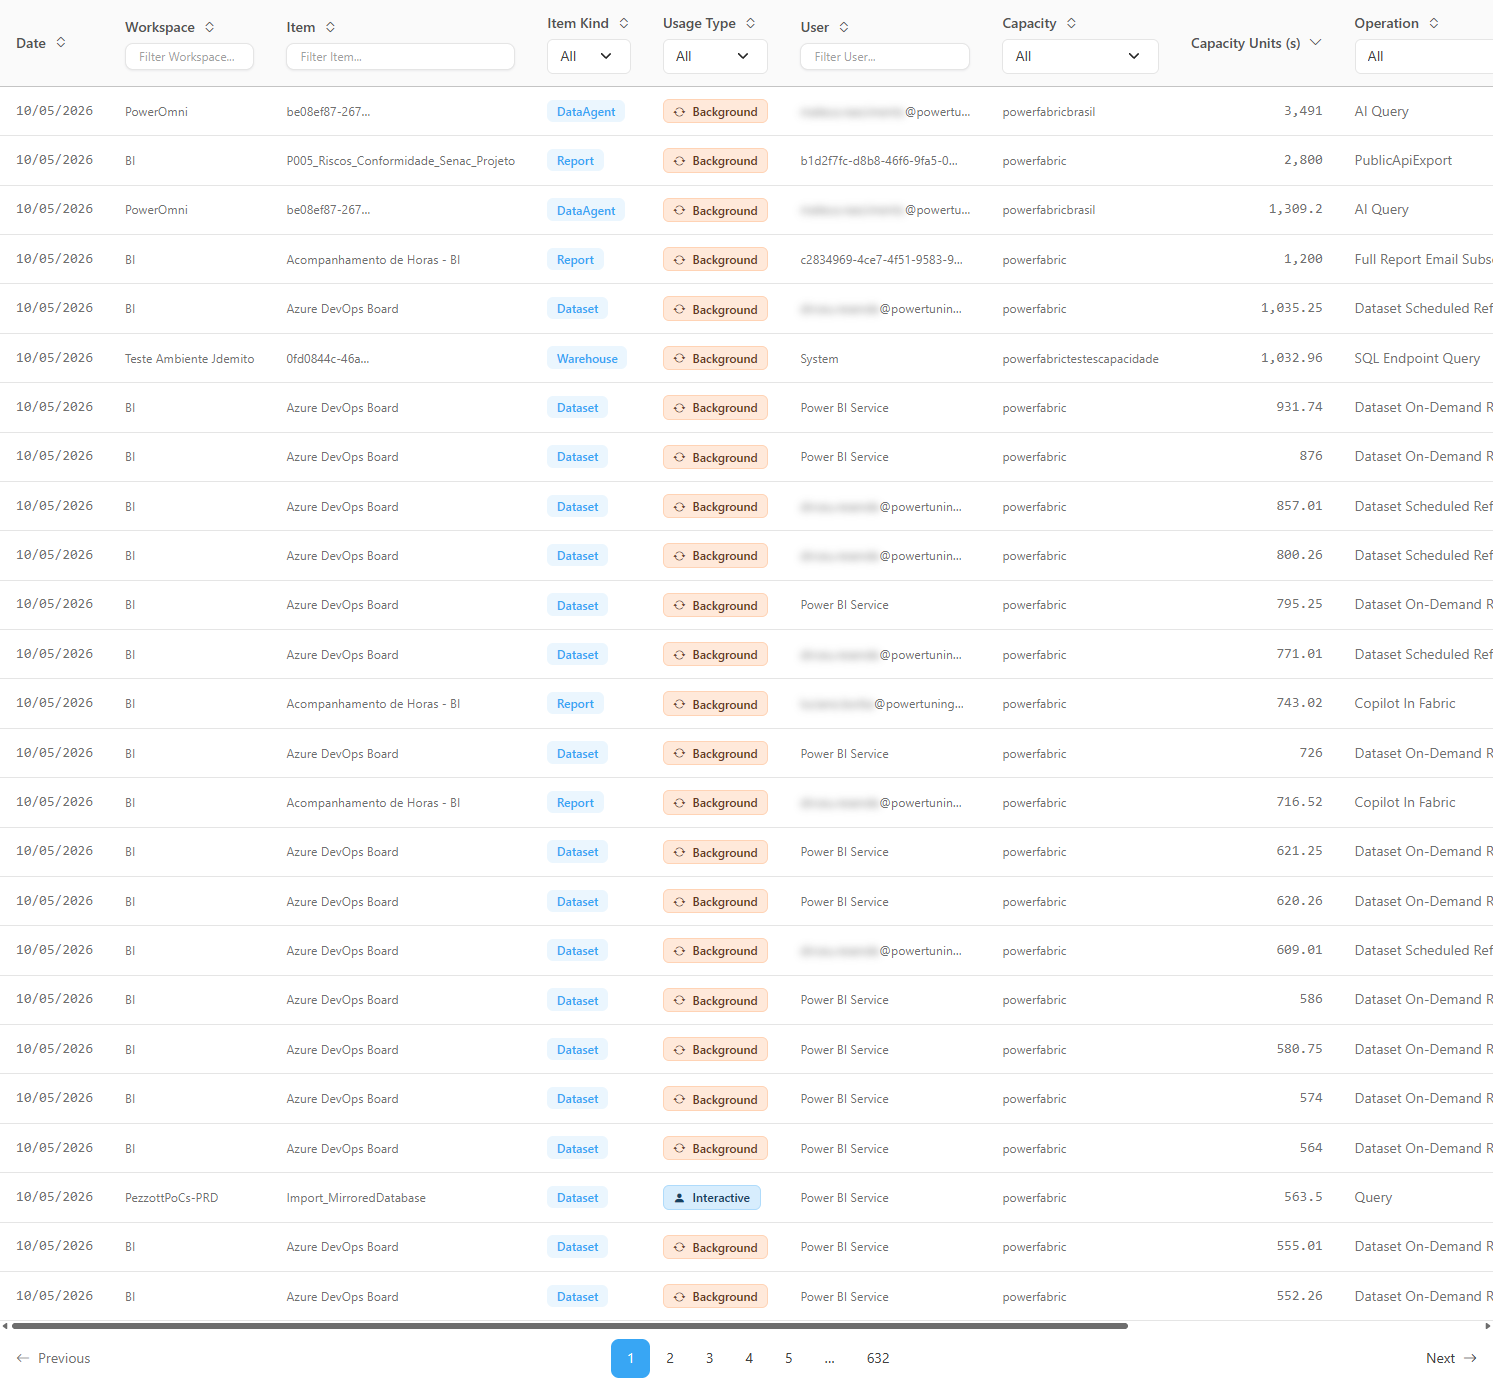
**What it is:** the list of the operations of the period, one per row. Each row groups one operation of one item on one day.
**What it is for:** identifying exactly which operation consumed, who executed it, on which capacity, when it started and ended, and whether it succeeded.
Operations table
| Column | Filter | Description |
| ---------------------- | ---------------------------- | --------------------------------------------------------------------------------------------------------------------------------------------------------------------------------------------- |
| **Date** | — | The organization's local day the row belongs to. It is the first column and helps when reading multi-day ranges. |
| **Workspace** | text (*Filter Workspace...*) | The item's workspace. Hover to see the workspace identifier. |
| **Item** | text (*Filter Item...*) | Item name. Hover to see the item identifier. |
| **Item Kind** | list | Artifact type (semantic model, report, notebook, pipeline, etc.). |
| **Usage Type** | list | **Interactive** (blue) or **Background** (yellow) badge. |
| **User** | text (*Filter User...*) | Identity that executed the operation, when reported (many background operations have no user). Long names appear abbreviated; hover to see the full value. Respects the **Hide data** button. |
| **Capacity** | list | Capacity where the operation ran. |
| **Capacity Units (s)** | — | Consumption of the operation. |
| **Operation** | list | Operation name reported by Microsoft (for example, *Query*, *Dataset On-Demand Refresh*). |
| **Start** / **End** | — | Start and end times, in your browser's time zone (HH:flag\_mm:ss). |
| **Duration (s)** | — | Duration of the operation. |
| **Status** | list | **Success** (green), **Failed** (red), or **In progress** (yellow) badge. |
**How to use:** go through the rows from the top (the table already opens with the operations that consumed the most) and use the filters and sorting described below to get to what matters.
**How it works:** when the workspace, the item, or the capacity has no known name, the cell shows the beginning of the identifier.
### Column filters
**What it is:** the fields right below the column titles: text boxes in **Workspace**, **Item**, and **User**, and lists in **Item Kind**, **Usage Type**, **Capacity**, **Operation**, and **Status** (each list starts at **All**).
**What it is for:** isolating a slice of the period, such as the failures, the operations of one capacity, the interactive queries, or everything a user executed.
Table filtered by failed operations
**How to use:**
* **Investigate the period's failures:** in the **Status** column filter, choose **Failed**. The table and the **Success Rate** KPI start reflecting only those operations; check **Item**, **Operation**, and **User**. To see the reason for refresh or Fabric item failures, see [Semantic Models](/en/power-monitor/monitoramento/modelos-semanticos.md), [Fabric Items](/en/power-monitor/monitoramento/itens-do-microsoft-fabric.md), or [Alerts](/en/power-monitor/monitoramento/alertas.md).
* **Separate interactive from background consumption:** in the **Usage Type** column filter, choose **Interactive** (users' use of reports) or **Background** (refreshes, pipelines, notebooks) and compare the **Background Consumption (Capacity Units (s))** and **Interactive Consumption (Capacity Units (s))** KPIs.
* **See what a user executed:** type part of the email in the **Filter User...** field and sort by **Start** to see the sequence of operations.
* **Restrict to a workspace, item, kind, capacity, or operation:** type in **Filter Workspace...** or **Filter Item...**, or choose a value in the **Item Kind**, **Capacity**, or **Operation** lists.
* **Clear a filter:** delete the text in the field or set the list back to **All**.
**How it works:**
* Filters are applied by the server and combine with one another: the lists take effect as soon as you choose an option, and the text fields wait for a short pause in typing (under half a second) before querying.
* **Filter Workspace...** and **Filter Item...** look for the text in the name and also in the identifier; **Filter User...** looks in the user's email.
* The **Item Kind**, **Capacity**, and **Operation** lists show only the values that exist in the operations of the chosen period.
* Filters are applied across the whole period, not only to the rows of the displayed page. The KPIs are recalculated over the result, and the table returns to the first page on every filter change.
* **Usage Type** offers *Interactive* and *Background*, and **Status** offers *Success*, *Failed*, and *In progress*.
### Sorting
**What it is:** sorting the table by the column titles.
**What it is for:** bringing to the top the most expensive, longest, or most recent operations, or grouping by workspace, user, or status.
**How to use:**
1. Click the title of any column (including **Date**). The first click sorts in ascending order.
2. Click the same column again to reverse the order.
3. The arrow next to the title indicates the column and the direction of the current sort.
**How it works:** the table opens sorted by the highest **Capacity Units (s)**. The **Date** column sorts by day, and the **Start** and **End** columns sort by the full time of the operation. Sorting is done by the server over all filtered rows, not only over the displayed page. Rows with no value in the sorted column always stay at the end.
### Pagination
**What it is:** the controls in the table footer.
**What it is for:** going through periods with many operations.
**How to use:** use **Previous**, **Next**, or click the number of the desired page. In the **Items per page** selector, choose **10**, **25**, **50**, or **100**.
**How it works:** the table shows **25 records per page** by default. Changing the period, the filters, the sort order, or the number per page returns to the first page. This screen has no export.
### Hide data
**What it is:** the **Hide data** button, next to the **Period** menu. Once turned on, it is renamed **Show data**.
**What it is for:** sharing the screen, taking a screenshot, or giving a demo without exposing users' email addresses.
**How to use:** click **Hide data**. In the **User** column, email addresses are shown masked. To see the values again, click **Show data**.
**How it works:** the button is the same one used on the other Power Monitor screens: your choice applies to all of them and is remembered in this browser. The mask is visual only, a convenience for sharing the screen, and does not replace access control.
### Reload today + 7 days (Administrators)
**What it is:** the **Reload today + 7 days** button, next to the **Period** filter, which fetches again from the Capacity Metrics App the operations of today and the previous 7 days (8 days in total, in the organization's time zone) and reimports them. Hover over the button to see the explanation.
**What it is for:** recovering recent days with gaps or that seem incomplete, without waiting for the next collection.
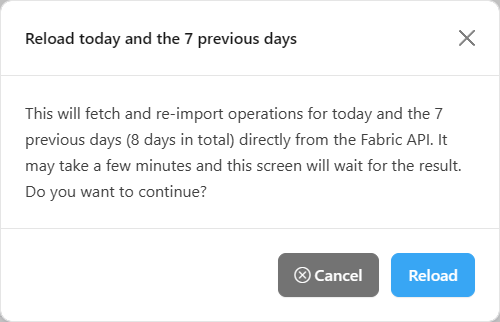
Reload confirmation
**How to use:** prerequisite: **Administrator** profile.
{% stepper %}
{% step %}
### Click Reload today + 7 days
The button is next to the **Period** filter.
{% endstep %}
{% step %}
### Confirm the reload
The **Reload today and the 7 previous days** modal explains that the operations of 8 days will be reimported and that the screen waits for the result. Click **Reload** (or **Cancel**).
{% endstep %}
{% step %}
### Wait with the screen open
While the reload runs, the button is disabled and the screen displays *"Fetching data from the Fabric API. This may take a few minutes, keep this screen open to see the result."*
{% endstep %}
{% step %}
### Read the result
A message summarizes *N of M days with data · X records imported* and the **Reload result** panel details what happened. The table for the selected day reloads automatically. Click **Close** to hide the panel.
{% endstep %}
{% endstepper %}
**How it works:**
* The **Reload result** panel shows how many days returned data and how many records were imported, the range of **Days attempted** and, when applicable, the **Days with no data or failures** list, with the reason for each day:
* **No data**: the Capacity Metrics App returned no operations. Usually the day is already outside the app's retention window and can no longer be recovered; this is not a Power Monitor failure.
* **Failed**: the import for that day failed, with the error message.
* Rows discarded because they belong to another local day are also reported.
* When all days return data, the panel shows *All 8 days returned data.* If no day returns data or any day fails, the summary message is displayed as an error.
* If the reload is not even executed, the **The reload was not executed** panel shows the reason. Users without the administrator profile receive *Permission denied. Only administrators can perform this action.*
* The operation can take a few minutes; keep the screen open to see the result.
## Rules and behavior
* **Data source:** the operations table of the Microsoft Fabric Capacity Metrics App, collected every 5 minutes while there is a monitored capacity. Each row corresponds to an operation recorded by the app.
* **Local day:** the chosen dates are the organization's local days (time zone from the app's *UTC\_offset* parameter). Start and end times are displayed in your browser's time zone.
* **High Capacity Units (s) on short operations** are normal when the operation uses many cores in parallel; it is consumption, not duration, that weighs on the capacity.
* **Retention:** Power Monitor keeps the history already collected; what the Capacity Metrics App has already discarded cannot be recovered by the reload.
* **Scope:** users with visibility restricted to some workspaces see only the operations of those workspaces.
## Frequently asked questions
The screen is empty for today.
Check whether there are capacities with monitoring enabled and whether the Metrics Source is validated (see [Enable Capacity Monitoring](/en/power-monitor/monitoramento/capacidades/ativar-monitoramento-de-capacidade.md)). The Capacity Metrics App publishes operations with some delay; wait a few collection cycles.
A whole day is missing or seems incomplete.
An administrator can use **Reload today + 7 days**. If the day is outside this range or outside the Capacity Metrics App retention, it can no longer be recovered.
Why do several operations have no user?
Background operations (scheduled refresh, pipelines, scheduled notebooks) are often executed by the service and arrive without a user identity.
The KPIs changed when I filtered the table. Is that right?
Yes. The cards add up only the rows that match the filters applied. To see the totals for the entire period, set all filters back to **All** and clear the text fields.
## Related pages
* [Consumption History](/en/power-monitor/monitoramento/historico-de-consumo.md)
* [Consumption Comparison](/en/power-monitor/monitoramento/comparativo-de-consumo.md)
* [Consumption Anomalies](/en/power-monitor/monitoramento/anomalias-de-consumo.md)
* [Capacities (Capacity Monitoring)](/en/power-monitor/monitoramento/capacidades.md)
* [Capacities (menu)](/en/power-monitor/capacidades.md)
---
# Agent Instructions
This documentation is published with GitBook. GitBook is the documentation platform designed so that both humans and AI agents can read, navigate, and reason over technical content effectively. Learn more at gitbook.com.
## Querying This Documentation
If you need additional information that is not directly available in this page, you can query the documentation by asking a question.
Perform an HTTP GET request on the following URL with the `ask` and `goal` query parameters:
```
GET https://docs.powermonitor.com.br/en/power-monitor/monitoramento/metricas-de-consumo.md?ask=&goal=
```
`ask` is the immediate question: it should be specific, self-contained, and written in natural language.
`goal` is what the user is ultimately trying to achieve, the reason they need the answer. Sharing it helps GitBook give you a better, more relevant answer. A goal is most helpful when it describes the outcome the user wants rather than restating the question. For example, with `ask=how do I create an API token`, a goal like `automate deployments from our CI pipeline` lets GitBook tailor the answer to that use case.
The response will contain a direct answer to the question and relevant excerpts and sources from the documentation.
Use this mechanism when the answer is not explicitly present in the current page, you need clarification or additional context, or you want to retrieve related documentation sections.