> For the complete documentation index, see [llms.txt](https://docs.powermonitor.com.br/llms.txt). Markdown versions of documentation pages are available by appending `.md` to page URLs; this page is available as [Markdown](https://docs.powermonitor.com.br/en/power-monitor/monitoramento/modelos-semanticos.md).

# Semantic Models

History of Power BI and Fabric semantic model refreshes, with the day's failures, translated error details, and a retry queue.

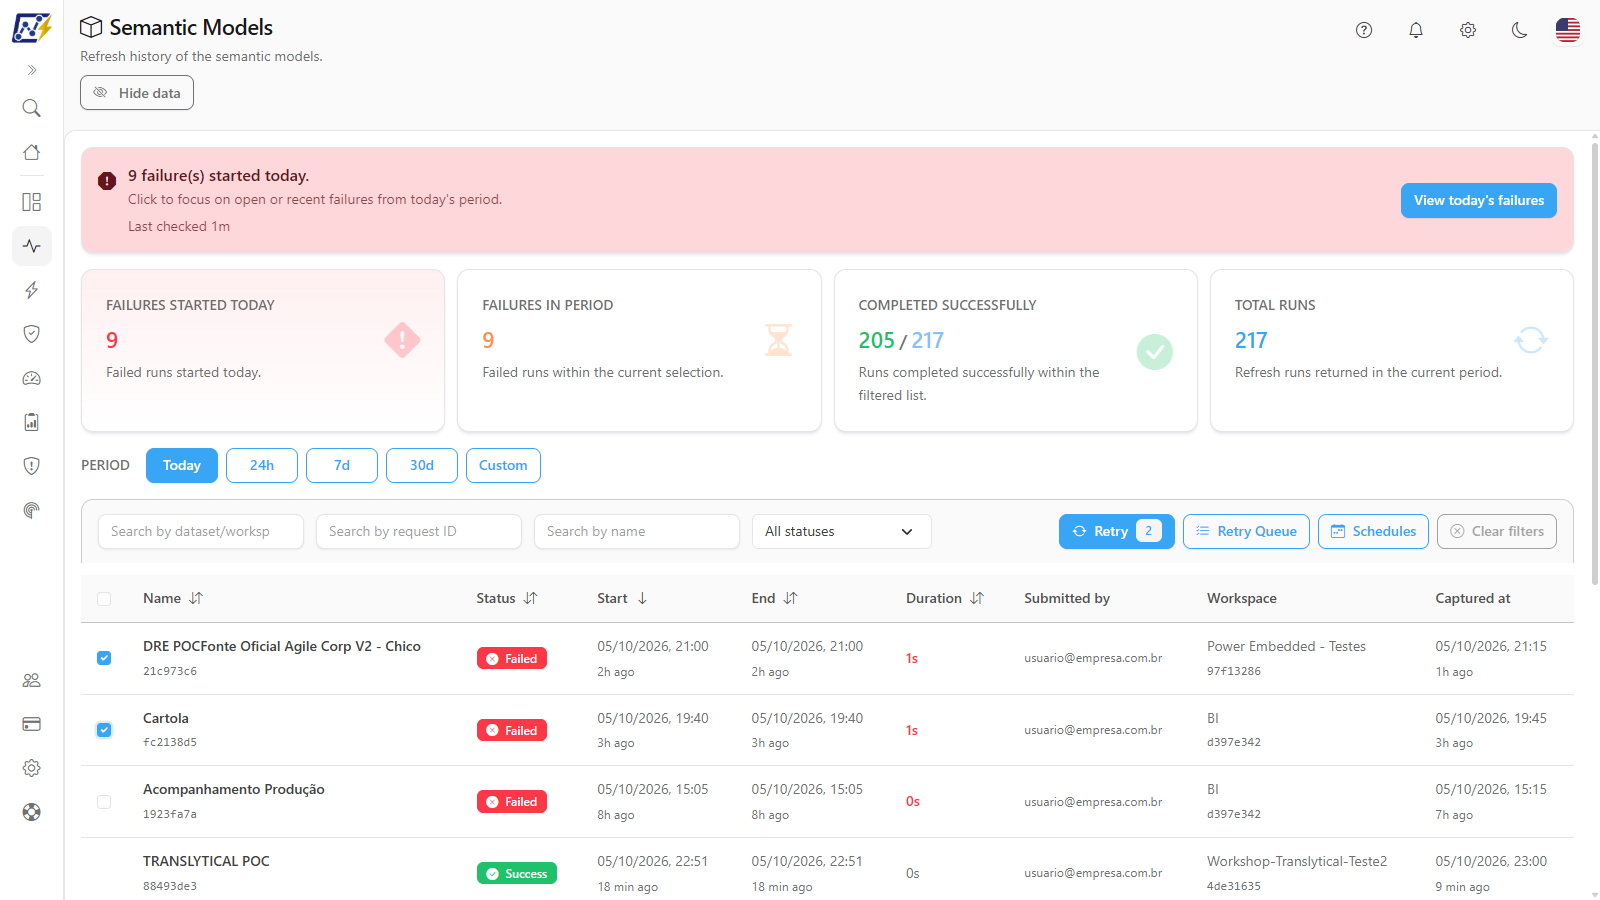
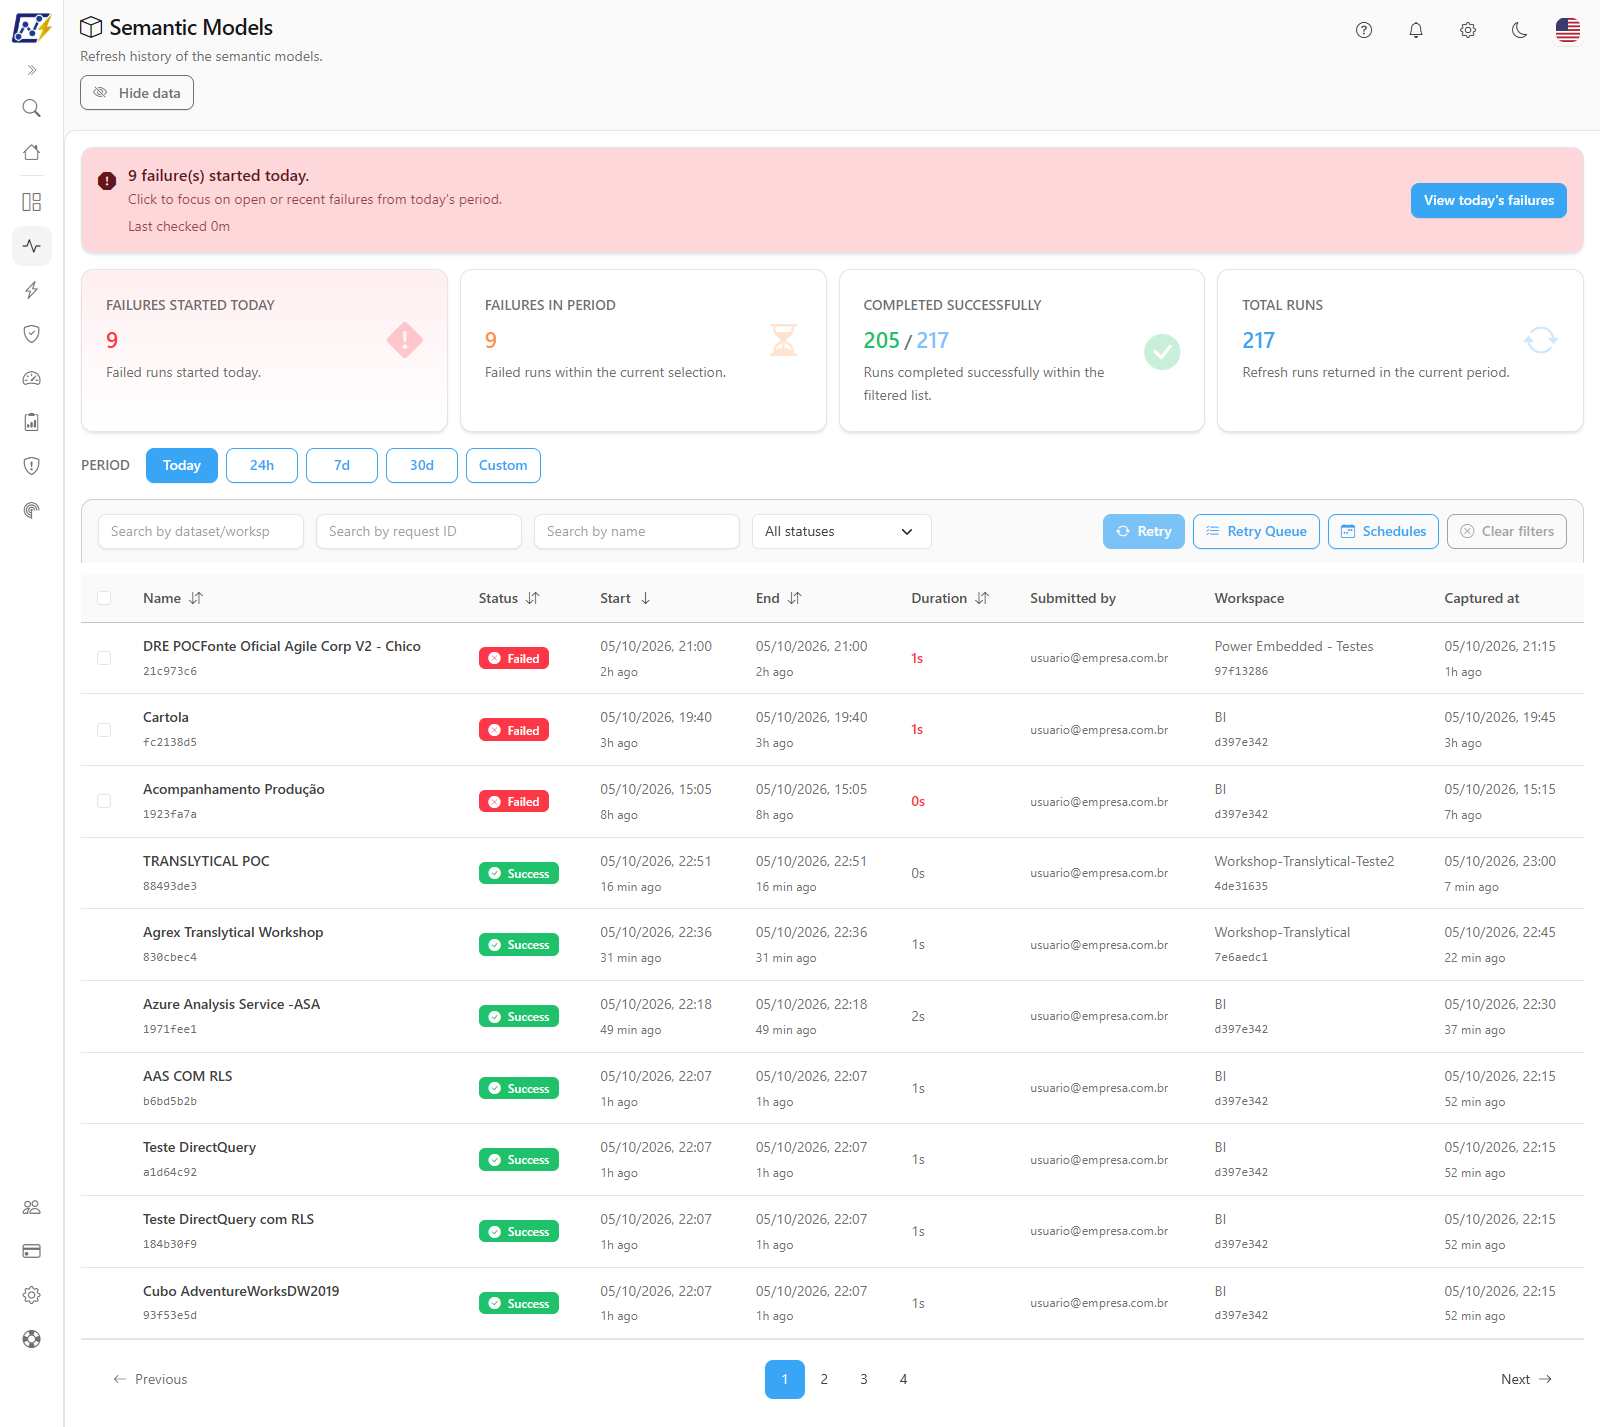
The **Semantic Models** screen tracks the data refreshes of the organization's semantic models: which ones completed, which ones failed, how long they took, which workspace they are in, and what error Power BI returned. When you hover over the **Failed** status you see the error and the recent history of the model, and with a right-click you can request an **AI investigation** of the failure. From the screen, administrators can also **resubmit for refresh** the models that failed.

**How to access:** *Monitoring › Semantic Models*. The screen is available to all user profiles, respecting each user's workspace scope (users with restricted visibility see only the models of their workspaces). The **Retry** action and cancelling items in the queue are restricted to **Administrators**.

<figure><picture><source srcset="/files/mQCgwETpZY9vACMVIqyG" media="(prefers-color-scheme: dark)"><img src="https://3938213054-files.gitbook.io/~/files/v0/b/gitbook-x-prod.appspot.com/o/spaces%2FH2bFRBmIfyK3kwVKbldl%2Fuploads%2Fgit-blob-06f4cde85335ab9a0028431beabbeb97173c114d%2Fpm-monitoramento-modelos-semanticos-visao-geral-en.png?alt=media" alt="Semantic Models screen with the day&#x27;s failures banner, the total cards, the filters, and the refreshes table"></picture><figcaption><p>Semantic Models screen</p></figcaption></figure>

## What it is for

* **Ensure reports have up-to-date data**: see, as soon as you open the screen, whether any refresh failed today.
* **Diagnose a failure**: find out whether the problem was an expired credential, an unreachable gateway, a timeout, or a capacity limit, with a plain-language explanation of the error code.
* **Reprocess in bulk**: select the models that failed and send them all at once for a new refresh attempt, without having to open each one in Power BI.
* **Follow an incident**: see how long a model has been failing and how many failures it had in the last few days.
* **Investigate the cause of a failure**: open a technical dossier with history, recurrence, other affected models, and an AI analysis, with the identifiers needed to open a Microsoft support case.

## Features

Filters are applied automatically: when you type in the search fields or choose a period or status, the table and the cards reload.

### Day status banner

**What it is.** A strip at the top of the screen that summarizes whether there were refresh failures started today, with the time of the last query.

**What it is for.** Answering, as soon as you open the screen, whether reports have up-to-date data today, and going straight to the failures with one click.

<figure><picture><source srcset="/files/XTh6ASoJYfc6P4oRCnif" media="(prefers-color-scheme: dark)"><img src="https://3938213054-files.gitbook.io/~/files/v0/b/gitbook-x-prod.appspot.com/o/spaces%2FH2bFRBmIfyK3kwVKbldl%2Fuploads%2Fgit-blob-d25f4271ed41b13ed8fe5bfc228c3542fd20e9d0%2Fpm-monitoramento-modelos-semanticos-banner-en.png?alt=media" alt="Day status banner with the number of failures started today and the View today&#x27;s failures button"></picture><figcaption><p>Day status banner</p></figcaption></figure>

**How to use**

1. Go to *Monitoring › Semantic Models* and read the banner.
2. If it is **green** (*No new failures started today.*), no failed refresh started today.
3. If it is **red** (*N failure(s) started today.*), click **View today's failures**. The table starts showing the **Today** period with the **Failed** status.

**How it works**

* The banner is calculated over the same runs loaded for the current period and filters.
* Below the message, the time of the **Last checked** query appears. The screen refreshes automatically every 5 minutes.

### Total cards

**What it is.** Four cards with the totals of refresh runs in the current slice: **Failures started today**, **Failures in period**, **Completed successfully**, and **Total Runs**.

**What it is for.** Measuring the health of refreshes in the chosen period: for example, the success rate over the last 7 days.

<figure><picture><source srcset="/files/kugkl1HzKznR2geD6wxm" media="(prefers-color-scheme: dark)"><img src="https://3938213054-files.gitbook.io/~/files/v0/b/gitbook-x-prod.appspot.com/o/spaces%2FH2bFRBmIfyK3kwVKbldl%2Fuploads%2Fgit-blob-bd6522923e873b84d1bef3cec12bc2f993f04acd%2Fpm-monitoramento-modelos-semanticos-cards-en.png?alt=media" alt="Failures started today, Failures in period, Completed successfully, and Total Runs cards"></picture><figcaption><p>Run total cards</p></figcaption></figure>

**How to use**

1. Choose the desired period and filters.
2. Read the cards according to the table below. In **Completed successfully**, the format is *successes / total runs*.

**How it works**

| Card                       | What it counts                                                                                    |
| -------------------------- | ------------------------------------------------------------------------------------------------- |
| **Failures started today** | Failed runs started today.                                                                        |
| **Failures in period**     | Failed runs within the current slice (yellow when there are failures; green when there are none). |
| **Completed successfully** | Runs completed successfully, in the format *successes / total runs*.                              |
| **Total Runs**             | Number of refresh runs returned in the period.                                                    |

{% hint style="info" %}
The cards count **runs**, while the table shows **one row per model** (the most recent run of each model in the period). That is why the total in the cards can be greater than the number of rows in the table.
{% endhint %}

### Period

**What it is.** Shortcut buttons for the analyzed range: **Today** (default), **24h**, **7d**, **30d**, and **Custom**.

**What it is for.** Switching between the day's operation and a historical analysis: for example, the last 30 days to see which models fail frequently.

<figure><picture><source srcset="/files/9rowZn2AZaPQ9MHX8WYa" media="(prefers-color-scheme: dark)"><img src="https://3938213054-files.gitbook.io/~/files/v0/b/gitbook-x-prod.appspot.com/o/spaces%2FH2bFRBmIfyK3kwVKbldl%2Fuploads%2Fgit-blob-f266ee51c5adff3ee6a18e561f7edddd9f7af580%2Fpm-monitoramento-modelos-semanticos-periodo-en.png?alt=media" alt="Today, 24h, 7d, 30d, and Custom period buttons with the Date field of the custom period"></picture><figcaption><p>Period selection, with the custom range open</p></figcaption></figure>

**How to use**

1. In **Period**, click **Today**, **24h**, **7d**, or **30d**. The active button is highlighted.
2. For a specific range, click **Custom** and fill in the two dates of the **Date** field that appears next.

### Search and status filter

**What it is.** The filter bar with three search fields (**Search by dataset/workspace ID**, **Search by request ID**, and **Search by name**) and the **All statuses** list.

**What it is for.** Finding a specific model, an entire workspace, or a run cited in a support ticket with Microsoft (by the request ID).

<figure><picture><source srcset="/files/7NpEcbvpRCXIJUhWXqBR" media="(prefers-color-scheme: dark)"><img src="https://3938213054-files.gitbook.io/~/files/v0/b/gitbook-x-prod.appspot.com/o/spaces%2FH2bFRBmIfyK3kwVKbldl%2Fuploads%2Fgit-blob-6a63edafc487ec21035f5e06e18a5242aacd51f0%2Fpm-monitoramento-modelos-semanticos-filtros-en.png?alt=media" alt="Filter bar with the search fields, the status list, and the Retry, Retry Queue, Schedules, and Clear filters buttons"></picture><figcaption><p>Filter and action bar</p></figcaption></figure>

**How to use**

1. To find by name, type in **Search by name**.
2. To find by the model or workspace identifier, type in **Search by dataset/workspace ID**.
3. To find a specific run, type the identifier in **Search by request ID**.
4. To filter by status, choose in **All statuses** the option **Success**, **Failed**, **In progress**, **Cancelled**, or **Disabled**.

### Clear filters

**What it is.** The **Clear filters** button, in the filter bar, which shows how many filters are active.

**What it is for.** Quickly returning to the default view after an investigation.

**How to use**

1. Check the number on the **Clear filters** button: it indicates how many adjustments are active. With no adjustments, the button is disabled.
2. Click **Clear filters**. The screen returns to the **Today** period, with no searches, no status, and the default sort order.

**How it works.** The following count as an active filter: a period other than **Today**, changed dates, each filled-in search field, the chosen status, and a changed sort order.

### Refreshes table

**What it is.** The list of semantic models with the most recent run of each one in the period: name, status, start, end, duration, who submitted it, workspace, and when Power Monitor recorded the run.

**What it is for.** Seeing, model by model, what completed, what failed, and how long it took.

**How to use**

1. Go through the table (10 models per page by default) and use the pagination below it to move forward. The **Items per page** selector lets you choose 10, 25, 50 or 100 rows.
2. To sort, click the title of **Name**, **Status**, **Start**, **End**, or **Duration**. For **Name**, the first click sorts alphabetically; for the others, from highest to lowest. Clicking the same column again reverses the order.
3. Click a row to open the [details panel](#semantic-model-details-panel), or right-click it to open the [row actions menu](#row-actions-menu-right-click). On rows with **Failed**, hover over the status to see the [failure history](#failed-chip-and-failure-history).
4. When nothing matches the filters, the table displays **No model found with the selected filters.**

**How it works**

In the default sort order, models with failures appear first.

| Column           | What it shows                                                                                                                                                 |
| ---------------- | ------------------------------------------------------------------------------------------------------------------------------------------------------------- |
| *(selection)*    | Checkbox available only on rows whose last refresh failed (used to [reprocess](#retry-reprocess-failures)).                                                   |
| **Name**         | Name of the semantic model and the beginning of its ID.                                                                                                       |
| **Status**       | **Success**, **Failed**, **In progress**, **Cancelled**, **Disabled**, or **No history**. The **Failed** chip shows the error and the model history on hover. |
| **Start**        | Start date and time of the run and how long ago it was.                                                                                                       |
| **End**          | End date and time of the run and how long ago it was.                                                                                                         |
| **Duration**     | Total run time (in red when there was an error).                                                                                                              |
| **Submitted by** | Owner of the refresh configuration (user or service principal), as reported by Power BI.                                                                      |
| **Workspace**    | Name and ID of the model's workspace.                                                                                                                         |
| **Captured at**  | When Power Monitor recorded that run.                                                                                                                         |

Dates and times are displayed in your browser's time zone.

The **Hide data** button in the screen header masks identities (the **Submitted by** values and the e-mail of whoever queued a retry) on screen. It is a convenience for sharing the screen, not an access control.

### "Failed" chip and failure history

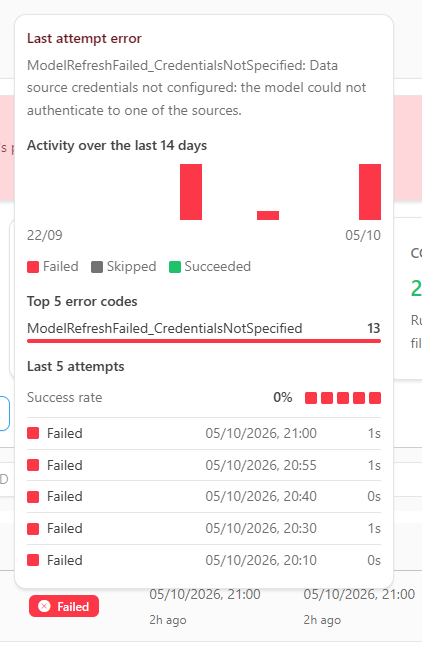
**What it is.** On rows whose last refresh failed, the status appears as a single red **Failed** chip. When you hover over it (or focus it with the keyboard), a panel opens with the **last attempt error** and the **recent history of the model**.

**What it is for.** Diagnosing the cause of a failure and knowing whether it is isolated or recurring, without leaving the list and without opening Power BI.

<figure><picture><source srcset="/files/wh0s0po4LzyMOIu7fBTG" media="(prefers-color-scheme: dark)"><img src="https://3938213054-files.gitbook.io/~/files/v0/b/gitbook-x-prod.appspot.com/o/spaces%2FH2bFRBmIfyK3kwVKbldl%2Fuploads%2Fgit-blob-6eadff810a0b7455df29094f3a1f6f3013a37620%2Fpm-monitoramento-modelos-semanticos-chip-falha-historico-en.png?alt=media" alt="Panel open over the Failed chip with the last attempt error, the activity of the last 14 days, the top error codes, and the last attempts"></picture><figcaption><p>Failure history panel over the "Failed" chip</p></figcaption></figure>

**How to use**

1. In the **Status** column, hover over the **Failed** chip.
2. Read the **Last attempt error**: the error code followed by a short plain-language explanation.
3. Scroll the panel to see the **Activity over the last 14 days**, the **Top 5 error codes**, the **Success rate**, and the **Last 5 attempts**. For the full error text, open the [details panel](#semantic-model-details-panel) by clicking the row.

**How it works**

| Panel block                        | What it shows                                                                                                                                                                             |
| ---------------------------------- | ----------------------------------------------------------------------------------------------------------------------------------------------------------------------------------------- |
| **Last attempt error**             | Error code and short explanation.                                                                                                                                                         |
| **Activity over the last 14 days** | Bars per day with the **Succeeded**, **Failed**, and **Skipped** attempts (cancelled, disabled, or without history).                                                                      |
| **Top 5 error codes**              | The most frequent error codes of the model in the period. Failures without a code appear as **No code**.                                                                                  |
| **Last 5 attempts**                | A sequence of squares (green for success, red for failure, gray for skipped, and blue for in progress) and the **Success rate**, calculated over the attempts that have already finished. |

The history is fetched on demand, once per model. If the query fails, the panel shows *Could not load this model's history.*

**Translated errors.** Instead of the raw technical text returned by the API, Power Monitor shows the error code and an explanation in clear language. The most common Power BI errors already have their own explanation, for example:

| Situation                           | What the explanation advises                                                                                                                        |
| ----------------------------------- | --------------------------------------------------------------------------------------------------------------------------------------------------- |
| Data source OAuth token not renewed | Re-authenticate in the model's credentials (common causes: password change, MFA, permission changes).                                               |
| Gateway unreachable or offline      | Check whether the gateway service is running and up to date.                                                                                        |
| Invalid or missing credentials      | Review the data source credentials.                                                                                                                 |
| Timeout exceeded                    | The refresh was cancelled for exceeding 2 hours (shared capacity) or 5 hours (Premium/Fabric); consider incremental refresh or reducing the volume. |
| Capacity limit exceeded             | Too many simultaneous refreshes on the capacity; wait and review the schedule times.                                                                |
| Memory or processing errors         | Review the model size and the Power Query/DAX expressions.                                                                                          |

Codes that do not have their own explanation are displayed with the original message returned by Power BI.

### "Semantic model details" panel

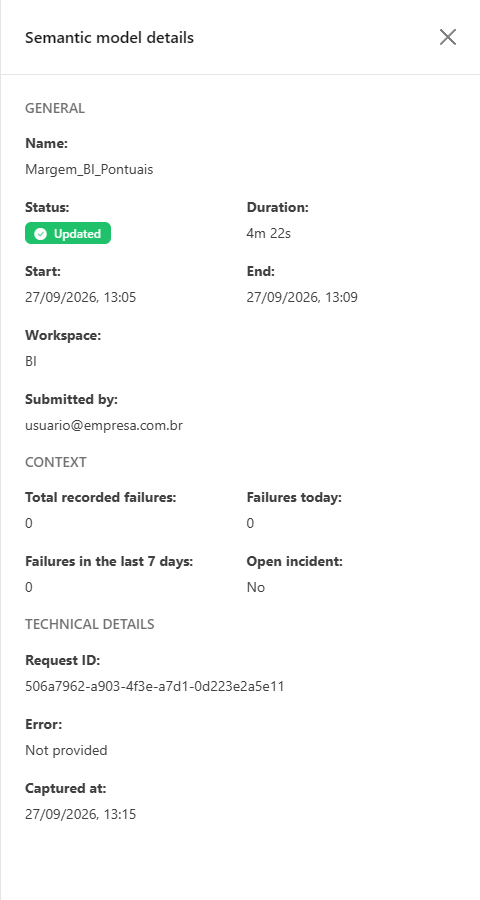
**What it is.** A side panel opened when you click a row, with the general run data, the model's failure context, and the technical details.

**What it is for.** Understanding whether the failure is a one-off or recurring, how long the incident has been open, and what the full error is: with the **Request ID** to open a support ticket with Microsoft.

<figure><picture><source srcset="/files/wF1vh28NxSZk9MLOaG7j" media="(prefers-color-scheme: dark)"><img src="https://3938213054-files.gitbook.io/~/files/v0/b/gitbook-x-prod.appspot.com/o/spaces%2FH2bFRBmIfyK3kwVKbldl%2Fuploads%2Fgit-blob-925b9c5b38cf6b290107986286f1f2980ada7352%2Fpm-monitoramento-modelos-semanticos-detalhes-en.png?alt=media" alt="Semantic model details panel with the General, Context, and Technical details blocks"></picture><figcaption><p>"Semantic model details" panel for a failed refresh</p></figcaption></figure>

**How to use**

{% stepper %}
{% step %}

#### Open the panel

Click the model's row. The **Semantic model details** panel opens on the right.
{% endstep %}

{% step %}

#### Read the context

In the **Context** block, check **Total recorded failures**, **Failures today**, **Failures in the last 7 days**, and whether there is an **Open incident**.
{% endstep %}

{% step %}

#### Read the full error

In the **Technical details** block, read the **Error** (code and full explanation) and note the **Request ID**.
{% endstep %}

{% step %}

#### Close the panel

Click the panel's **X** or outside it to return to the table.
{% endstep %}
{% endstepper %}

**How it works**

| Block                 | Information                                                                                                                                                                                                             |
| --------------------- | ----------------------------------------------------------------------------------------------------------------------------------------------------------------------------------------------------------------------- |
| **General**           | Name, status, duration, start, end, workspace, and submitted by.                                                                                                                                                        |
| **Context**           | **Total recorded failures**, **Failures today**, **Failures in the last 7 days**, and **Open incident** (Yes/No). With an open incident, it also shows the **Open incident duration** and **Open incident started at**. |
| **Technical details** | **Request ID**, **Error** (code and full explanation), and **Captured at**.                                                                                                                                             |

The **Context** block is loaded when the panel opens; if the query fails, the message *Failed to load semantic model context.* appears.

### Row actions menu (right-click)

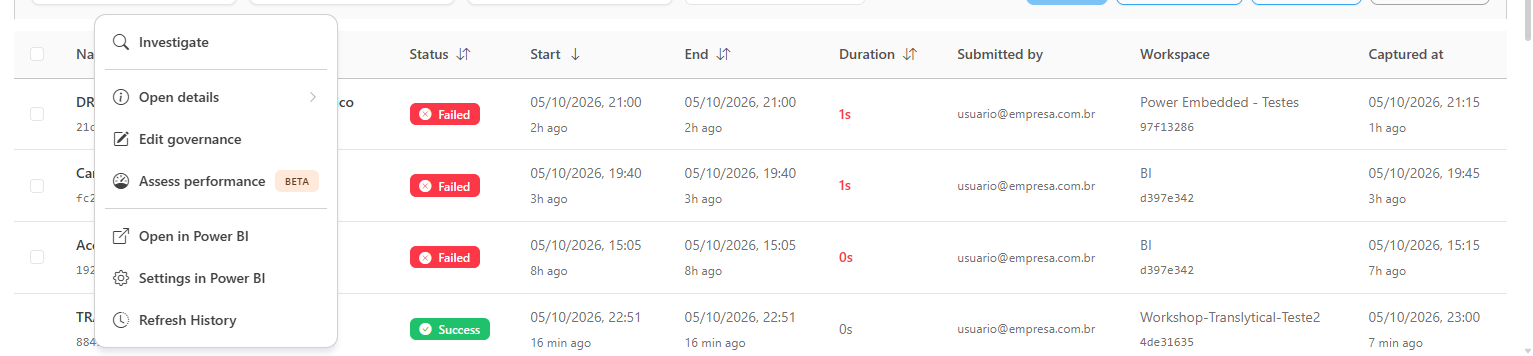
**What it is.** Right-click a row to open the actions menu of the model. The items are the same as in the [Governance › Semantic Models](/en/power-monitor/governanca/modelos-semanticos.md) menu and open the same modals right here, without taking you off the screen.

**What it is for.** Going from the refresh list straight to the details, the governance, Power BI, or the history of the model.

<figure><picture><source srcset="/files/f3DtObIp5peLXrptryrX" media="(prefers-color-scheme: dark)"><img src="https://3938213054-files.gitbook.io/~/files/v0/b/gitbook-x-prod.appspot.com/o/spaces%2FH2bFRBmIfyK3kwVKbldl%2Fuploads%2Fgit-blob-1dfe7a743e6527eaa4ed8dda4651761a2c4afd42%2Fpm-monitoramento-modelos-semanticos-menu-acoes-en.png?alt=media" alt="Right-click menu open over a failed row, with the Investigate item first"></picture><figcaption><p>Row actions menu, with the "Investigate" item</p></figcaption></figure>

| Item                            | What it does                                                                                                                                                                                                                                                                 |
| ------------------------------- | ---------------------------------------------------------------------------------------------------------------------------------------------------------------------------------------------------------------------------------------------------------------------------- |
| **Investigate**                 | Opens the [failure investigation](#investigate-a-failure-with-ai). It only appears on rows with **Failed**; it is the first item of the menu.                                                                                                                                |
| **Open details**                | Opens the model details. When you hover over it, a submenu lets you jump straight to a tab: **General Information**, **Tables & Schema**, **Parameters**, **Permissions**, **Lineage**, **Model diagram**, **AI Adherence**, **Best Practices Adherence**, or **Schedules**. |
| **Edit governance**             | Edits the governance metadata of the model (owners and criticality). Appears only to **Administrators**.                                                                                                                                                                     |
| **Assess performance** *(Beta)* | Takes you to the [Performance Assessment](/en/power-monitor/performance/avaliacao-de-performance.md) of the model.                                                                                                                                                           |
| **Open in Power BI**            | Opens the model in Power BI, in a new tab.                                                                                                                                                                                                                                   |
| **Settings in Power BI**        | Opens the model settings in Power BI.                                                                                                                                                                                                                                        |
| **Refresh History**             | Opens the refresh history of the model.                                                                                                                                                                                                                                      |

{% hint style="info" %}
To locate the model in the inventory, Power Monitor runs a lookup the first time you use an item that depends on it. If the model is not in the inventory (for example, it was deleted, is outside your scope, or has not been scanned yet), the message *Could not find this semantic model in the inventory.* appears.
{% endhint %}

### Investigate a failure with AI

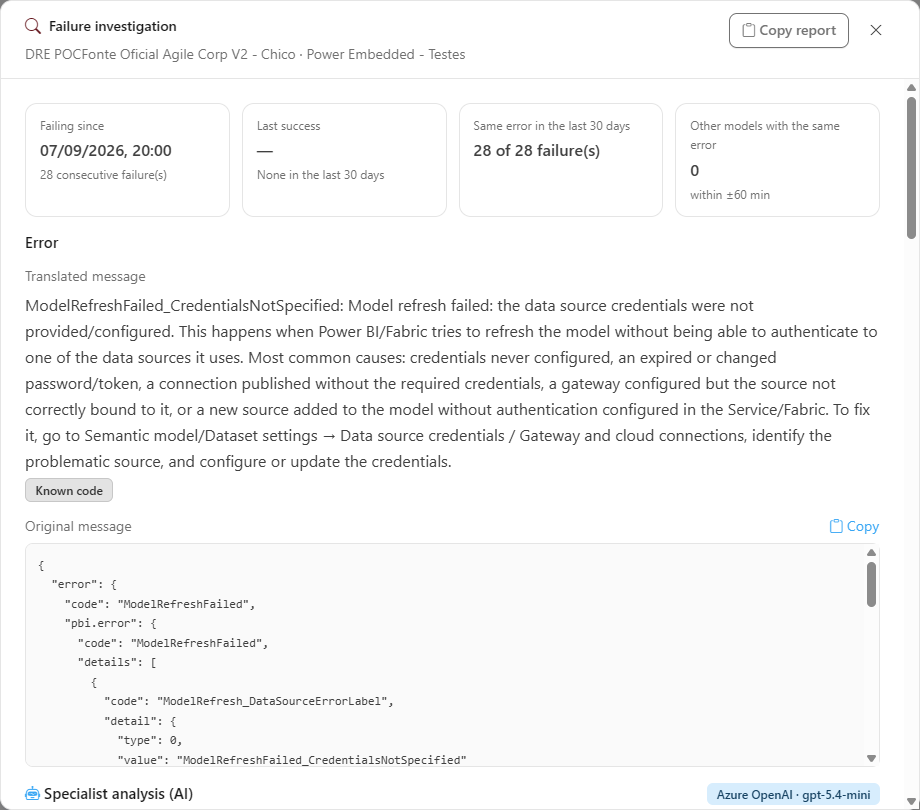
**What it is.** The **Investigate** item of the right-click menu, available on rows with **Failed**. It opens the **Failure investigation** modal, with a technical dossier of the failure and an AI-generated analysis.

**What it is for.** Quickly understanding why the refresh failed, whether it is a new or recurring problem, whether other models failed for the same reason, and what to do next.

Prerequisite: the AI feature must be configured (see [Settings › AI](/en/power-monitor/configuracoes/ia.md)) and the monthly AI spending limit must not have been reached. Otherwise, the **Investigate** item stays visible but disabled, and the tooltip explains why.

<figure><picture><source srcset="/files/XCJcMHpKM6rLR6JH1lpD" media="(prefers-color-scheme: dark)"><img src="https://3938213054-files.gitbook.io/~/files/v0/b/gitbook-x-prod.appspot.com/o/spaces%2FH2bFRBmIfyK3kwVKbldl%2Fuploads%2Fgit-blob-ecbf5a92de01cde3605b984017ea11ce33bcf04b%2Fpm-monitoramento-modelos-semanticos-investigar-en.png?alt=media" alt="Failure investigation modal with the summary, the translated and original error, the specialist AI analysis, and the technical context"></picture><figcaption><p>"Failure investigation" modal</p></figcaption></figure>

**How to use**

{% stepper %}
{% step %}

#### Open the investigation

Right-click the row with **Failed** and choose **Investigate**. The dossier is loaded and the AI analysis is generated automatically (it may take a few seconds).
{% endstep %}

{% step %}

#### Read the summary

The four cards at the top show **Failing since** (with the number of consecutive failures), **Last success**, **Same error in the last 30 days** (how many of the failures had the same code), and **Other models with the same error** within ±60 min.
{% endstep %}

{% step %}

#### Read the error and the analysis

The **Error** section has the **Translated message** and the **Original message** (with a **Copy** button). The **Specialist analysis (AI)** section summarizes the probable cause and the suggested actions. Use **Generate again** to repeat the analysis.
{% endstep %}

{% step %}

#### Check the context and take it to support

The **Technical context** section lists the latest attempts, the refresh type, the duration (compared with the model average), the workspace, the capacity, and model data (storage mode, tables, data sources, size, rows, partitions, incremental refresh, RLS roles, and schedule). The **To open a Microsoft support case** block gathers the Cluster, the Activity ID, the Request ID, and the failure time. Use **Copy report** to copy the whole dossier.
{% endstep %}
{% endstepper %}

**How it works**

* The dossier covers the last 30 days of the model and the 10 most recent attempts.
* The analysis is generated by AI from the collected error and history and carries the notice *Generated by AI from the collected error and history. Validate before applying changes.* If the AI fails, the dossier is still valid and **Generate again** appears.
* Each analysis counts against the organization's monthly AI spending limit.
* The **Technical context** uses the model inventory; if the model is not in the inventory, the screen warns you.

### Retry (reprocess failures)

**What it is.** The selection of failed models in the table and the **Retry** button, which sends the selected models to a **reprocessing queue**. Restricted to **Administrators**.

**What it is for.** Reprocessing failed refreshes in bulk, without opening each model in Power BI: for example, after fixing a credential or turning a gateway back on.

<figure><picture><source srcset="/files/Hu0eISxI2IhAIcIU3Pqt" media="(prefers-color-scheme: dark)"><img src="https://3938213054-files.gitbook.io/~/files/v0/b/gitbook-x-prod.appspot.com/o/spaces%2FH2bFRBmIfyK3kwVKbldl%2Fuploads%2Fgit-blob-985517746bbdfb5194cd8c7c7239581db3396282%2Fpm-monitoramento-modelos-semanticos-selecao-modelos-com-falha-en.png?alt=media" alt="Table with failed models selected and the Retry button showing the number selected"></picture><figcaption><p>Selecting failed models for a new attempt</p></figcaption></figure>

**How to use**

Prerequisite: **Administrator** profile. The organization's service principal must have permission to refresh the models.

{% stepper %}
{% step %}

#### Focus on the failures

Click **View today's failures** in the banner (or select the desired period and the **Failed** status).
{% endstep %}

{% step %}

#### Fix the cause first, when needed

Analyze each model's error. If the cause requires manual action (expired credentials, offline gateway), fix it first: otherwise, the new attempt will fail again.
{% endstep %}

{% step %}

#### Select the models

Select the checkbox of the desired rows (it only appears on rows whose last refresh failed) or the header checkbox, **Select all failures**.
{% endstep %}

{% step %}

#### Send to the queue

Click **Retry** (the button shows how many models are selected). The message *Queued: N · Skipped: M* confirms the submission and the selection is cleared.
{% endstep %}

{% step %}

#### Follow the result

Click **Retry Queue** to follow each refresh until **Succeeded** or **Failed**.
{% endstep %}
{% endstepper %}

**How it works**

* The button is disabled while no model is selected. For other profiles, it is not displayed.
* Power Monitor triggers the refresh of each model on behalf of the organization's service principal, keeping a limited number of simultaneous refreshes, and follows the result.
* Models that were already **Waiting** or **Running** in the queue are **skipped**, so the same refresh is not triggered twice.
* If the submission fails, the message *Failed to queue the refresh retries.* appears.

### Retry Queue

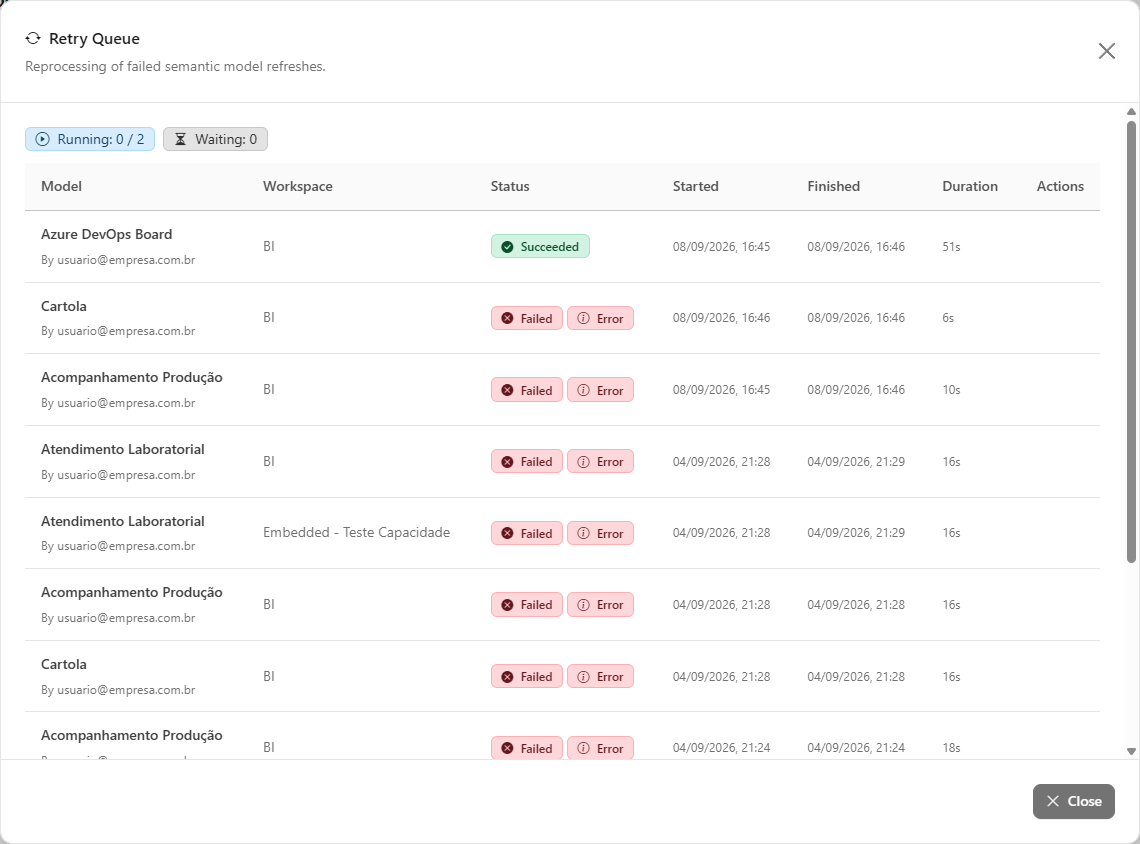
**What it is.** The **Retry Queue** modal, opened by the button of the same name, with the progress of each item sent for reprocessing. Available to all profiles.

**What it is for.** Following in real time whether the new attempts completed and, if they failed, why.

<figure><picture><source srcset="/files/N8Ir5hVX2fdpIW9U8HeE" media="(prefers-color-scheme: dark)"><img src="https://3938213054-files.gitbook.io/~/files/v0/b/gitbook-x-prod.appspot.com/o/spaces%2FH2bFRBmIfyK3kwVKbldl%2Fuploads%2Fgit-blob-1261d7994b4b16dee36b70dde17dea7c0aeef5cd%2Fpm-monitoramento-modelos-semanticos-fila-tentativas-en.png?alt=media" alt="Retry Queue modal with a summary of running and waiting items"></picture><figcaption><p>"Retry Queue" modal</p></figcaption></figure>

**How to use**

1. Click **Retry Queue**.
2. At the top of the modal, read **Running: X / limit** and **Waiting: Y**.
3. Check the **Status** of each item. For items with **Failed**, hover over the **Error** badge to see the reason. When there are no items, the modal displays **The queue is empty**.
4. Click **Close** to exit.

**How it works**

The list refreshes by itself every 3 seconds, with the columns **Model** (and who queued the item), **Workspace**, **Status**, **Started**, **Finished**, **Duration** and, for administrators, **Actions**.

| Item status   | Meaning                                                               |
| ------------- | --------------------------------------------------------------------- |
| **Waiting**   | In the queue, waiting for a slot to start.                            |
| **Running**   | Refresh triggered and being followed.                                 |
| **Succeeded** | The refresh completed successfully.                                   |
| **Failed**    | The refresh failed; hover over the **Error** badge to see the reason. |
| **Cancelled** | The item was removed from the queue before starting.                  |

### Cancel an item in the queue

**What it is.** The **Cancel** button, in the **Actions** column of the **Retry Queue** modal, available for **Waiting** items. Restricted to **Administrators**.

**What it is for.** Giving up on a new attempt that was sent by mistake, or that no longer makes sense because the model has already been refreshed another way.

**How to use**

1. In the **Retry Queue** modal, find the item with **Waiting** status.
2. In the **Actions** column, click **Cancel**. The cancellation is immediate, with no confirmation.
3. The message *Retry cancelled successfully.* confirms the action and the item changes to **Cancelled**.

**How it works.** Items that are already **Running** cannot be cancelled; if the item started running at the moment of the click, the list is just updated with the actual state.

### Schedules

**What it is.** The **Schedules** button, in the filter bar, which takes you to the *Governance › Operations › Schedules* screen.

**What it is for.** Checking the configured refresh times and the timeline of runs: useful when capacity-limit failures indicate too many simultaneous refreshes.

**How to use.** Click **Schedules**. See [Schedules](/en/power-monitor/governanca/operacao/agendamentos.md).

## Rules and behavior

* **Data source:** the refresh history is collected through the Power BI admin API, which returns the refreshable semantic models of the organization's capacities.
* **Frequency:** with monitoring enabled, collection happens automatically every **15 minutes**. The screen queries the data every 5 minutes.
* **Activation:** monitoring is turned on by an administrator in *Settings › Monitoring*, in the **Resource Monitoring** section (**Semantic Model Monitoring**).
* **Incidents and alerts:** when a model's most recent refresh fails, is cancelled, or is disabled, an incident is opened and recorded in [Alerts](/en/power-monitor/monitoramento/alertas.md) (type **Model**), with the error code and the explanation. When a subsequent refresh completes successfully, the incident is resolved. The **Dataset Refresh Failed** notification is sent when it opens and **Alert Resolved** when it is resolved.
* **Retry queue:**
  * the number of simultaneous refreshes per organization is configured by the administrator in *Settings › Organization*, in the **Refresh retry** card (from 1 to 10; default 2);
  * an attempt that remains running for more than **30 minutes** is marked as failed due to timeout;
  * the organization's service principal must have permission to refresh the model in the workspace; if it does not, the item ends with **Failed** and the reason appears in the **Error** badge.
* **Times:** dates and times are displayed in your browser's time zone.

{% hint style="info" %}
To find out whether a refresh is taking **longer than usual** (and not just whether it failed), use the [Average Execution Time](/en/power-monitor/performance/tempo-medio-de-execucao.md) screen. To check whether the model's tables have recent data, use [Data Freshness](/en/power-monitor/monitoramento/atualizacao-de-dados.md).
{% endhint %}

## Frequently asked questions

<details>

<summary>The refresh failed with a gateway error. What should I do?</summary>

Check the [Gateways](/en/power-monitor/monitoramento/gateways.md) screen to see whether the gateway is online and whether its version is up to date, and the [Data source credentials](/en/power-monitor/monitoramento/credenciais-de-fontes-de-dados.md) screen to see whether any credential of the gateway data sources is failing. After fixing it, use **Retry** to reprocess the model.

</details>

<details>

<summary>The "Investigate" item is disabled or does not appear.</summary>

It only appears on rows with **Failed**. If it appears disabled, the AI feature is not configured or the monthly AI spending limit has been reached; hover over the item to see the reason and ask an administrator to adjust it in [Settings › AI](/en/power-monitor/configuracoes/ia.md).

</details>

<details>

<summary>Why don't I see the "Retry" button?</summary>

The button is displayed only to **Administrators**. Other profiles can follow the **Retry Queue**, but cannot send or cancel items.

</details>

<details>

<summary>I sent models to the queue, but some were "skipped". Why?</summary>

A model that is already **Waiting** or **Running** in the queue is not queued again. This prevents triggering the same refresh twice.

</details>

<details>

<summary>A model that exists in Power BI does not appear in the list.</summary>

Check whether semantic model monitoring is enabled in *Settings › Monitoring*, whether the model had any refresh in the selected period, and whether the workspace is part of your access scope. Collection uses the Power BI admin API, which lists the refreshable models of the organization's capacities.

</details>

<details>

<summary>Why is the total number of runs greater than the number of rows in the table?</summary>

Because the table shows only the most recent run of each model in the period, while the cards count all runs. A model refreshed 8 times in the day generates 8 runs in the cards and one row in the table.

</details>

## Related pages

* [Monitoring overview](/en/power-monitor/monitoramento.md)
* [Alerts](/en/power-monitor/monitoramento/alertas.md)
* [Data Freshness](/en/power-monitor/monitoramento/atualizacao-de-dados.md)
* [Artifact Refreshes](/en/power-monitor/dashboards/atualizacoes-de-artefatos.md)
* [Average Execution Time](/en/power-monitor/performance/tempo-medio-de-execucao.md)
* [Performance Assessment](/en/power-monitor/performance/avaliacao-de-performance.md)
* [Gateways](/en/power-monitor/monitoramento/gateways.md)
* [Data source credentials](/en/power-monitor/monitoramento/credenciais-de-fontes-de-dados.md)
* [Governance › Semantic Models](/en/power-monitor/governanca/modelos-semanticos.md)


---

# Agent Instructions
This documentation is published with GitBook. GitBook is the documentation platform designed so that both humans and AI agents can read, navigate, and reason over technical content effectively. Learn more at gitbook.com.

## Querying This Documentation
If you need additional information that is not directly available in this page, you can query the documentation by asking a question.

Perform an HTTP GET request on the following URL with the `ask` and `goal` query parameters:

```
GET https://docs.powermonitor.com.br/en/power-monitor/monitoramento/modelos-semanticos.md?ask=<question>&goal=<user_goal>
```

`ask` is the immediate question: it should be specific, self-contained, and written in natural language.
`goal` is what the user is ultimately trying to achieve, the reason they need the answer. Sharing it helps GitBook give you a better, more relevant answer. A goal is most helpful when it describes the outcome the user wants rather than restating the question. For example, with `ask=how do I create an API token`, a goal like `automate deployments from our CI pipeline` lets GitBook tailor the answer to that use case.

The response will contain a direct answer to the question and relevant excerpts and sources from the documentation.

Use this mechanism when the answer is not explicitly present in the current page, you need clarification or additional context, or you want to retrieve related documentation sections.