> For the complete documentation index, see [llms.txt](https://docs.powermonitor.com.br/llms.txt). Markdown versions of documentation pages are available by appending `.md` to page URLs; this page is available as [Markdown](https://docs.powermonitor.com.br/en/power-monitor/monitoramento/relatorio-de-sla.md).
# SLA Report
Monthly SLA report of the environment's incidents, with time to acknowledge (MTTA), time to resolve (MTTR), target compliance, capacity availability, CSV export, and scheduled email delivery.
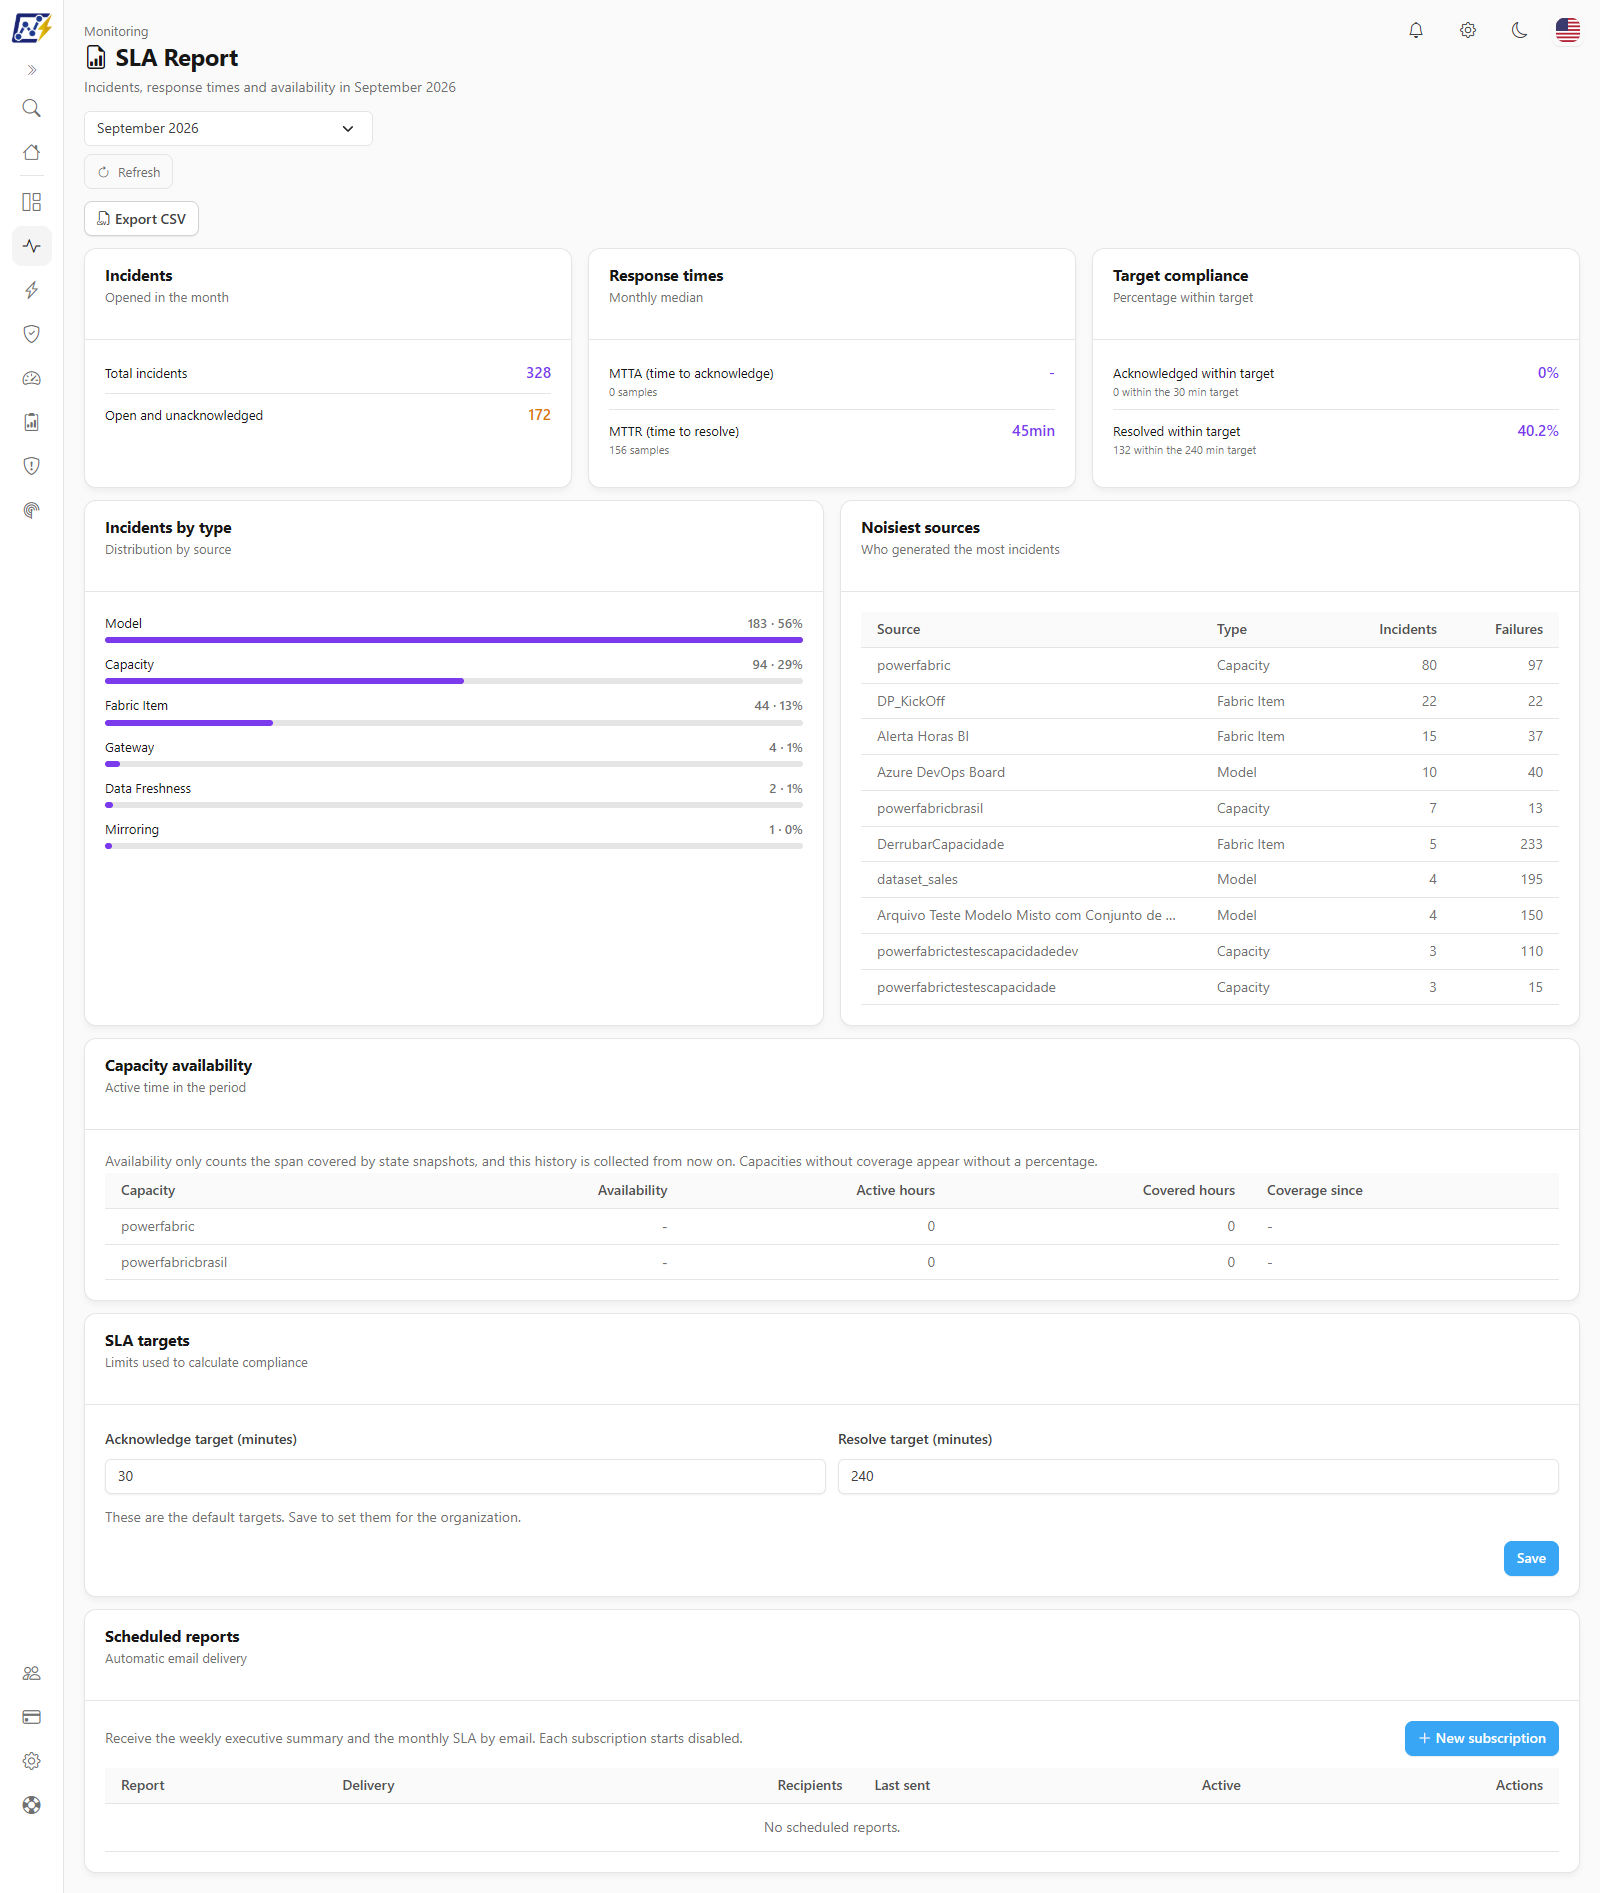
The **SLA Report** summarizes, month by month, how your operation responded to Power Monitor incidents: how many incidents were opened, how long it took someone to **acknowledge** them (**MTTA**) and to **resolve** them (**MTTR**), how many stayed within the **targets** you defined, which sources generated the most noise, and what the availability of the capacities was. It also lets you export the report as CSV and receive summaries by email on scheduled days and times.
**How to access:** *Monitoring › SLA Report*.
**Who can access:** **Administrators** only. The page, the data, the editing of targets, and the scheduled deliveries are restricted to that profile.
SLA Report screen
## What it is for
* **Account for the operation**: present to management, every month, how many incidents occurred and how fast they were handled.
* **Track targets**: measure the percentage of incidents acknowledged and resolved within the organization's targets.
* **Find the noisiest sources**: know which gateways, capacities, models, or items generate the most incidents.
* **Prove availability**: see, per capacity, the percentage of time it was active.
## Screen components
### Header: month, refresh, and export
* **Report month**: list with the current month and the 12 previous months. The default is the **previous month**, already closed. The month is a calendar month in the organization's time zone.
* **Refresh**: reloads the report of the selected month.
* **Export CSV**: downloads the report of the displayed month as a CSV file (see [CSV export](#csv-export)). It is disabled while the report loads.
If the last load fails after a report is already on screen, a notice says the numbers may be out of date. If the incident volume of the month exceeds the analysis limit, another notice says the numbers may be partial.
### Incidents
| Row | What it shows |
| --------------------------- | ----------------------------------------------------------------------------------------------------------------- |
| **Total incidents** | Incidents opened in the month. |
| **Open and unacknowledged** | Incidents of the month that are still open and that nobody has acknowledged (highlighted when greater than zero). |
### Response times
They show the **monthly median**, each with the number of samples used:
* **MTTA (time to acknowledge)**: time between the opening of the incident and its acknowledgment (see [Alerts](/en/power-monitor/monitoramento/alertas.md)). Only incidents that were acknowledged are included.
* **MTTR (time to resolve)**: time between the opening and the resolution. Only incidents that were resolved are included.
With no samples, the value is "-".
### Target compliance
* **Acknowledged within target** and **Resolved within target**: percentage of incidents that met the target, with the footer *N within the X min target*.
{% hint style="info" %}
The percentage is calculated over **all** incidents of the month. An incident that was never acknowledged (or never resolved) counts as a target **not met**: the number only improves when the team acts on the incidents, never by leaving them idle.
{% endhint %}
### Incidents by type
Distribution of the incidents by source, in bars with percentages: **Gateway**, **Capacity**, **Integration**, **Connection**, **Model**, **Fabric Item**, **Mirroring**, and **Data Freshness**.
### Noisiest sources
Table with the 10 sources that generated the most incidents in the month. Columns: **Source**, **Type**, **Incidents**, and **Failures**.
### Capacity availability
For each capacity: **Availability** (percentage), **Active hours**, **Covered hours**, and **Coverage since**.
Availability is the share of the **covered hours** in which the capacity was in the **Active** state. It only considers the span covered by state records, and this history is collected from the moment Power Monitor starts recording it. Only capacities that have consumption monitoring enabled today are included. Capacities without coverage in the month appear with "-" instead of a percentage, never with 100%.
### SLA targets
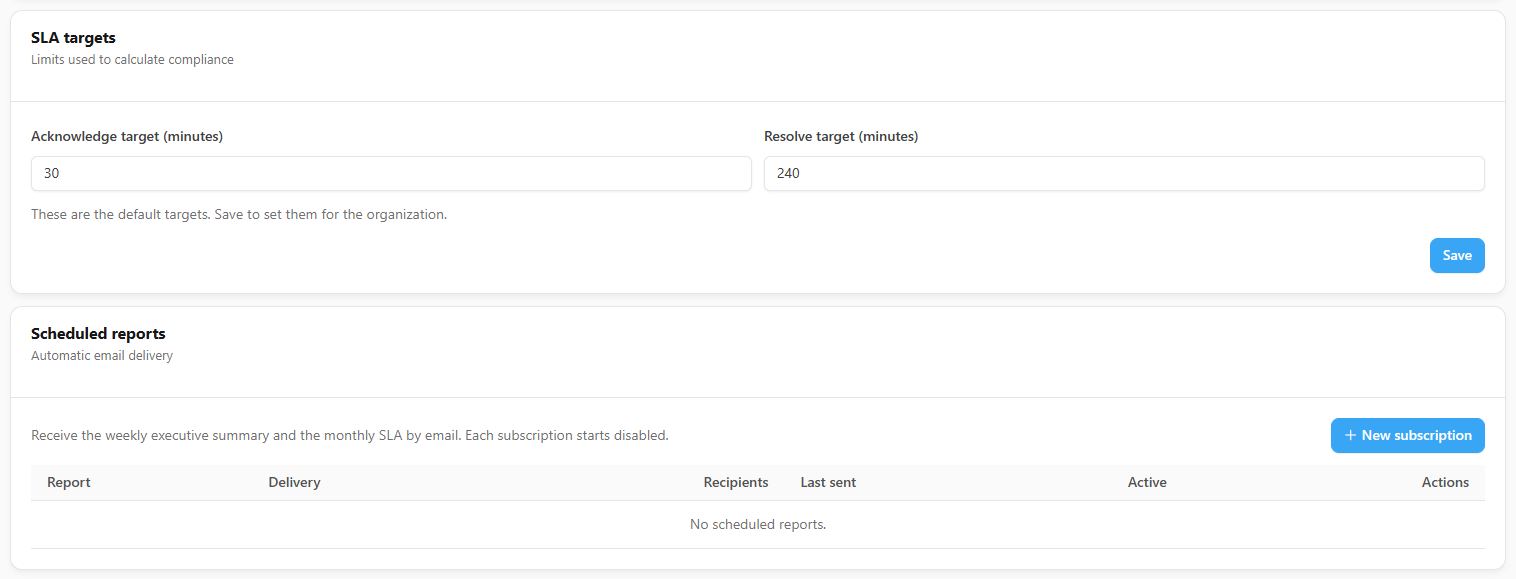
The **SLA targets** card defines the limits used in the compliance calculation:
* **Acknowledge target (minutes)**: default of 30 minutes.
* **Resolve target (minutes)**: default of 240 minutes (4 hours).
Each target accepts a whole number between 1 and 10,080 minutes (7 days). While the targets are the default ones, the screen warns *These are the default targets. Save to set them for the organization.* Once saved, it shows the date of the last update. When you save, the report of the month is recalculated with the new targets.
### Scheduled reports
The **Scheduled reports** card sends reports by email automatically. Each subscription starts **disabled**.
| Type | Content | When it is sent |
| ---------------------------- | ------------------------------------------------------------------------------------------------------------------------------------------------------------------------------------ | ------------------------------------------------------------------------------------------------------- |
| **Weekly executive summary** | Summary of the last 7 days: incidents opened and resolved, MTTR and MTTA, open and unacknowledged, consumption anomalies and capacity cost (when available), and the noisiest items. | On a **day of the week** and **time** of your choice. Covers the 7 days before the send day. |
| **Monthly SLA** | The SLA report of the month, with indicators, incidents by type, noisiest sources, and capacity availability. | On a **day of the month** (from 1 to 28) and **time** of your choice. Covers the month before the send. |
The subscriptions table shows **Report**, **Delivery**, **Recipients**, **Last sent**, the **Active** switch, and the **Actions**:
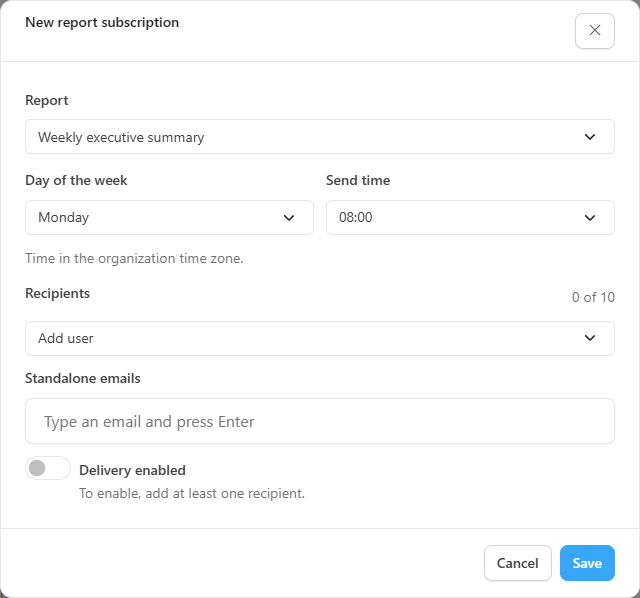
* **New subscription**: opens the modal to choose the type, the day, the time, and the recipients. The type cannot be changed after creation.
* **Send test**: sends a test email, with the most recent period, **only to your own address** (the logged-in administrator). It does not send to the subscription recipients.
* **Edit** and **Delete** (with confirmation).
* The **Active** switch turns delivery on and off. To enable it, at least one recipient is required.
SLA targets and scheduled reports
**Subscription rules**
* Up to **10 subscriptions** per organization and up to **10 recipients** per subscription (adding users and standalone emails).
* Recipients: choose organization users in **Add user** and/or type emails in **Standalone emails** and press Enter.
* The send time (from 00:00 to 23:00) is in the organization's time zone, shown in the modal itself.
* Delivery happens once per period; if the send fails, the system tries again every hour, for up to 6 hours after the scheduled time. After that window, the send for that period is not recovered.
* The emails are sent in Portuguese.
New report subscription modal
### CSV export
The file gathers everything in a single long table, with the columns `section`, `name`, `metric`, and `value`, ready to be filtered or pivoted in a spreadsheet. It has the summary of the month (counts, MTTA and MTTR with median, mean, and P90, targets, compliance, and recurrences), the incidents by type, the noisiest sources, and the availability per capacity. Values without a measure are left blank, never zero.
## Step by step
### How to receive the monthly report by email
{% stepper %}
{% step %}
#### Adjust the targets
In the **SLA targets** card, enter the acknowledge and resolve targets of your operation and click **Save**.
{% endstep %}
{% step %}
#### Create the subscription
In the **Scheduled reports** card, click **New subscription**, choose **Monthly SLA**, the **Day of the month**, and the **Send time**, and add the recipients.
{% endstep %}
{% step %}
#### Test
Save the subscription and click **Send test** on the row to receive an example in your email.
{% endstep %}
{% step %}
#### Enable
Turn on the **Active** switch of the subscription. From the next scheduled day and time, the report will be sent.
{% endstep %}
{% endstepper %}
## Frequently asked questions
Why does the report open on the previous month?
Because the previous month is already closed and its numbers no longer change. To see the month in progress, choose it in the **Report month** list; its numbers change as new incidents occur.
Why do MTTA or MTTR show "-"?
Because no incident of the month was acknowledged (for MTTA) or resolved (for MTTR). The times use only incidents that reached that stage.
The capacity availability shows "-".
The capacity has no state history covering the period. The history is collected from when Power Monitor started recording it; the **Coverage since** column shows the start of the coverage.
The compliance percentage looks low, but the team responded fast.
Remember that the percentage considers all incidents: those that were never acknowledged or resolved count as a target not met. Acknowledge the incidents in [Alerts](/en/power-monitor/monitoramento/alertas.md) so they start counting.
The test was sent, but my recipients did not receive it.
**Send test** sends only to the administrator who clicked. The subscription recipients receive the email only on the scheduled day and time, and only if the subscription is active.
## Related pages
* [Monitoring overview](/en/power-monitor/monitoramento.md)
* [Alerts](/en/power-monitor/monitoramento/alertas.md)
* [Capacities](/en/power-monitor/monitoramento/capacidades.md)
* [Settings](/en/power-monitor/configuracoes.md)
---
# Agent Instructions
This documentation is published with GitBook. GitBook is the documentation platform designed so that both humans and AI agents can read, navigate, and reason over technical content effectively. Learn more at gitbook.com.
## Querying This Documentation
If you need additional information that is not directly available in this page, you can query the documentation by asking a question.
Perform an HTTP GET request on the following URL with the `ask` and `goal` query parameters:
```
GET https://docs.powermonitor.com.br/en/power-monitor/monitoramento/relatorio-de-sla.md?ask=&goal=
```
`ask` is the immediate question: it should be specific, self-contained, and written in natural language.
`goal` is what the user is ultimately trying to achieve, the reason they need the answer. Sharing it helps GitBook give you a better, more relevant answer. A goal is most helpful when it describes the outcome the user wants rather than restating the question. For example, with `ask=how do I create an API token`, a goal like `automate deployments from our CI pipeline` lets GitBook tailor the answer to that use case.
The response will contain a direct answer to the question and relevant excerpts and sources from the documentation.
Use this mechanism when the answer is not explicitly present in the current page, you need clarification or additional context, or you want to retrieve related documentation sections.