> For the complete documentation index, see [llms.txt](https://docs.powermonitor.com.br/llms.txt). Markdown versions of documentation pages are available by appending `.md` to page URLs; this page is available as [Markdown](https://docs.powermonitor.com.br/en/power-monitor/monitoramento/sessoes-spark.md).
# Spark Sessions
Track the queue time, run time, and failures of the Spark sessions of Microsoft Fabric Lakehouses, Notebooks, and Spark Job Definitions.
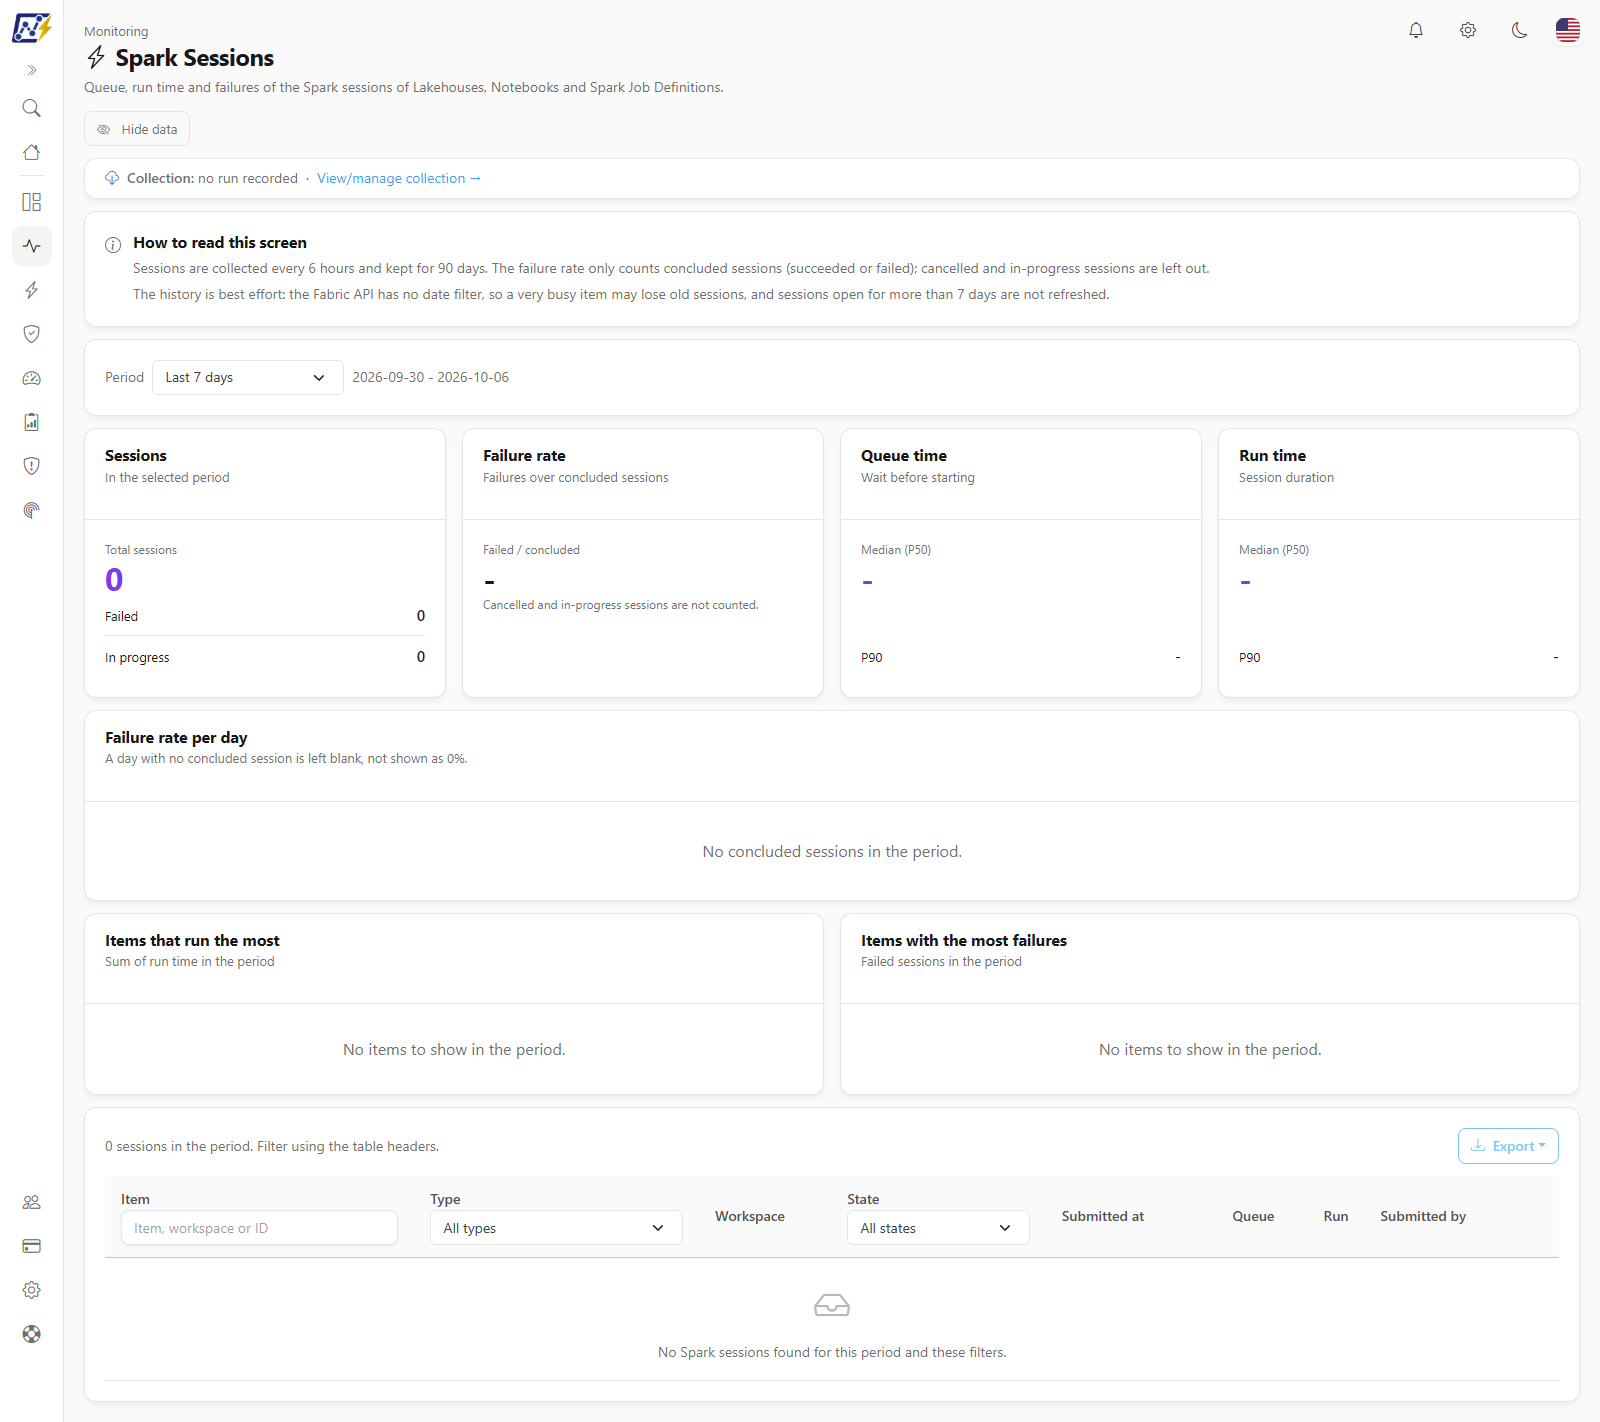
The **Spark Sessions** screen shows how the Spark sessions of the Microsoft Fabric data engineering items are behaving: **Lakehouses**, **Notebooks**, and **Spark Job Definitions**. You can see how long sessions wait in the queue before starting, how long they run, what the failure rate is per day, and which items run the most or fail the most.
**How to access:** *Monitoring › Spark Sessions*.
**Who can access:** all user profiles. Users with visibility restricted to some workspaces see only the sessions of the items in those workspaces, and an administrator can block the page for specific users. The data collection is managed by administrators (see [How the data is collected](#how-the-data-is-collected)).
Spark Sessions screen
## What it is for
* **Identify capacity bottlenecks**: a high queue median or P90 indicates that sessions are waiting for resources to start.
* **Track the stability of notebooks and Spark jobs**: the failure rate per day shows whether problems are isolated or recurring.
* **Find out who consumes the most and who fails the most**: the rankings point to the items that concentrate run time and failures.
* **Investigate a specific session**: the table lists each session with its state, queue and run times, and who submitted it.
## Screen components
### "How to read this screen" notice
A card at the top explains the reading rules: sessions are collected every 6 hours and kept for 90 days; the failure rate only counts **concluded** sessions (succeeded or failed), leaving out cancelled and in-progress ones; and the history is **best effort** (see [History limits](#history-limits)).
### Collection
Right below the title is the **Collection** line, with the date of the last collection run (or *no run recorded*). For administrators, the **View/manage collection →** link takes you to the collection page in [Mapping › Operations › Spark Sessions](/en/power-monitor/mapeamento/sessoes-spark.md), where the **Run now** button is. Other profiles only see the information.
### Period
The **Period** selector offers **Last 7 days** (default), **Last 14 days**, **Last 30 days**, **Last 60 days**, and **Last 90 days**, and shows the start and end dates next to it. The period applies to the indicators, the chart, the rankings, and the table. The limit is 90 days, which is the retention time.
### Indicators
| Indicator | What it shows |
| ---------------- | --------------------------------------------------------------------------------------------------------------------------------------------------------------------------------------------------------------------- |
| **Sessions** | **Total sessions** in the period, with the numbers of **Failed** and **In progress** sessions. |
| **Failure rate** | **Failed / concluded**: percentage of failed sessions among the concluded ones. Cancelled and in-progress sessions are not counted. It shows "-" when no session concluded. It is highlighted when greater than zero. |
| **Queue time** | Wait before starting: **Median (P50)** and **P90**. |
| **Run time** | Session duration: **Median (P50)** and **P90**. |
The **Median (P50)** is the typical value (half of the sessions were below it). The **P90** is the value below which 90% of the sessions fell, useful for seeing the slowest cases without being distorted by a single extreme. Sessions without a time measure are left out of the calculation; when there is no measure at all, the indicator shows "-".
{% hint style="warning" %}
When the period has more sessions than the summary can read, the notice *The period has more sessions than the summary can read. The numbers below cover only the most recent sessions.* appears. In that case, shorten the period to get complete numbers.
{% endhint %}
### "Failure rate per day" chart
Columns with the percentage of failures over the concluded sessions of each day. **A day with no concluded session appears blank, not as 0%**, because zero would say "everything is fine" when in fact nothing finished. When you hover over a column, the tooltip shows the percentage and the count (for example, *40% (2 of 5 concluded)*). With no concluded sessions in the period, the screen shows *No concluded sessions in the period.*
Failure rate per day and item rankings
### Item rankings
Two tables side by side, with the first 10 items of the period:
* **Items that run the most**: sum of run time in the period. Columns: **Item** (with the type), **Sessions**, and **Run time**.
* **Items with the most failures**: failed sessions in the period. Columns: **Item**, **Sessions**, and **Failures**. Only items with at least one failure are listed.
### Sessions table
Paginated list with one row per session. Above the table are the number of sessions in the period and the **Export** button.
| Column | What it shows |
| ---------------- | ------------------------------------------------------------------------------------------- |
| **Item** | Item name (or *Unnamed item*) and, below it, the job type when informed. |
| **Type** | **Lakehouse**, **Notebook**, or **Spark Job Definition**. |
| **Workspace** | Workspace of the item. |
| **State** | **In progress**, **Cancelled**, **Not started**, **Succeeded**, **Failed**, or **Unknown**. |
| **Submitted at** | Date and time when the session was submitted. |
| **Queue** | Wait time before starting. |
| **Run** | Run time. |
| **Submitted by** | User or service principal that submitted the session, with the submitter type. |
The filters are in the headers: a search field in **Item** (*Item, workspace or ID*), the **Type** list (*All types*), and the **State** list (*All states*). The table is paginated, with an items-per-page selector.
The **Submitted by** column is personal data: it respects the **Hide data** button in the page header, which masks the identity on screen and also in the export.
**Actions menu.** Click the **More actions** (⋮) button of the row, or right-click it:
* **Open workspace in Power BI**: opens the item's workspace in a new tab.
* **Copy Spark application ID**: copies the Spark application identifier of the session (disabled when the session has no such identifier).
Sessions table with the actions menu
**Export.** The **Export** button generates a **CSV** or **JSON** file with the sessions of the page on screen, including extra columns (job type, origin, start, end, times in seconds, and Spark application ID).
## Rules and behavior
### How the data is collected
* The collection runs **every 6 hours** and reads the Spark sessions of Lakehouses, Notebooks, and Spark Job Definitions, using the organization's service principal. On the first read of an item, the sessions submitted in the last 7 days are included; on the following ones, only the new ones, plus the sessions that are still open, whose state is refreshed.
* Sessions are **kept for 90 days**; older ones are removed.
* On each run, the collection reads a limited number of items (prioritizing those never read and then those read the longest ago), to respect the limits of the Fabric API. In large environments, items are revisited on the following runs.
* Items in workspaces to which the service principal has no access are left out.
* An administrator can turn the collection on or off in *Settings › Monitoring* (**Spark sessions**), which is on by default, and trigger it right away in [Mapping › Operations › Spark Sessions](/en/power-monitor/mapeamento/sessoes-spark.md).
### History limits
The Fabric API does not allow filtering sessions by date. So the history is **best effort**: a very busy item may lose old sessions, and sessions that stay open for more than 7 days stop being refreshed. Treat the numbers as a representative sample, not as an exact count of everything that ran.
## Frequently asked questions
The screen is empty. What should I check?
Check the **Collection** line: if it shows *no run recorded*, the collection has not run yet (ask an administrator to trigger it in [Mapping › Operations › Spark Sessions](/en/power-monitor/mapeamento/sessoes-spark.md) or wait for the next 6-hour cycle). Also check that the **Spark sessions** collection is on in *Settings › Monitoring*, that the service principal has access to the Fabric workspaces, and that the selected period contains sessions.
Why does the failure rate show "-"?
Because no concluded session (succeeded or failed) was found in the period. Cancelled or in-progress sessions are not part of the calculation.
Why does a day appear blank in the chart?
Because no session finished on that day. Instead of showing 0%, which would suggest everything went well, the chart leaves the day blank.
Why does the queue time of a session show "-"?
The session does not have that measure (for example, it has not started yet or Fabric did not report the start time). It is left out of the medians and percentiles.
I don't see the "View/manage collection" link.
The link appears only to administrators, because the collection pages are part of the **Mapping** menu, which is restricted to that profile.
## Related pages
* [Monitoring overview](/en/power-monitor/monitoramento.md)
* [Fabric Items](/en/power-monitor/monitoramento/itens-do-microsoft-fabric.md)
* [Alerts](/en/power-monitor/monitoramento/alertas.md)
* [Mapping › Operations › Spark Sessions](/en/power-monitor/mapeamento/sessoes-spark.md)
* [Settings › Monitoring](/en/power-monitor/configuracoes/monitoramento.md)
---
# Agent Instructions
This documentation is published with GitBook. GitBook is the documentation platform designed so that both humans and AI agents can read, navigate, and reason over technical content effectively. Learn more at gitbook.com.
## Querying This Documentation
If you need additional information that is not directly available in this page, you can query the documentation by asking a question.
Perform an HTTP GET request on the following URL with the `ask` and `goal` query parameters:
```
GET https://docs.powermonitor.com.br/en/power-monitor/monitoramento/sessoes-spark.md?ask=&goal=
```
`ask` is the immediate question: it should be specific, self-contained, and written in natural language.
`goal` is what the user is ultimately trying to achieve, the reason they need the answer. Sharing it helps GitBook give you a better, more relevant answer. A goal is most helpful when it describes the outcome the user wants rather than restating the question. For example, with `ask=how do I create an API token`, a goal like `automate deployments from our CI pipeline` lets GitBook tailor the answer to that use case.
The response will contain a direct answer to the question and relevant excerpts and sources from the documentation.
Use this mechanism when the answer is not explicitly present in the current page, you need clarification or additional context, or you want to retrieve related documentation sections.