> For the complete documentation index, see [llms.txt](https://docs.powermonitor.com.br/llms.txt). Markdown versions of documentation pages are available by appending `.md` to page URLs; this page is available as [Markdown](https://docs.powermonitor.com.br/en/power-monitor/pagina-inicial.md).
# Home
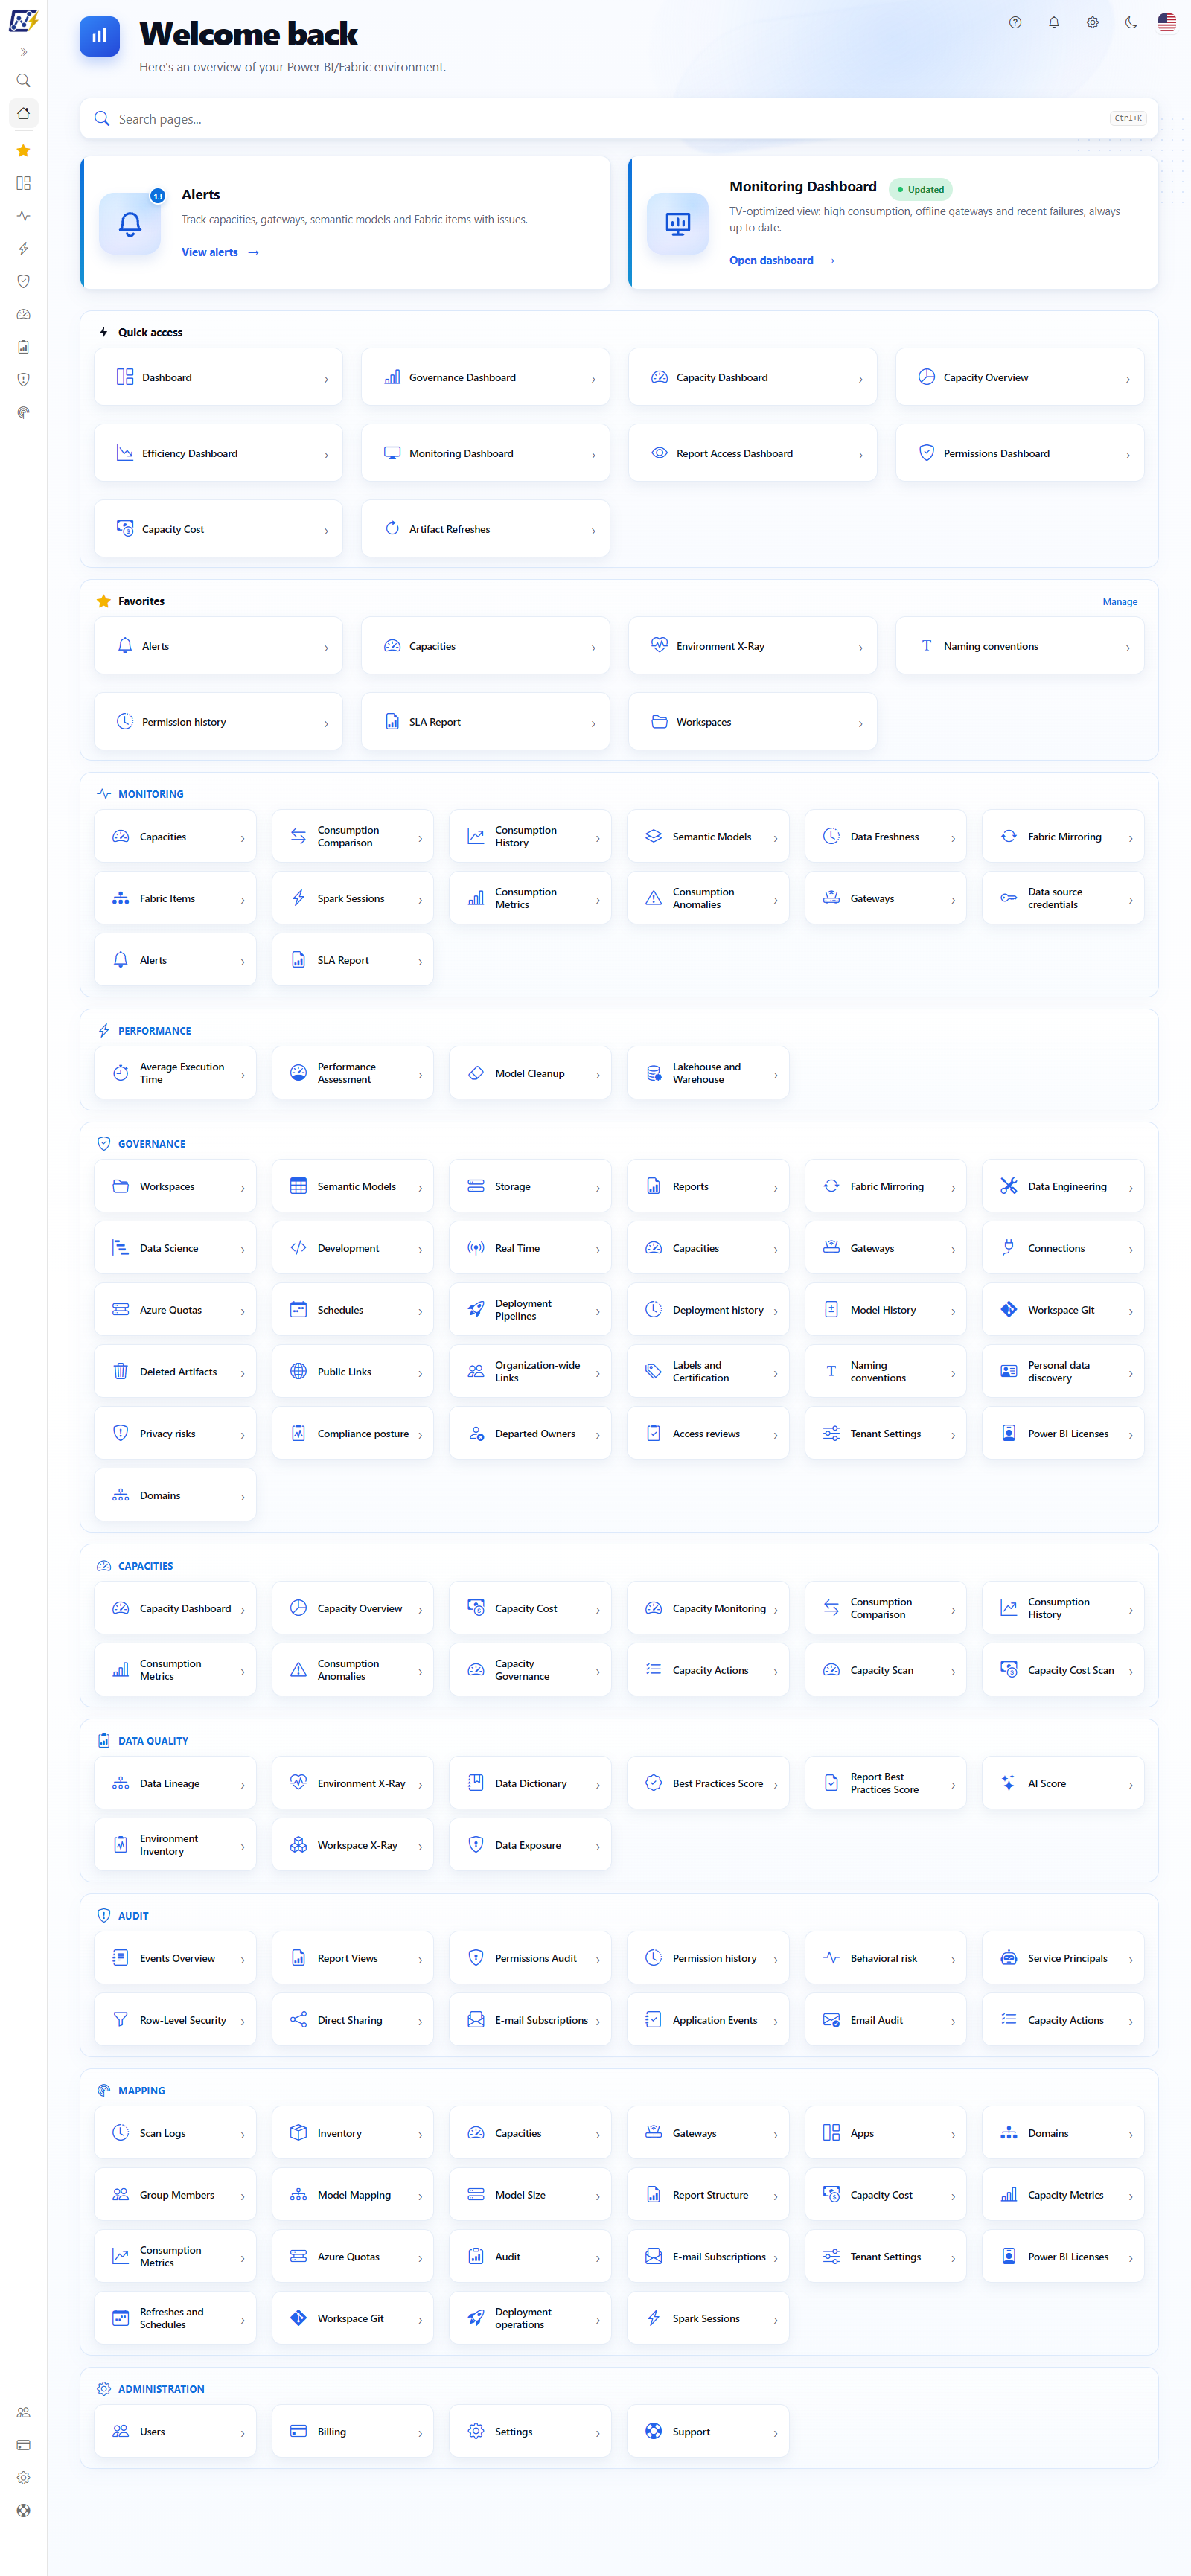
Power Monitor landing page, with page search, shortcuts to alerts, the Monitoring Dashboard, your favorites, and every menu screen your user can access.
The **Home** page is the first screen displayed after sign-in. It works as a starting point: it has a page search field, the two shortcuts most used day to day (Alerts and Monitoring Dashboard), your favorites, and a grid of shortcuts to every screen in the menu, organized by the same groups as the side menu.
**How to access:** click the **house** icon (**Home**), the first item in the side menu, above the areas. The Power Monitor logo, at the top of the menu, takes you to the same place. The page is available to **all profiles** and cannot be blocked in per-page access control: it is always the user's landing page.
Home page
## What it is for
* **Start the day with what matters:** the **Alerts** card already shows how many new incidents appeared in the last 7 days, and the **Monitoring Dashboard** card takes you to the view designed to stay open on a TV.
* **Find any screen quickly:** instead of navigating the two-tier menu, you can type the name (or the topic) in the search field, open a favorite, or see all screens at once, grouped by subject, and get to any of them with one click.
* **See only what you can use:** the grid is built according to your profile and the pages enabled for your user, so it does not display shortcuts to screens you cannot open.
{% hint style="info" %}
The Home page **does not replace** the [Dashboard](/en/power-monitor/dashboards/dashboard-principal.md) (Dashboards › Dashboard), which still exists with the health, inventory, alerts, and capacity indicators. Home has no indicators of its own other than the alert counter.
{% endhint %}
## Features
### Welcome and global controls
**What it is:** the top of the page, with the greeting **"Welcome back"** and the text *"Here's an overview of your Power BI/Fabric environment."*. In the upper-right corner are the global controls, the same as on any other screen: **Help**, **What's new**, shortcut to **Settings** (Administrator only), light/dark theme, and language selector.
**What it is for:** orienting the user right after sign-in and giving quick access to display preferences.
Welcome and global controls
**How to use:**
1. To switch between light and dark theme, click the moon/sun icon in the upper-right corner.
2. To change the interface language, click the flag and choose the language.
3. Administrators can click the gear icon to open [Settings](/en/power-monitor/configuracoes.md).
The details of these controls are in [Interface and navigation](/en/power-monitor/interface-e-navegacao.md).
When you open Home from sign-in, from the **Home** icon, or from the logo, the side menu is displayed **expanded, with the area names** (and not just the icons). As soon as you choose an area or open a screen of an area, it goes back to showing only the icons and the area panel appears next to it. See [Overview](/en/power-monitor/visao-geral.md#main-menu-icon-bar).
### Page search
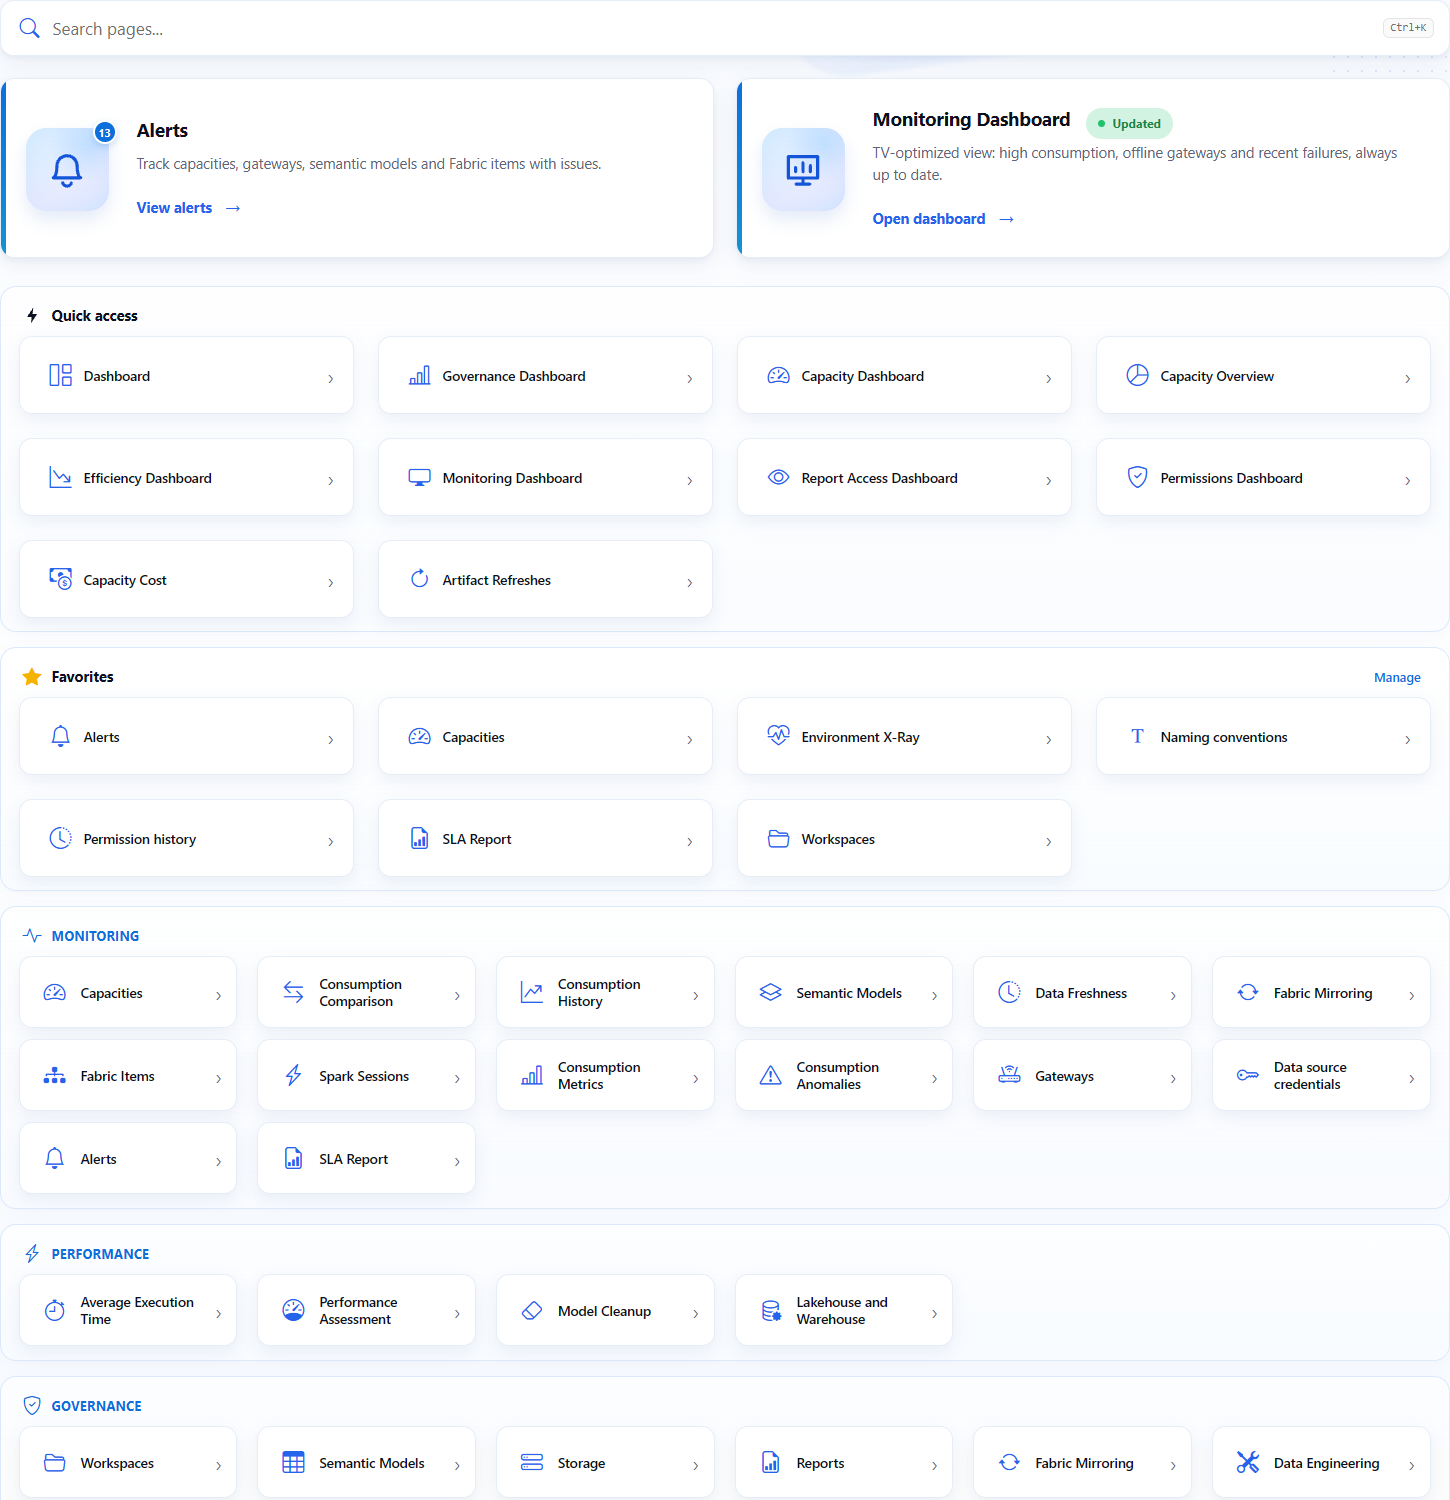
**What it is:** the **Search pages...** field, the first block of the page, right below the greeting.
**What it is for:** going straight to any screen by typing its name, part of it or a topic (for example, "lgpd" or "cost"), without looking in the menu or in the shortcut grid.
Page search and favorites on Home
**How to use:**
1. Click the field (or press **Ctrl+K**, **⌘K** on a Mac, or the slash **/**) and type what you are looking for.
2. The results appear right below the field, with the screen's menu path. Click a result, or use **↑**, **↓** and **Enter**.
The search shows only the screens your user can open. The details are in [Favorites and page search](/en/power-monitor/favoritos-e-busca.md).
### Alerts card
**What it is:** highlight card with the description *"Track capacities, gateways, semantic models and Fabric items with issues."*, the **View alerts** button, and an incident counter on the bell icon. The entire card is clickable.
**What it is for:** knowing, as soon as you sign in, whether new incidents appeared in the environment and going straight to the list of alerts.
Highlight cards
**How to use:**
{% stepper %}
{% step %}
### Read the counter
Look at the number on the bell icon of the **Alerts** card. It indicates how many new incidents were opened in the last 7 days in the workspaces you can see. If the counter does not appear, there are no new incidents in the period.
{% endstep %}
{% step %}
### Open the Alerts screen
Click anywhere on the card (or on **View alerts**). The [Alerts](/en/power-monitor/monitoramento/alertas.md) screen (*Monitoring › Alerts*) opens, with the list of alerts and the filters, where you analyze each incident.
{% endstep %}
{% endstepper %}
**How the counter works:**
* It counts the **number of new incidents recorded in the last 7 days**. Only incident openings are counted: recurrences of an incident that remains open do not count again.
* The number is calculated **once, when the page opens**, and respects your workspace scope (see [What each user sees](#what-each-user-sees)).
* Above 99, the counter shows **"99+"**. The exact number is on the Alerts screen.
* When there are no incidents in the period, the counter does not appear.
* If it is not possible to query the alerts, the counter also does not appear, and the rest of the page loads normally.
### Monitoring Dashboard card
**What it is:** highlight card with the description *"TV-optimized view: high consumption, offline gateways and recent failures, always up to date."* and the **Open dashboard** button. The entire card is clickable.
**What it is for:** opening with one click the panel that the team keeps displayed on a monitor or TV to follow problems in real time.
**How to use:**
1. On **Home**, click the **Monitoring Dashboard** card (or **Open dashboard**).
2. The [Monitoring Dashboard](/en/power-monitor/dashboards/dashboard-de-monitoramento.md) (*Dashboards › Monitoring Dashboard*) opens in a view designed to stay displayed on a team monitor or TV.
**Rule:** the **"Updated"** badge next to the *Monitoring Dashboard* title is only a visual label of the card. It does not indicate the status of a data collection.
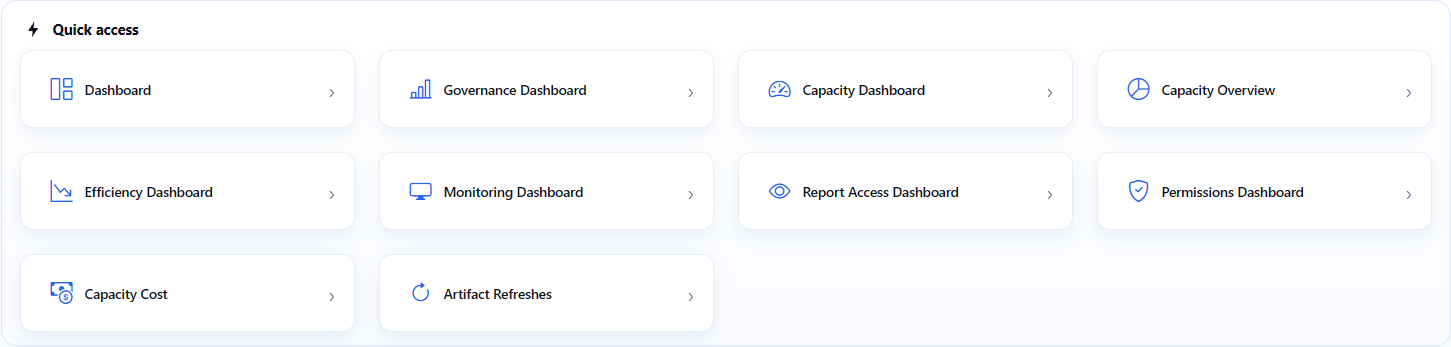
### Quick access
**What it is:** the **Quick access** panel, which brings together, in larger cards, all the screens of the menu's **Dashboards** area.
**What it is for:** getting to any dashboard without opening the side menu.
Quick access panel
**How to use:**
1. On **Home**, find the **Quick access** panel.
2. Click the card of the desired dashboard (for example, **Governance Dashboard**). The screen opens in the same tab, and the side menu starts showing the **Dashboards** area panel.
| Shortcut | Note |
| ------------------------------------------------------------------------------------- | ---- |
| [Dashboard](/en/power-monitor/dashboards/dashboard-principal.md) | |
| [Governance Dashboard](/en/power-monitor/dashboards/dashboard-de-governanca.md) | |
| [Capacity Dashboard](/en/power-monitor/dashboards/dashboard-de-capacidade.md) | |
| [Capacity Overview](/en/power-monitor/dashboards/visao-geral-de-capacidades.md) | |
| [Efficiency Dashboard](/en/power-monitor/dashboards/dashboard-de-eficiencia.md) | |
| [Monitoring Dashboard](/en/power-monitor/dashboards/dashboard-de-monitoramento.md) | |
| [Report Access Dashboard](/en/power-monitor/dashboards/dashboard-de-visualizacoes.md) | |
| [Permissions Dashboard](/en/power-monitor/dashboards/dashboard-de-permissoes.md) | |
| [Capacity Cost](/en/power-monitor/dashboards/custo-de-capacidade.md) | |
| [Artifact Refreshes](/en/power-monitor/dashboards/atualizacoes-de-artefatos.md) | |
Each shortcut only appears if your user can open the screen (for example, access to the Report Access Dashboard and the Permissions Dashboard depends on the page access of the profile).
### Favorites
**What it is:** the **Favorites** section, right after **Quick access**, with a shortcut for each screen you marked with the star, in the order you defined, and the **Manage** link.
**What it is for:** opening the screens you use most straight from Home.
**How to use:** click the favorite's shortcut. To add, remove or reorder, click **Manage** and use the **Manage favorites** page. The section only appears when you have at least one favorite that you can open. See [Favorites and page search](/en/power-monitor/favoritos-e-busca.md).
### Shortcut sections by area
**What it is:** below Quick access and Favorites, each area of the side menu becomes a panel with a grid of shortcuts. The order of the sections and shortcuts is the same as in the menu.
**What it is for:** having the complete "map" of the product on a single screen and opening any screen with one click, even without knowing which area it belongs to.
Shortcut sections by area
**How to use:**
{% stepper %}
{% step %}
### Find the section for the subject
Scroll the page to the section of the desired area, for example **Governance**. The sections follow the same order as the side menu.
{% endstep %}
{% step %}
### Click the shortcut
Click the screen's shortcut, for example **Workspaces**. The screen opens as if you had used the menu.
{% endstep %}
{% step %}
### If the shortcut does not appear
The screen is restricted to Administrators or has been blocked for your user (see [What each user sees](#what-each-user-sees)). Ask an administrator of your organization for access.
{% endstep %}
{% endstepper %}
| Section | Shortcuts |
| ---------------------------------- | ------------------------------------------------------------------------------------------------------------------------------------------------------------------------------------------------------------------------------------------------------------------------------------------------------------------------------------------------------------------------------------------------------------------------------------------------------------------------------------------------------------------------------------------------- |
| **Monitoring** | Capacities, Consumption Comparison, Consumption History, Semantic Models, Data Freshness, Fabric Mirroring, Fabric Items, Spark Sessions, Consumption Metrics, Consumption Anomalies, Gateways, Data source credentials, Alerts, SLA Report *(Administrator)* |
| **Performance** | Average Execution Time, Performance Assessment, Model Cleanup, Lakehouse and Warehouse |
| **Governance** | Workspaces, Semantic Models, Storage, Reports, Fabric Mirroring, Data Engineering, Data Science, Development, Real Time, Capacities, Gateways, Connections, Azure Quotas, Schedules, Deployment Pipelines, Deployment history, Model History, Workspace Git, Deleted Artifacts, Public Links, Organization-wide Links, Labels and Certification, Naming conventions, Personal data discovery, Privacy risks, Compliance posture, Departed Owners *(Administrator)*, Access reviews, Tenant Settings, Power BI Licenses *(Administrator)*, Domains |
| **Capacities** | Capacity Dashboard, Capacity Overview, Capacity Cost, Capacity Monitoring, Consumption Comparison, Consumption History, Consumption Metrics, Consumption Anomalies, Capacity Governance, Capacity Actions, Capacity Scan *(Administrator)*, Capacity Cost Scan *(Administrator)* |
| **Data Quality** | Data Lineage, Environment X-Ray *(Administrator)*, Data Dictionary, Best Practices Score, Report Best Practices Score, AI Score, Environment Inventory, Workspace X-Ray, Data Exposure |
| **Audit** | Events Overview, Report Views, Permissions Audit, Permission history, Behavioral risk *(Administrator)*, Service Principals, Row-Level Security, Direct Sharing, E-mail Subscriptions, Application Events, Email Audit, Capacity Actions |
| **Mapping** *(Administrator only)* | Scan Logs, Inventory, Capacities, Gateways, Apps, Domains, Group Members, Model Mapping, Model Size, Report Structure, Capacity Cost, Capacity Metrics, Consumption Metrics, Azure Quotas, Audit, E-mail Subscriptions, Tenant Settings, Power BI Licenses, Refreshes and Schedules, Workspace Git, Deployment operations, Spark Sessions |
**Rules:**
* In Governance, the **Reports** menu group has the report types as sub-items (Paginated Reports, Dashboards, Apps, etc.). On Home it appears as **a single "Reports" shortcut**, which opens the main reports page. From there you navigate through the other types.
* The other Governance groups (**Data and Engineering**, **Infrastructure**, **Operations**, **Compliance** and **Tenant**) and the Mapping groups bring together independent screens and therefore appear on Home as **one shortcut per screen**, in menu order and without the group name. This is the case with **Public Links** and **Organization-wide Links**, which are in the Compliance group.
* The **Capacities** area brings together screens that also appear in other areas, such as Dashboards, Monitoring, Governance, Audit, and Mapping. That is why some shortcuts are repeated in more than one section. Repeated shortcuts open the same screen.
### Administration section
**What it is:** the last section of Home, **Administration**, with the shortcuts that are in the footer of the side menu: **Users**, **Billing**, and **Settings** (Administrator only) and **Support** (all profiles).
**What it is for:** getting to the account management screens and the support channel without looking for the icons in the menu footer.
Administration section
**How to use:**
1. Scroll **Home** to the end and find the **Administration** section.
2. Click the desired shortcut. For users who are not administrators, the section shows only **Support**.
| Shortcut | Who sees it |
| ---------------------------------------------- | ------------- |
| [Users](/en/power-monitor/usuarios.md) | Administrator |
| [Billing](/en/power-monitor/faturamento.md) | Administrator |
| [Settings](/en/power-monitor/configuracoes.md) | Administrator |
| [Support](/en/power-monitor/suporte.md) | Everyone |
## Rules and behavior
### What each user sees
The shortcut grid is filtered **for each user** when the page opens:
1. **Profile:** shortcuts marked as *Administrator* in the tables above only appear to administrators. For other profiles, the entire **Mapping** section is hidden, and the **Administration** section shows only **Support**. The **Favorites** section and the search results follow the same rule. Once the organization customizes page access in [Users](/en/power-monitor/usuarios.md), the Administrator mark no longer hides shortcuts and only the page locks apply (write actions and screens with personal data remain restricted to Administrators on the server).
2. **Per-user page blocking:** if an administrator has blocked a page for your user (in [Users](/en/power-monitor/usuarios.md), in the page access section), the corresponding shortcut disappears from Home, in the same way the link disappears from the menu. A section left with no shortcuts is not displayed.
3. **Workspace scope:** the scope **does not change** which shortcuts appear, since it restricts data, not screens. The **Alerts** card counter, however, respects the scope: it counts only the incidents of the workspaces you can view, plus the incidents with no workspace (such as those of gateways and capacities), which are visible to everyone.
{% hint style="warning" %}
The two **highlight cards** (Alerts and Monitoring Dashboard) are always displayed, even if one of these pages has been blocked for your user. In that case, when you click the card you will see the unauthorized access screen.
{% endhint %}
### Refresh
* Home has no automatic refresh. The alert counter is queried **once, when the page opens**. To see the latest number, reload the page or return to it from the menu.
* The grid follows the side menu: when a screen is added to or removed from the menu, it is added to or removed from Home at the same time.
### Layout
* On wide screens, the sections use a 6-column grid, and Quick access and Favorites use 4 columns. On medium screens (up to about 1200 pixels), the grid changes to 4 columns, the highlight cards are stacked, and Quick access and Favorites use 2 columns. On phones, the shortcuts are in a single column.
* The page works in both light and dark themes.
## Frequently asked questions
Why don't I see the Mapping section or the Users, Billing, and Settings shortcuts?
These screens are restricted to the **Administrator** profile. For users with other profiles, the shortcuts are hidden on Home and in the menu. If you need access, talk to an administrator of your organization.
A shortcut that my colleague sees does not appear for me. Why?
In addition to the profile, an administrator can block specific pages for each user. Blocked pages do not appear on Home or in the menu. Ask the administrator to review your user's page access in **Users**.
The Alerts card counter is different from the total on the Alerts screen. Is that normal?
Yes. The Home counter considers only **incident openings in the last 7 days**. The Alerts screen has its own period, type, and status filters, and by default lists the alerts that have not yet been resolved. The numbers only match if the criteria are the same.
The counter does not appear on the Alerts card. Is there a problem?
Not necessarily. The counter is hidden when there are no new incidents in the last 7 days and also when the alerts query fails. Reload the page. If the problem continues, open the Alerts screen to confirm.
What is the difference between Home and the Dashboard?
**Home** is a navigation page, with shortcuts and the alert counter. The [Dashboard](/en/power-monitor/dashboards/dashboard-principal.md) is an indicator panel: overall capacity state, monitored inventory, alerts for the period, capacity summary, latest mappings, and artifact distribution.
## Related pages
* [Dashboard](/en/power-monitor/dashboards/dashboard-principal.md)
* [Monitoring Dashboard](/en/power-monitor/dashboards/dashboard-de-monitoramento.md)
* [Alerts](/en/power-monitor/monitoramento/alertas.md)
* [Dashboards](/en/power-monitor/dashboards.md)
* [Favorites and page search](/en/power-monitor/favoritos-e-busca.md)
* [Users](/en/power-monitor/usuarios.md)
* [Overview](/en/power-monitor/visao-geral.md)
* [Interface and navigation](/en/power-monitor/interface-e-navegacao.md)
---
# Agent Instructions
This documentation is published with GitBook. GitBook is the documentation platform designed so that both humans and AI agents can read, navigate, and reason over technical content effectively. Learn more at gitbook.com.
## Querying This Documentation
If you need additional information that is not directly available in this page, you can query the documentation by asking a question.
Perform an HTTP GET request on the following URL with the `ask` and `goal` query parameters:
```
GET https://docs.powermonitor.com.br/en/power-monitor/pagina-inicial.md?ask=&goal=
```
`ask` is the immediate question: it should be specific, self-contained, and written in natural language.
`goal` is what the user is ultimately trying to achieve, the reason they need the answer. Sharing it helps GitBook give you a better, more relevant answer. A goal is most helpful when it describes the outcome the user wants rather than restating the question. For example, with `ask=how do I create an API token`, a goal like `automate deployments from our CI pipeline` lets GitBook tailor the answer to that use case.
The response will contain a direct answer to the question and relevant excerpts and sources from the documentation.
Use this mechanism when the answer is not explicitly present in the current page, you need clarification or additional context, or you want to retrieve related documentation sections.