> For the complete documentation index, see [llms.txt](https://docs.powermonitor.com.br/llms.txt). Markdown versions of documentation pages are available by appending `.md` to page URLs; this page is available as [Markdown](https://docs.powermonitor.com.br/en/power-monitor/performance/avaliacao-de-performance.md).

# Performance Assessment

On-demand report for a semantic model, with VertiPaq storage, Capacity Units consumption on the capacity and optimization recommendations backed by official Microsoft sources.

The **Performance Assessment** generates, on demand, a complete technical report on **one** semantic model: how it uses memory (VertiPaq), how much of the capacity it consumes in Capacity Units (CU), how its refreshes and usage are doing, and which modeling, Power Query, refresh, storage or capacity changes can reduce that consumption. Each recommendation includes the evidence that triggered it, the confidence level, the estimated gain and the link to the official Microsoft documentation.

{% hint style="warning" %}
The screen is in **Beta** (badge next to the title). The recommendations and estimates are still being calibrated: review each one before applying it to the model.
{% endhint %}

**How to access:** menu *Performance › Performance Assessment*. You can also open the screen with the model already chosen from the actions menu (⋮) of a row in *Governance › Semantic Models*, **Assess performance** option.

**Who can access:**

* **Viewing** assessments already done (result, history, exports and AI suggestions already generated): all profiles, respecting the user's **workspace scope**. Models and assessments from workspaces outside the scope do not appear in the search and, if opened through a link, are treated as "not found".
* **Requesting a new assessment** and **generating an AI suggestion**: only the organization's **Administrators**. For other profiles, the buttons do not appear, and the screen displays the notice *"Only organization administrators can request an assessment."*
* The page can be blocked for specific users through per-user page blocking (see [Users](/en/power-monitor/usuarios.md)).

<figure><picture><source srcset="/files/53T4SHUtbQs65amdHtgG" media="(prefers-color-scheme: dark)"><img src="https://3938213054-files.gitbook.io/~/files/v0/b/gitbook-x-prod.appspot.com/o/spaces%2FH2bFRBmIfyK3kwVKbldl%2Fuploads%2Fgit-blob-ac4a450b05468da30181ef3bc014185fba4a7912%2Fpm-monitoramento-avaliacao-performance-en.png?alt=media" alt="Performance Assessment screen with a semantic model selected and a completed assessment"></picture><figcaption><p>Performance Assessment of a semantic model with a completed assessment</p></figcaption></figure>

## What it is for

Tools such as VertiPaq Analyzer and Best Practice Analyzer show the *state* of the model; the Performance Assessment cross-references that state with the **actual CU consumption on the capacity** and with the signals Power Monitor already collects (refresh history, schedule, usage in reports, lineage, criticality) to prioritize what is worth optimizing.

Typical use cases:

* **Reduce capacity consumption (FinOps):** a model appears among the largest consumers in [Consumption Metrics](/en/power-monitor/monitoramento/metricas-de-consumo.md). The assessment shows how much of the capacity's CU it represents in the window, which operations weigh the most and which recommendations have the highest estimated gain.
* **Memory diagnosis:** the model is close to the SKU memory limit. The VertiPaq sections point out the dominant tables and columns, high-cardinality text columns, auto date tables and columns not used in reports.
* **Review before scaling the capacity:** before moving up the SKU, check whether there are modeling and refresh gains that solve the problem.
* **Periodic technical review:** keep and compare assessments of the same model over time (history of the 10 most recent) and export the report for the development team.

{% hint style="info" %}
Power Monitor **only recommends**. The assessment reads only the model's **metadata** and capacity metrics: no query is run on the customer's data, no value, sample or MIN/MAX is read, and nothing is changed in the model.
{% endhint %}

## Screen overview

The screen is laid out from top to bottom in this order: header (with **Hide data** and the exports), **Semantic model** card, **Displayed assessment** and **History** cards, **Coverage**, **Recommendations** (and **Rules not evaluated**, when applicable), **Rule coverage**, **AI suggestion**, **VertiPaq** section (Model definition, VertiPaq storage, Largest tables, Columns, Power Query) and **Capacity** section (Capacity and SKU, Model CU consumption, Operations, Refreshes, Model usage).

The result sections only appear for the displayed assessment; from **Coverage** on, the content depends on what the assessment collected, and **AI suggestion** and **Export data** only exist when the assessment is **Completed**.

Screen states without a result:

| Situation                   | What the screen shows                                                                                                                            |
| --------------------------- | ------------------------------------------------------------------------------------------------------------------------------------------------ |
| No model chosen             | *"No model selected"*, with guidance to search for a model in the card above.                                                                    |
| Model without an assessment | *"This model has no assessment yet."* For administrators: use **Assess performance** to request the first one; for others: ask an administrator. |
| Loading failure             | *"Failed to load the assessment history."*, with the **Try again** button.                                                                       |

## Features

### Semantic model selection

**What it is.** The **Semantic model** card (*"Choose the model to assess"*) has the **Search semantic model...** search, the scope notice and, after the choice, the model name, the workspace and the request and refresh controls.

**What it is for.** Choose which model you want to see the existing assessments of, or request a new one for.

<figure><picture><source srcset="/files/LKnlcHI6hlHOImL3vRyV" media="(prefers-color-scheme: dark)"><img src="https://3938213054-files.gitbook.io/~/files/v0/b/gitbook-x-prod.appspot.com/o/spaces%2FH2bFRBmIfyK3kwVKbldl%2Fuploads%2Fgit-blob-39cde328192e28256b22c4e68b7f0dfd45dc39a7%2Fpm-monitoramento-avaliacao-performance-seletor-modelo-en.png?alt=media" alt="Semantic model card with the search, the scope notice, the chosen model and the Capacity window, Assess performance and Refresh controls"></picture><figcaption><p>Semantic model card with a chosen model</p></figcaption></figure>

**How to use**

1. Go to *Performance › Performance Assessment*.
2. In the **Semantic model** card, type part of the name in the **Search semantic model...** field and click the model in the suggestions.
3. Check the model name and the workspace right below the search. The screen loads its most recent assessment and its **History**.

{% hint style="info" %}
Shortcut: in *Governance › Semantic Models*, open the actions menu (⋮) of the row and choose **Assess performance**. The screen opens with the model already selected. Since the model is in the URL, you can also copy the browser address and send it to anyone with access to the workspace.
{% endhint %}

**How it works**

* The search shows only semantic models from the workspaces in your scope.
* The card notice reminds you: *"The assessment reads only model metadata and capacity metrics. No query is run on the data and nothing is changed in the model: Power-Monitor only recommends."*
* The **Refresh** button reloads the history and the displayed assessment (useful after someone else requests an assessment of the same model).

### Requesting a new assessment

**What it is.** The **Capacity window** selector and the **Assess performance** button, in the **Semantic model** card, which register the request for a new assessment of the chosen model.

**What it is for.** Get an updated snapshot of the model, for example after applying an optimization, or perform the first assessment.

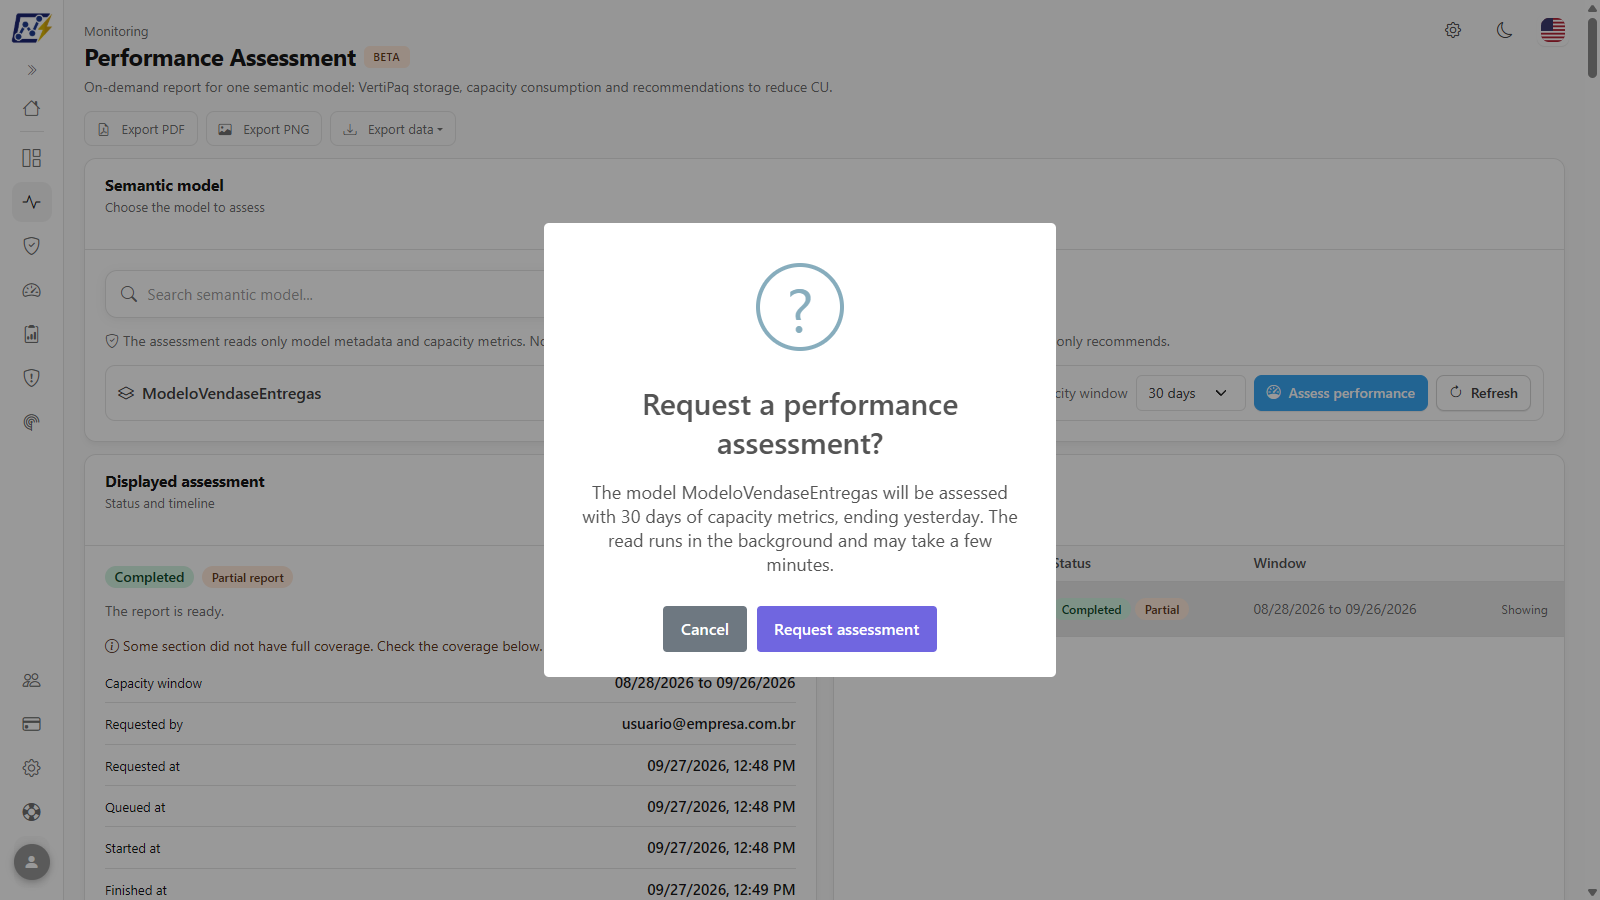
<figure><picture><source srcset="/files/wZDzr3U2C8995RfcikhJ" media="(prefers-color-scheme: dark)"><img src="https://3938213054-files.gitbook.io/~/files/v0/b/gitbook-x-prod.appspot.com/o/spaces%2FH2bFRBmIfyK3kwVKbldl%2Fuploads%2Fgit-blob-6af8f30d7e6a0d322d95f18766a5d3927c552c33%2Fpm-monitoramento-avaliacao-performance-confirmar-en.png?alt=media" alt="Request a performance assessment confirmation dialog"></picture><figcaption><p>Confirmation before requesting the assessment</p></figcaption></figure>

**How to use** (**Administrator** profile; for a complete report, also see the [Prerequisites](#prerequisites))

{% stepper %}
{% step %}

### Choose the capacity window

With the model selected, choose in **Capacity window** the **7 days**, **14 days** or **30 days** (default) option. The window always ends yesterday.
{% endstep %}

{% step %}

### Click Assess performance

The button is disabled when there is already an assessment running for the model (*"An assessment is already running for this model."*).
{% endstep %}

{% step %}

### Confirm the request

In the **Request a performance assessment?** dialog, check the model name and the window and click **Request assessment** (or **Cancel**).
{% endstep %}

{% step %}

### Follow the progress

The message *"Assessment requested. Follow its progress below."* confirms the request and the new assessment starts being displayed. You can leave the screen: the assessment runs in the background and stays in the **History**.
{% endstep %}
{% endstepper %}

**How it works**

* The **Capacity window** defines how many days of capacity metrics are included in the assessment. It always consists of full days and **ends yesterday**, in the organization's time zone.
* There is only **one active assessment per model**; there is no minimum interval between assessments.
* For non-administrators, the selector and the button do not appear and the card shows *"Only organization administrators can request an assessment."*

Possible messages after the request:

| Message                                                       | Meaning                                                                                         |
| ------------------------------------------------------------- | ----------------------------------------------------------------------------------------------- |
| *Assessment requested. Follow its progress below.*            | Request accepted; the new assessment starts being displayed.                                    |
| *An assessment is already running for this model...*          | There can be only one active assessment per model; the screen starts displaying the active one. |
| *Semantic model not found or outside your scope.*             | The model was removed or is in a workspace outside your scope.                                  |
| *Invalid request. Check the selected window.*                 | Window outside the 7 to 30 day range.                                                           |
| *Only organization administrators can request an assessment.* | The user is not an administrator.                                                               |

### Displayed assessment (status and timeline)

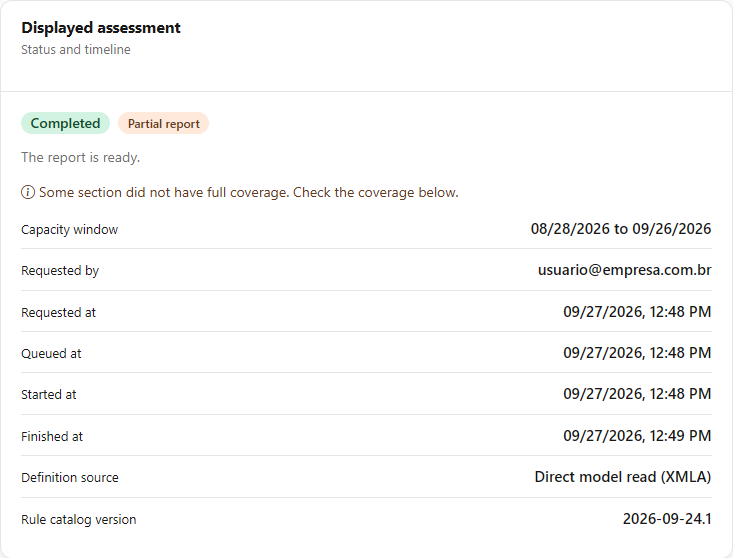
**What it is.** The **Displayed assessment** card (*"Status and timeline"*) shows the status of the selected assessment, a short description of the status and the dates of each step.

**What it is for.** Know whether the report is ready, whether it came out complete or partial and, in case of failure, the reason.

<figure><picture><source srcset="/files/DMNWj295gGSxBA7WUK5j" media="(prefers-color-scheme: dark)"><img src="https://3938213054-files.gitbook.io/~/files/v0/b/gitbook-x-prod.appspot.com/o/spaces%2FH2bFRBmIfyK3kwVKbldl%2Fuploads%2Fgit-blob-06592074b173a51d5a1ee653c1e6fdeacdfe8729%2Fpm-monitoramento-avaliacao-performance-em-execucao-en.png?alt=media" alt="Displayed assessment card with status, coverage badge and the assessment timeline"></picture><figcaption><p>Displayed assessment card</p></figcaption></figure>

**How to use**

1. After requesting or choosing an assessment, read the status badge at the top of the card.
2. If the assessment is in progress, wait: the card refreshes on its own.
3. If it is **Completed** with the **Partial report** badge, go to the [Coverage](#coverage) card to see what was missing. If it is **Failed**, read the **Failure reason**.

**How it works**

| Status                | Meaning                                                                                             |
| --------------------- | --------------------------------------------------------------------------------------------------- |
| **Awaiting dispatch** | The request was registered and is waiting for the next dispatch cycle, which runs every 20 seconds. |
| **Queued**            | The assessment was sent for execution and should start shortly.                                     |
| **Running**           | Reading the model metadata and evaluating the rules.                                                |
| **Completed**         | The report is ready. It also receives the **Full coverage** or **Partial report** badge.            |
| **Failed**            | The assessment did not finish; the card shows the **Failure reason**.                               |

* While the assessment is active (awaiting, queued or running), the page **refreshes on its own every 5 seconds** (*"Refreshing automatically."*) and stops when it reaches Completed or Failed.
* Card rows: **Capacity window**, **Requested by** (masked when **Hide data** is on), **Requested at**, **Queued at**, **Started at**, **Last progress signal** (only while active), **Finished at**, **Definition source** (only when completed) and **Rule catalog version**.
* Possible failure reasons: model removed or inaccessible, organization credentials unavailable, run interrupted (more than 20 minutes without a progress signal), time limit exceeded or unexpected error.

The **Definition source** indicates where the model structure came from, from the most complete to the least complete:

| Source                                  | When it is used                                                                                                |
| --------------------------------------- | -------------------------------------------------------------------------------------------------------------- |
| **Direct model read (XMLA)**            | Successful read through the XMLA endpoint (ideal case).                                                        |
| **Published definition (TMSL)**         | The direct read was not possible; it uses the model definition obtained in the scan.                           |
| **Table sources collected by the scan** | Last resort; security roles, relationships and refresh policy are missing, so some rules may not be evaluated. |
| **No definition**                       | No definition available.                                                                                       |

{% hint style="info" %}
**A partial report is not a failure.** If a source could not be read (for example, the model is on shared capacity and there is no XMLA read), the assessment ends as **Completed** with the **Partial report** badge, and the **Coverage** section explains what was missing. Missing data is never treated as zero.
{% endhint %}

### Assessment history

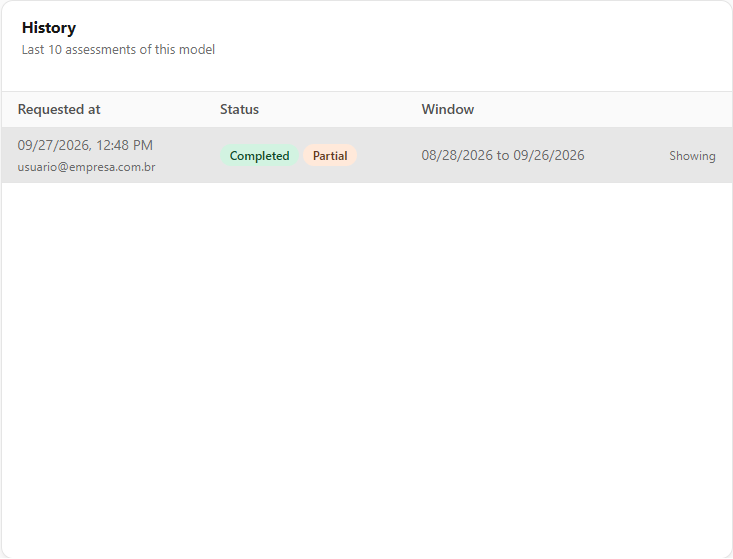
**What it is.** The **History** card lists the model's **last 10 assessments**, from newest to oldest.

**What it is for.** Go back to a previous assessment, for example to compare before and after an optimization.

<figure><picture><source srcset="/files/MKyPnBko44XgpJjQPF6k" media="(prefers-color-scheme: dark)"><img src="https://3938213054-files.gitbook.io/~/files/v0/b/gitbook-x-prod.appspot.com/o/spaces%2FH2bFRBmIfyK3kwVKbldl%2Fuploads%2Fgit-blob-6e5421eb8f28fe5cb448e590cf0d86f5552d6e2f%2Fpm-monitoramento-avaliacao-performance-historico-en.png?alt=media" alt="History card with the model&#x27;s assessments, Requested at, Status and Window columns and the View button"></picture><figcaption><p>History of the model's assessments</p></figcaption></figure>

**How to use**

1. In the **History** card, find the assessment by the date in **Requested at** and by the **Status**.
2. Click **View** on the row. The assessment currently displayed appears marked as **Showing**, and all the cards below start showing the chosen assessment.
3. To reload the history, click **Refresh** in the **Semantic model** card.

**How it works**

| Column           | Content                                                                                                     |
| ---------------- | ----------------------------------------------------------------------------------------------------------- |
| **Requested at** | Date and time of the request, with the user who requested it right below (masked when **Hide data** is on). |
| **Status**       | Assessment status and, if completed with incomplete coverage, the **Partial** badge.                        |
| **Window**       | Capacity metrics period used.                                                                               |
| (action)         | **View** opens that assessment; the one on screen appears as **Showing**.                                   |

* The chosen assessment is in the URL, so the link takes you straight to it.
* When the 11th assessment is requested, the oldest finished one is discarded automatically (together with its AI suggestions). An assessment in progress is never discarded.

### Coverage

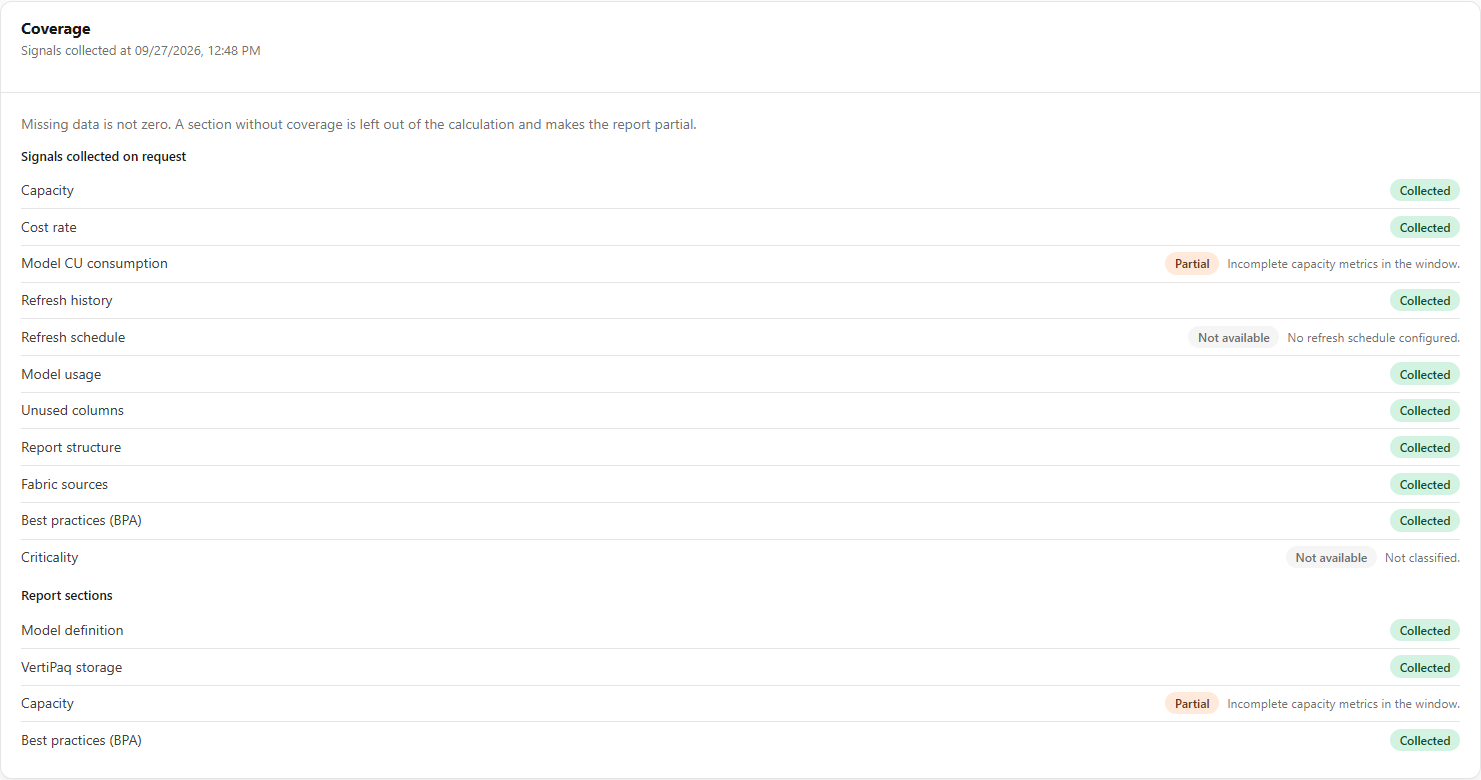
**What it is.** The **Coverage** card (*"What was collected for this assessment"*) lists each signal and each report section with a status: **Collected**, **Partial**, **Not available** or **Failed**, and the reason when applicable.

**What it is for.** Understand why a report came out partial and what to fix so that the next assessment is complete.

<figure><picture><source srcset="/files/2X5ZNhUBPwAp00pp8aaF" media="(prefers-color-scheme: dark)"><img src="https://3938213054-files.gitbook.io/~/files/v0/b/gitbook-x-prod.appspot.com/o/spaces%2FH2bFRBmIfyK3kwVKbldl%2Fuploads%2Fgit-blob-bca54b5da9eb93fa0001723dc4c926cb82773e4f%2Fpm-monitoramento-avaliacao-performance-cobertura-en.png?alt=media" alt="Coverage card with the list of signals and sections and their statuses"></picture><figcaption><p>Coverage: what was collected and what was left out</p></figcaption></figure>

**How to use**

1. Go through the list and look for items with a status other than **Collected**.
2. Read the reason for each one (for example, *"The model is on shared capacity."*, *"No capacity metrics in the window."*, *"No report uses this model."*).
3. Fix the cause, when possible (see [Prerequisites](#prerequisites)), and request a new assessment.

**How it works**

* **Signals collected on request:** Capacity, Model CU consumption, Cost rate, Refresh history, Refresh schedule, Model usage, Unused columns, Report structure, Fabric sources, Best practices (BPA) and Criticality. The signal collection date appears on the card.
* **Report sections** (after completion): Model definition, VertiPaq storage, Capacity and Best practices (BPA). When the model read fails, the reason appears (no access to the workspace, no dedicated capacity, connection timed out, model not found or no access, model too large to read, etc.).
* A section without coverage is left out of the calculation and makes the report partial.

### Recommendations and category filter

**What it is.** The **Recommendations** card summarizes how many recommendations were generated and the rule catalog version, and has the category filter buttons: **All**, **Model**, **Power Query**, **Refresh**, **Storage mode**, **Aggregations**, **Capacity** and **Workload**, each with the number of recommendations.

**What it is for.** See the total number of opportunities and focus on one type of action (for example, only what depends on a modeling change or only what depends on the refresh schedule).

<figure><picture><source srcset="/files/OjEsxoEESO72b44yQtWm" media="(prefers-color-scheme: dark)"><img src="https://3938213054-files.gitbook.io/~/files/v0/b/gitbook-x-prod.appspot.com/o/spaces%2FH2bFRBmIfyK3kwVKbldl%2Fuploads%2Fgit-blob-e4b936213decc014b4192e19af78887a411af0cf%2Fpm-monitoramento-avaliacao-performance-recomendacoes-filtros-en.png?alt=media" alt="Recommendations card with the total, the estimates notice and the category filter buttons"></picture><figcaption><p>Recommendations summary and category filter</p></figcaption></figure>

**How to use**

1. In the **Recommendations** card, click **All** or a category. The number next to each button is the number of recommendations.
2. The recommendation cards below start showing only the chosen category.
3. Prioritize the recommendations with the highest **Estimated gain** and **High confidence**; treat **Heuristic** ones and those with **Low confidence** as hypotheses to validate.

**How it works**

* The card reminds you that *"Power-Monitor only recommends. No change is applied to the model. Gains are estimates based on the window metrics."*
* If no rule found an opportunity, the screen reports *"No evaluated rule found an opportunity in this model."*
* When a Best Practice Analyzer (BPA) rule is equivalent to a recommendation, the BPA finding becomes evidence for it (*"Includes the BPA findings: ..."*) instead of appearing twice; the summary card reports how many BPA rules became evidence.
* The filter buttons are not included in the PDF/PNG exports.

### Recommendation card

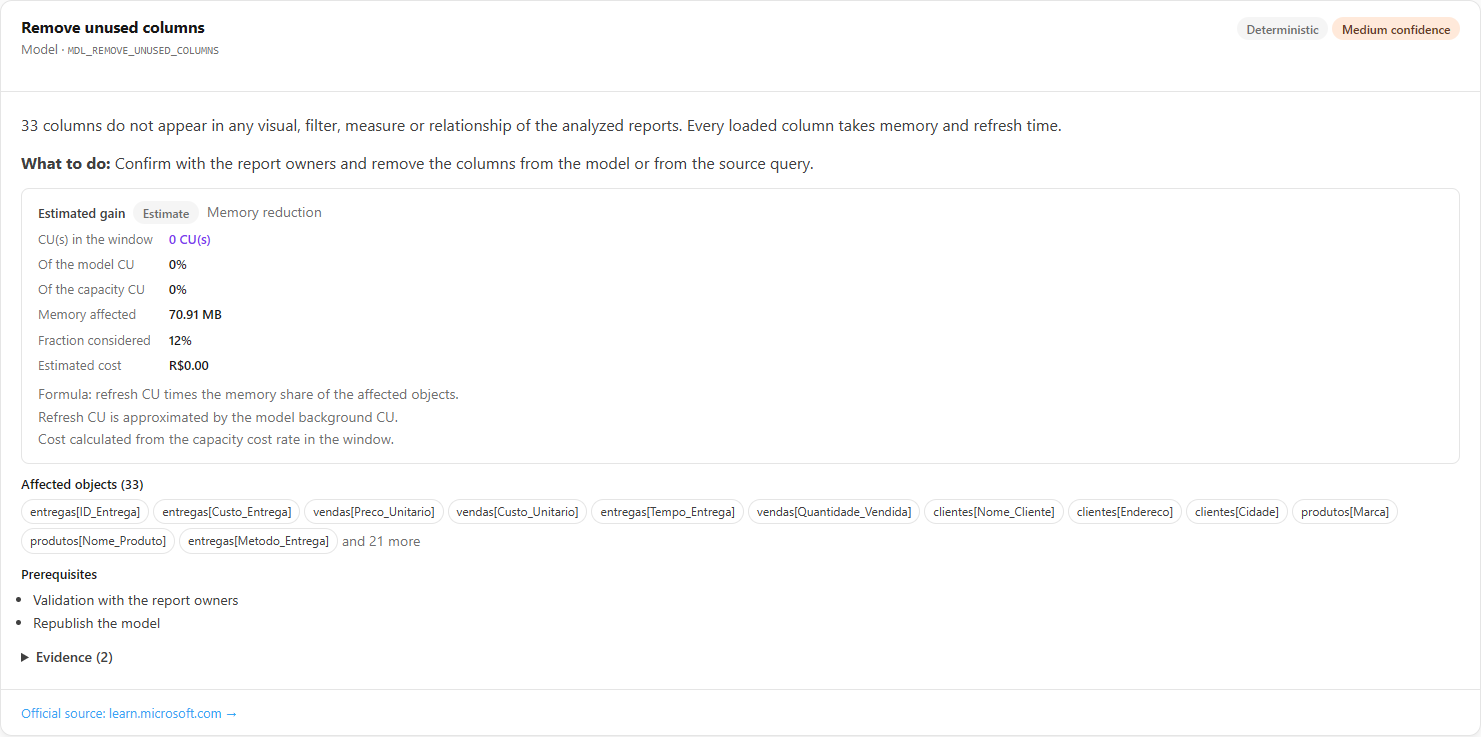
**What it is.** Each recommendation is its own card with a title, category, rule identifier, badges, description, recommended action, estimated gain, affected objects, prerequisites, evidence and a link to the official source.

**What it is for.** Understand exactly what to change in the model, where, why and with what expected gain.

<figure><picture><source srcset="/files/NWSQSG0i3yJStlUPU3wB" media="(prefers-color-scheme: dark)"><img src="https://3938213054-files.gitbook.io/~/files/v0/b/gitbook-x-prod.appspot.com/o/spaces%2FH2bFRBmIfyK3kwVKbldl%2Fuploads%2Fgit-blob-67dabe05b06083eff3ff529cc459f53d4f8c7439%2Fpm-monitoramento-avaliacao-performance-recomendacao-en.png?alt=media" alt="Recommendation card with badges, estimated gain, affected objects and prerequisites"></picture><figcaption><p>A recommendation with estimated gain</p></figcaption></figure>

**How to use**

1. Read the badges in the corner of the card to know the type of conclusion and the confidence.
2. Read the description and **What to do:** (recommended action).
3. Check the **Affected objects (N)** and the **Prerequisites** before planning the change.
4. Use the **Estimated gain** to prioritize among recommendations.

**How it works**

* **Badges:**
  * **Deterministic** (direct conclusion from the metadata read) or **Heuristic** (inference from patterns; confirm before applying);
  * **Preview** / **Partly in preview**, when the recommended feature is not yet GA at Microsoft;
  * **High / Medium / Low confidence**;
  * **Microsoft threshold** or **Power-Monitor threshold**, indicating whether the cutoff number comes from the official documentation or was defined by Power Monitor when Microsoft does not publish a value.
* **Affected objects (N):** tables, columns or queries involved (the first 12, and "and N more").
* **Prerequisites** (for example, *Premium or Fabric capacity*, *Republish the model*, *Validation with the report owners*) and **About the confidence** (why the confidence was lowered, for example *"Folding is estimated by heuristic, without running the query."*).

#### Estimated gain

Always labeled **Estimate**, calculated from the metrics of the capacity window. It can contain:

| Field                                        | Meaning                                                                                                                           |
| -------------------------------------------- | --------------------------------------------------------------------------------------------------------------------------------- |
| **CU(s) in the window**                      | Capacity Units (s) that the change can save in the window. With the **Upper bound** badge, the value is displayed as "up to ...". |
| **Of the model CU** / **Of the capacity CU** | The gain as a percentage of the model's and the capacity's consumption.                                                           |
| **Memory affected**                          | In-memory size of the objects involved.                                                                                           |
| **Fraction considered**                      | Portion of the consumption used in the calculation.                                                                               |
| **Estimated cost**                           | Monetary value, only when there is a capacity cost rate for the window.                                                           |

The gain type appears next to the title: **CU reduction**, **Memory reduction**, **Shifted CU**, **Risk reduction** or **Guidance**. The formula used is described below the numbers (for example, *"refresh CU times the memory share of the affected objects"*). When the refresh CU is approximated by the model's background CU, the screen warns you.

{% hint style="warning" %}
**Shifted CU is not a net gain.** In *Workload* recommendations, the consumption leaves the model refresh and moves to another workload (for example, a pipeline or notebook), which also consumes capacity CU.
{% endhint %}

Risk or guidance recommendations have no quantified CU gain. And when capacity metrics are missing, the screen says *"No capacity metric to estimate the gain. That does not mean zero gain."*

### Evidence and official source

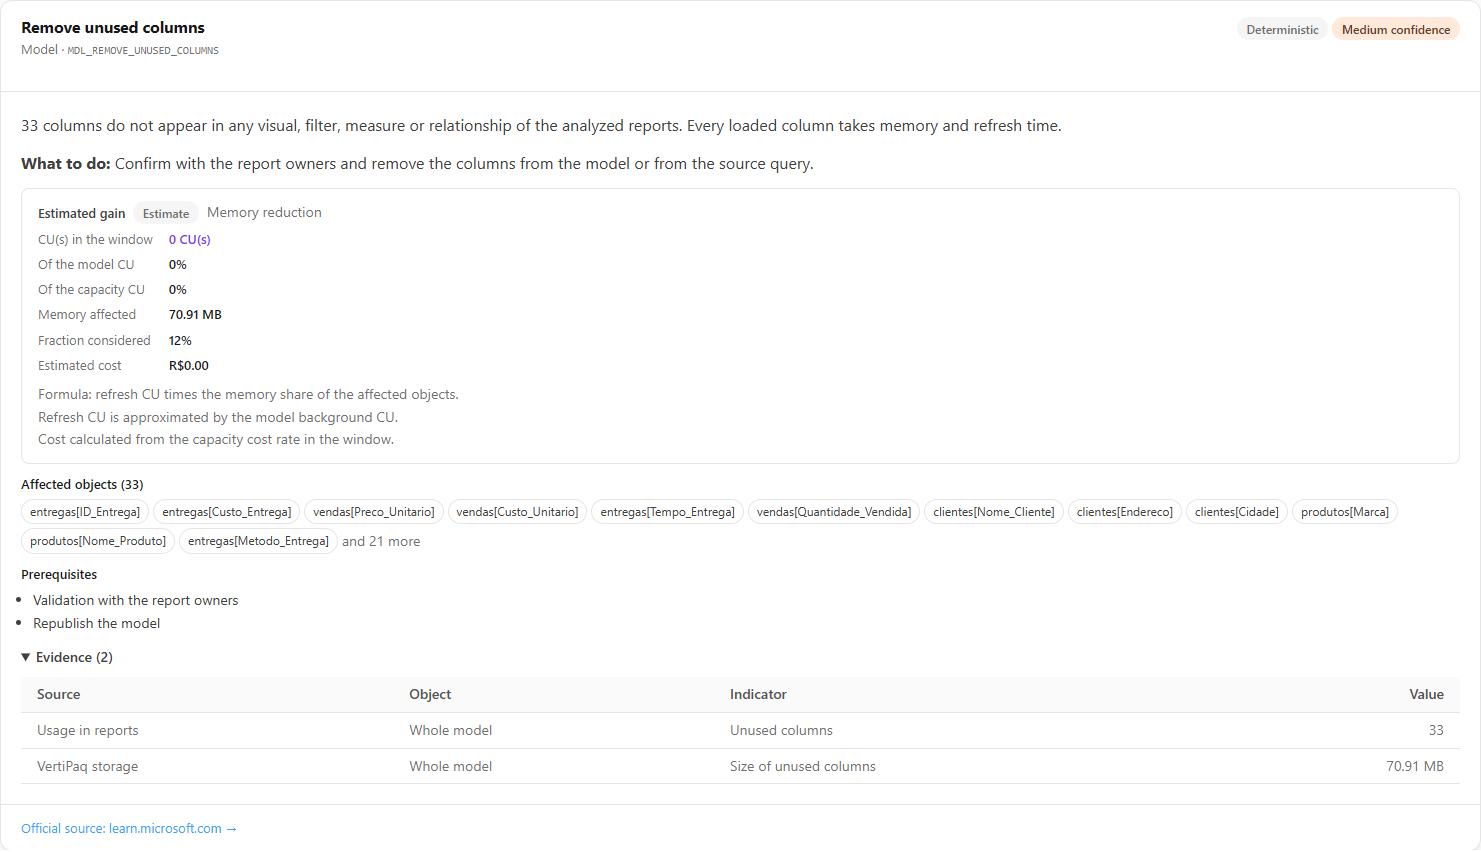
**What it is.** The expandable **Evidence (N)** area, at the end of each recommendation, and the **Official source** link, in the card footer.

**What it is for.** Audit the recommendation: see the exact numbers that triggered the rule and read the Microsoft documentation that supports it before taking the change to the development team.

<figure><picture><source srcset="/files/gFDO8DF9X3cYtEDbI1ey" media="(prefers-color-scheme: dark)"><img src="https://3938213054-files.gitbook.io/~/files/v0/b/gitbook-x-prod.appspot.com/o/spaces%2FH2bFRBmIfyK3kwVKbldl%2Fuploads%2Fgit-blob-f9f470b82369887b55822180f0b7e31ee1af6a02%2Fpm-monitoramento-avaliacao-performance-recomendacao-evidencias-en.png?alt=media" alt="Recommendation card with the Evidence table expanded and the Official source link"></picture><figcaption><p>Expanded evidence and link to the official source</p></figcaption></figure>

**How to use**

1. On a recommendation card, click **Evidence (N)** to expand the table.
2. Read the **Source**, **Object**, **Indicator** and **Value** columns. When the evidence applies to the whole model, the **Object** column shows **Whole model** instead of a table or column name.
3. Click the **Official source** link to open, in another tab, the Microsoft Learn page that supports the rule. When the rule has other sources, they appear next to it.

**How it works:** the PDF/PNG export captures the page as it is on screen, so expand the evidence before exporting if you want it included in the file.

### Rules not evaluated

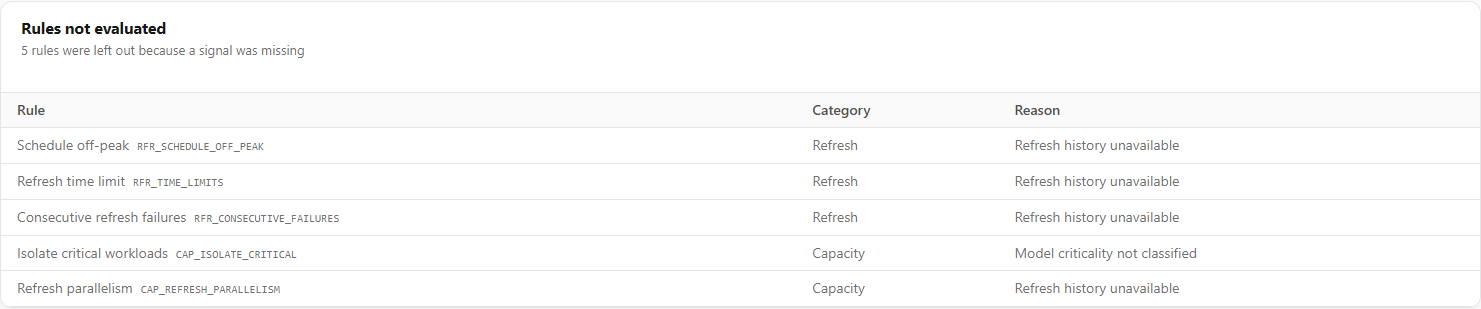
**What it is.** **Rules not evaluated** card, displayed below the recommendations only when some rule in the catalog could not be evaluated due to a missing signal. Columns **Rule**, **Category** and **Reason**.

**What it is for.** Know which analyses were left out and what is missing for them to be included in the next assessment.

<figure><picture><source srcset="/files/1z3anSqKmmtmztJDMmvR" media="(prefers-color-scheme: dark)"><img src="https://3938213054-files.gitbook.io/~/files/v0/b/gitbook-x-prod.appspot.com/o/spaces%2FH2bFRBmIfyK3kwVKbldl%2Fuploads%2Fgit-blob-d3d23149e8a723171b53d4c0942d6e18b5a5819c%2Fpm-monitoramento-avaliacao-performance-regras-nao-avaliadas-en.png?alt=media" alt="Rules not evaluated card with the Rule, Category and Reason columns"></picture><figcaption><p>Rules that were left out and the reason</p></figcaption></figure>

**How to use**

1. Read the **Reason** for each rule (for example, *Model definition unavailable*, *Capacity metrics unavailable*, *Usage in reports not collected*, *Model criticality not classified*).
2. Resolve the cause (for example, enable [capacity monitoring](/en/power-monitor/monitoramento/capacidades/ativar-monitoramento-de-capacidade.md) or classify the model's criticality).
3. Request a new assessment to increase coverage.

### Rule coverage

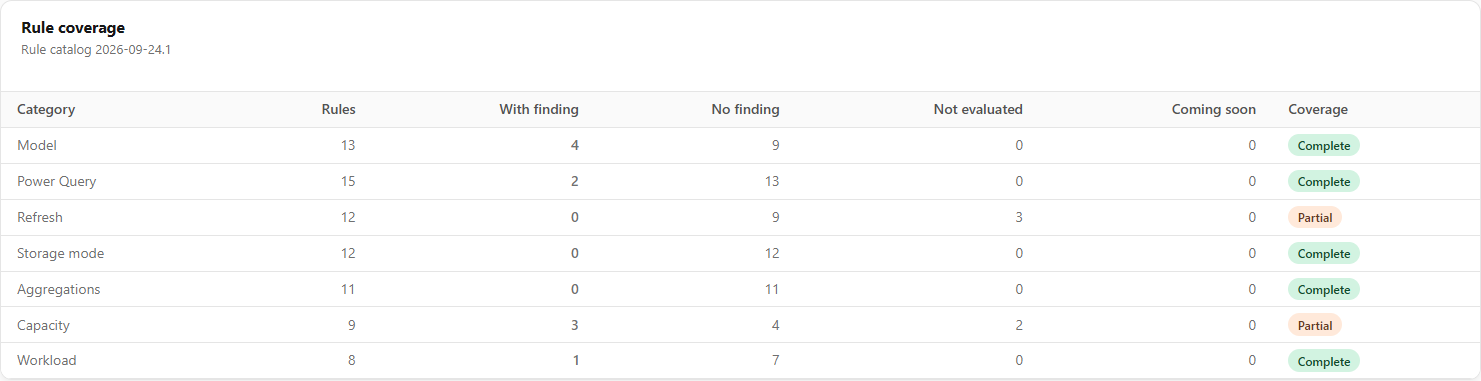
**What it is.** The **Rule coverage** card summarizes, per catalog category, how many rules found an opportunity, how many found no problem and how many were left out.

**What it is for.** Get a view of how complete the analysis was: a category with no recommendations and with **Complete** coverage means the rules were evaluated and nothing was found, which is different from not having been evaluated.

<figure><picture><source srcset="/files/IxQMh1FtgMIviNg2kQV8" media="(prefers-color-scheme: dark)"><img src="https://3938213054-files.gitbook.io/~/files/v0/b/gitbook-x-prod.appspot.com/o/spaces%2FH2bFRBmIfyK3kwVKbldl%2Fuploads%2Fgit-blob-99ce49dd4625f760feaae3bdacac18cf829fdc35%2Fpm-monitoramento-avaliacao-performance-cobertura-regras-en.png?alt=media" alt="Rule coverage card with the per-category table and the coverage badge of each one"></picture><figcaption><p>Rule coverage by category</p></figcaption></figure>

**How to use**

1. Look for the categories with the **Partial** badge: they have rules in **Not evaluated**.
2. Use the [Rules not evaluated](#rules-not-evaluated) card to see which rules and why.

**How it works**

| Column            | Meaning                                                                                                          |
| ----------------- | ---------------------------------------------------------------------------------------------------------------- |
| **Category**      | Model, Power Query, Refresh, Storage mode, Aggregations, Capacity, Workload.                                     |
| **Rules**         | Total rules of the category in the catalog.                                                                      |
| **With finding**  | Rules that found an opportunity (became a recommendation).                                                       |
| **No finding**    | Evaluated rules that found no problem.                                                                           |
| **Not evaluated** | Rules that were left out due to a missing signal.                                                                |
| **Coming soon**   | Planned rules that are not yet evaluated in this version.                                                        |
| **Coverage**      | **Complete**, **Partial** or **Coming soon** (category not yet implemented, which is not an assessment failure). |

### AI suggestion

**What it is.** A section **separate** from the deterministic recommendations, available only for a **Completed** assessment. An AI provider receives the assessment metrics and the rule findings and returns a complementary reading in text. It **does not replace** the deterministic recommendations, which remain the reference.

**What it is for.** Get a natural-language reading that connects the findings and suggests an order of attack, useful for explaining the report to non-specialists.

<figure><picture><source srcset="/files/y1cRTPjtJDtcvNnMeAGf" media="(prefers-color-scheme: dark)"><img src="https://3938213054-files.gitbook.io/~/files/v0/b/gitbook-x-prod.appspot.com/o/spaces%2FH2bFRBmIfyK3kwVKbldl%2Fuploads%2Fgit-blob-239509c4f2ad04afad81154639a1b4c8f34e67bc%2Fpm-monitoramento-avaliacao-performance-sugestao-ia-en.png?alt=media" alt="AI suggestion card with the Generate AI suggestion button and the explanation of what is sent"></picture><figcaption><p>AI suggestion card</p></figcaption></figure>

**How to use** (**Administrator** profile, **Completed** assessment and AI provider configured with available budget in *Settings › AI*)

{% stepper %}
{% step %}

### Click Generate AI suggestion

In the **AI suggestion** card, click **Generate AI suggestion**. If the button is disabled, hover over it to see the reason (provider not configured or spending limit reached).
{% endstep %}

{% step %}

### Confirm

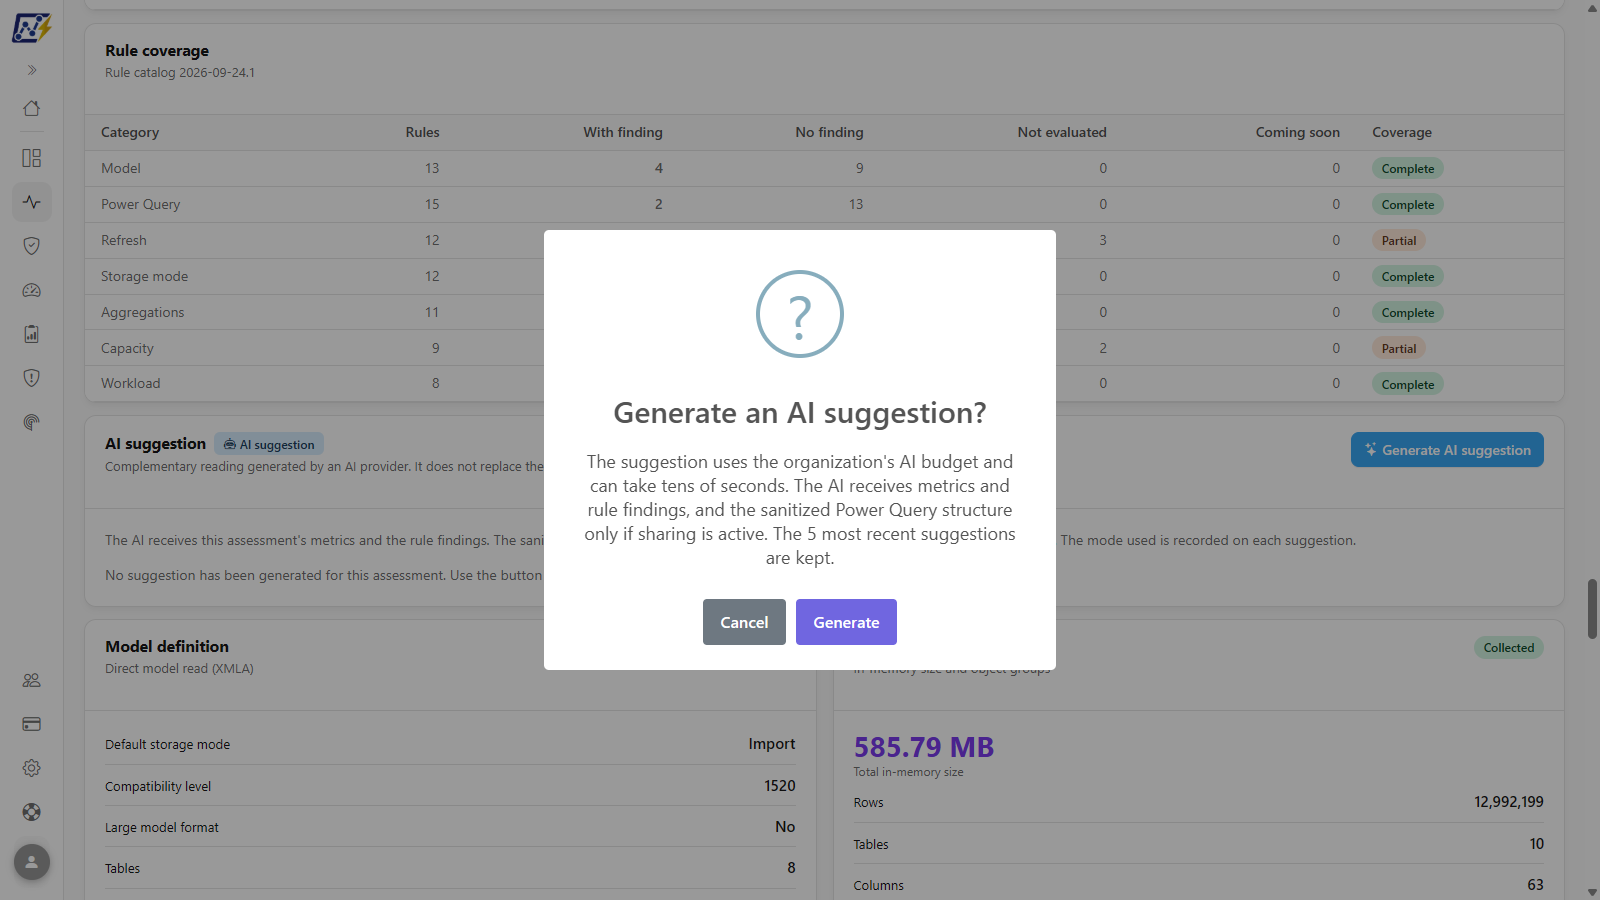
In the **Generate an AI suggestion?** dialog, read what will be sent to the provider and click **Generate** (or **Cancel**).

<figure><picture><source srcset="/files/lPTzHIAI97rCf0fW6I3i" media="(prefers-color-scheme: dark)"><img src="https://3938213054-files.gitbook.io/~/files/v0/b/gitbook-x-prod.appspot.com/o/spaces%2FH2bFRBmIfyK3kwVKbldl%2Fuploads%2Fgit-blob-febf4f9dc39c9ab2eff282e172649d21e79ef649%2Fpm-monitoramento-avaliacao-performance-sugestao-ia-confirmar-en.png?alt=media" alt="Generate an AI suggestion dialog with the explanation of budget consumption and of what is sent"></picture><figcaption><p>Confirmation before generating the AI suggestion</p></figcaption></figure>
{% endstep %}

{% step %}

### Wait and read the suggestion

The **AI suggestion** modal opens and shows **Generating AI suggestion...** while the response is produced, which can take tens of seconds. The new suggestion is also added to the card's list.
{% endstep %}
{% endstepper %}

To reopen a suggestion already generated (any profile), click **View** on its row.

**How it works**

* The call consumes the organization's AI budget.
* Each suggestion appears in the list with the date and time, AI provider and model, who generated it and the **input mode** (hover over the badge to see the description):
  * **Metrics only**: metrics and rule findings were sent, including table and column names, without any Power Query snippet;
  * **Metrics and sanitized Power Query**: the Power Query structure was also sent, with literals, numbers, steps and comments masked. This only happens when sharing is enabled in *Settings › AI*.
* The **5 most recent suggestions** of each assessment are kept.
* AI suggestions are **not** included in the **Export data** export, and the modal is not included in the page's PDF/PNG export.

### Model definition

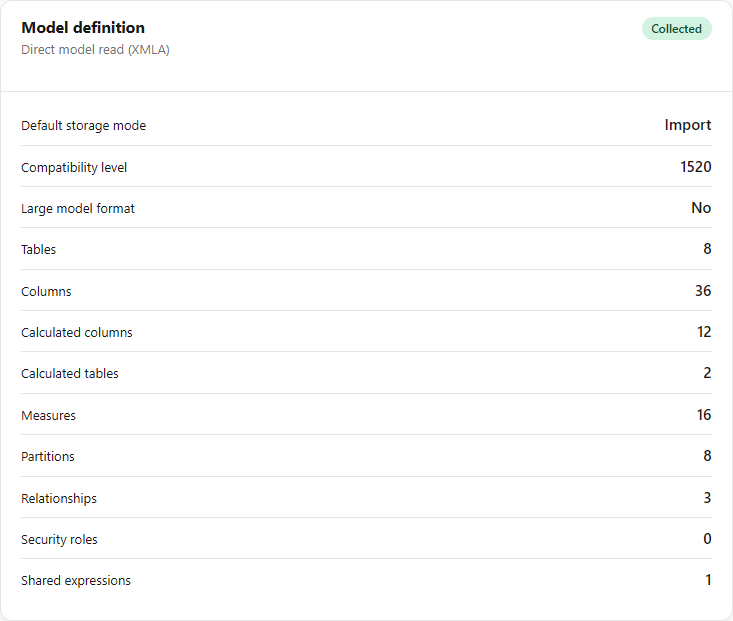
**What it is.** First card of the **VertiPaq** section, with the definition source and the coverage status, and the numbers of the model structure.

**What it is for.** Quickly check the type and structural size of the model (storage mode, number of tables, measures, relationships, etc.) before reading the recommendations.

<figure><picture><source srcset="/files/QUHmAO2FBMZMlrDJFDVT" media="(prefers-color-scheme: dark)"><img src="https://3938213054-files.gitbook.io/~/files/v0/b/gitbook-x-prod.appspot.com/o/spaces%2FH2bFRBmIfyK3kwVKbldl%2Fuploads%2Fgit-blob-930ab7c44ecb58bd7a449d1917a31a539cabab9b%2Fpm-monitoramento-avaliacao-performance-definicao-modelo-en.png?alt=media" alt="Model definition card with storage mode, compatibility level and object counts"></picture><figcaption><p>Model definition</p></figcaption></figure>

**How it works**

* Items: **Default storage mode** (Import, DirectQuery, Dual, Direct Lake...), **Compatibility level**, **Large model format**, **Tables**, **Columns**, **Calculated columns**, **Calculated tables**, **Measures**, **Partitions**, **Relationships**, **Security roles** and **Shared expressions**.
* If an expression exceeded the read limit and was cut, the screen warns you, and the rules that depend on it have lower confidence.
* The VertiPaq section only appears when the completed assessment has model data.

### VertiPaq storage

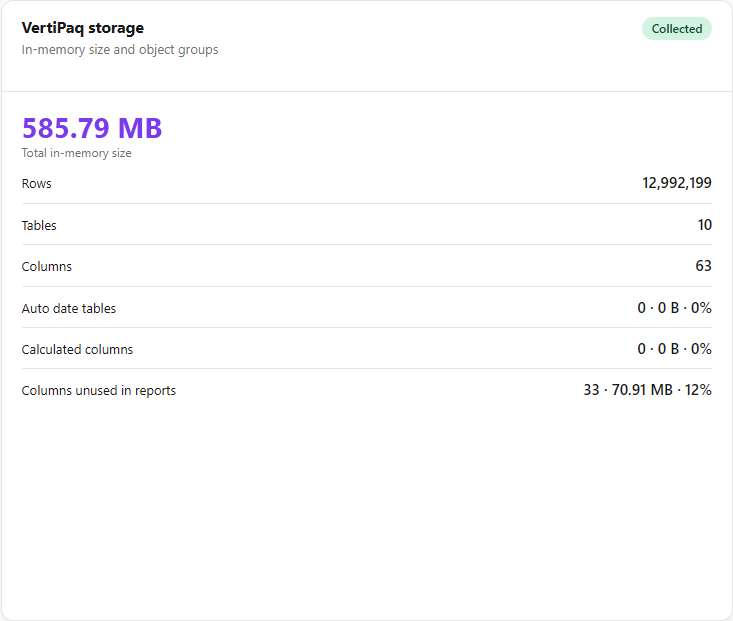
**What it is.** Card with the model's **Total in-memory size** highlighted and the breakdown by object groups.

**What it is for.** Know how much memory the model takes and how much of it comes from objects that can be eliminated (auto dates, calculated columns, unused columns).

<figure><picture><source srcset="/files/Uqcled0u0CwLnOUNa5rG" media="(prefers-color-scheme: dark)"><img src="https://3938213054-files.gitbook.io/~/files/v0/b/gitbook-x-prod.appspot.com/o/spaces%2FH2bFRBmIfyK3kwVKbldl%2Fuploads%2Fgit-blob-bf86603e516237b23c33bfd4d342dbaa079790eb%2Fpm-monitoramento-avaliacao-performance-vertipaq-en.png?alt=media" alt="VertiPaq storage card with the total in-memory size and the object groups"></picture><figcaption><p>VertiPaq storage</p></figcaption></figure>

**How it works**

* Items: **Rows**, **Tables**, **Columns**, **Auto date tables**, **Calculated columns** and **Columns unused in reports** (count, size and share of the model).
* **Requires large model format** or **Above the default format limit** badges when applicable.
* Models without VertiPaq storage (DirectQuery, Live or Direct Lake not loaded) show the reason instead of the numbers.

### Largest tables

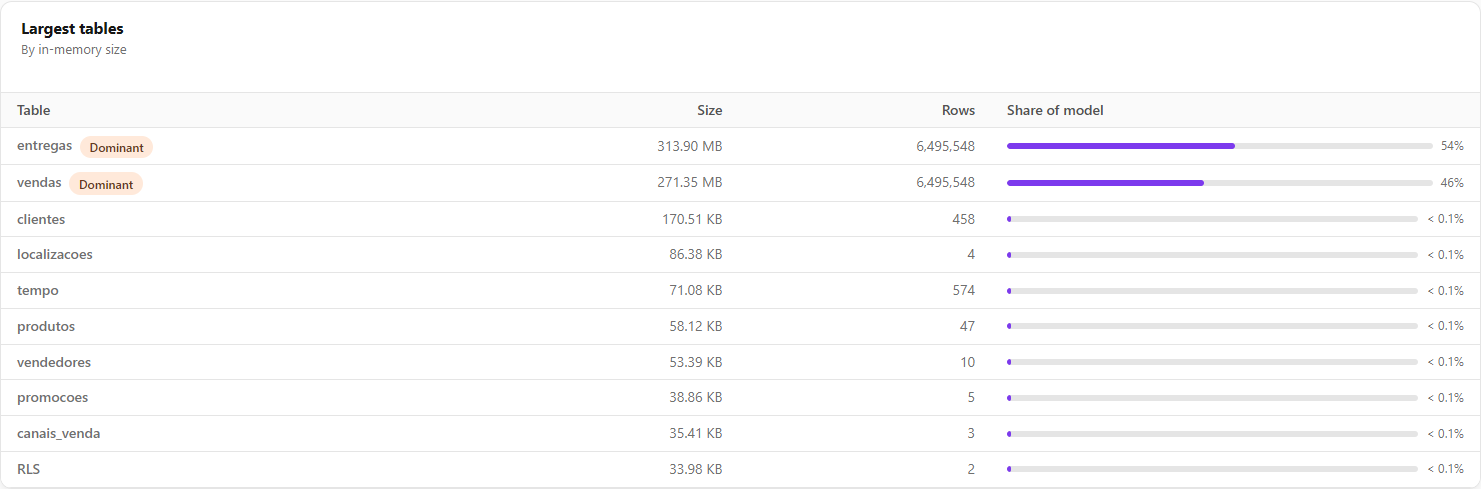
**What it is.** **Largest tables** card (*"By in-memory size"*), with the tables that take up the most memory.

**What it is for.** Identify where to focus the memory optimization effort.

<figure><picture><source srcset="/files/Txr5bnWkQ0mHnUQ5Seyv" media="(prefers-color-scheme: dark)"><img src="https://3938213054-files.gitbook.io/~/files/v0/b/gitbook-x-prod.appspot.com/o/spaces%2FH2bFRBmIfyK3kwVKbldl%2Fuploads%2Fgit-blob-306f6a7b0017b48238c95faa79083f9128050947%2Fpm-monitoramento-avaliacao-performance-maiores-tabelas-en.png?alt=media" alt="Largest tables card with size, rows and share of model for each table"></picture><figcaption><p>Largest tables of the model</p></figcaption></figure>

**How it works:** **Table**, **Size**, **Rows** and **Share of model** columns (with a proportional bar), with the **Dominant**, **Auto date** and **Calculated table** badges.

### Columns

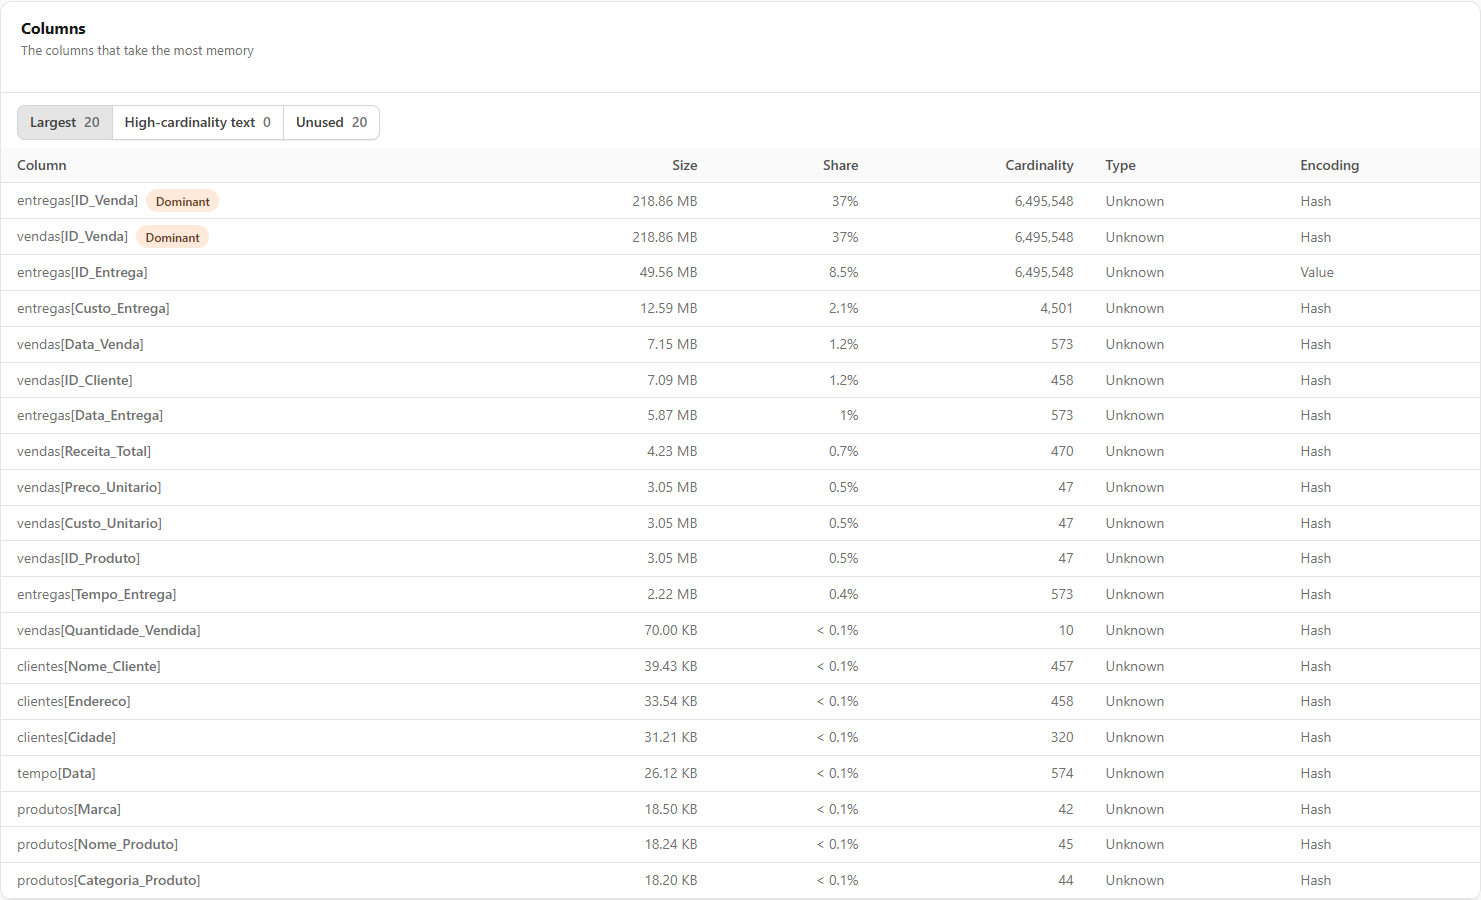
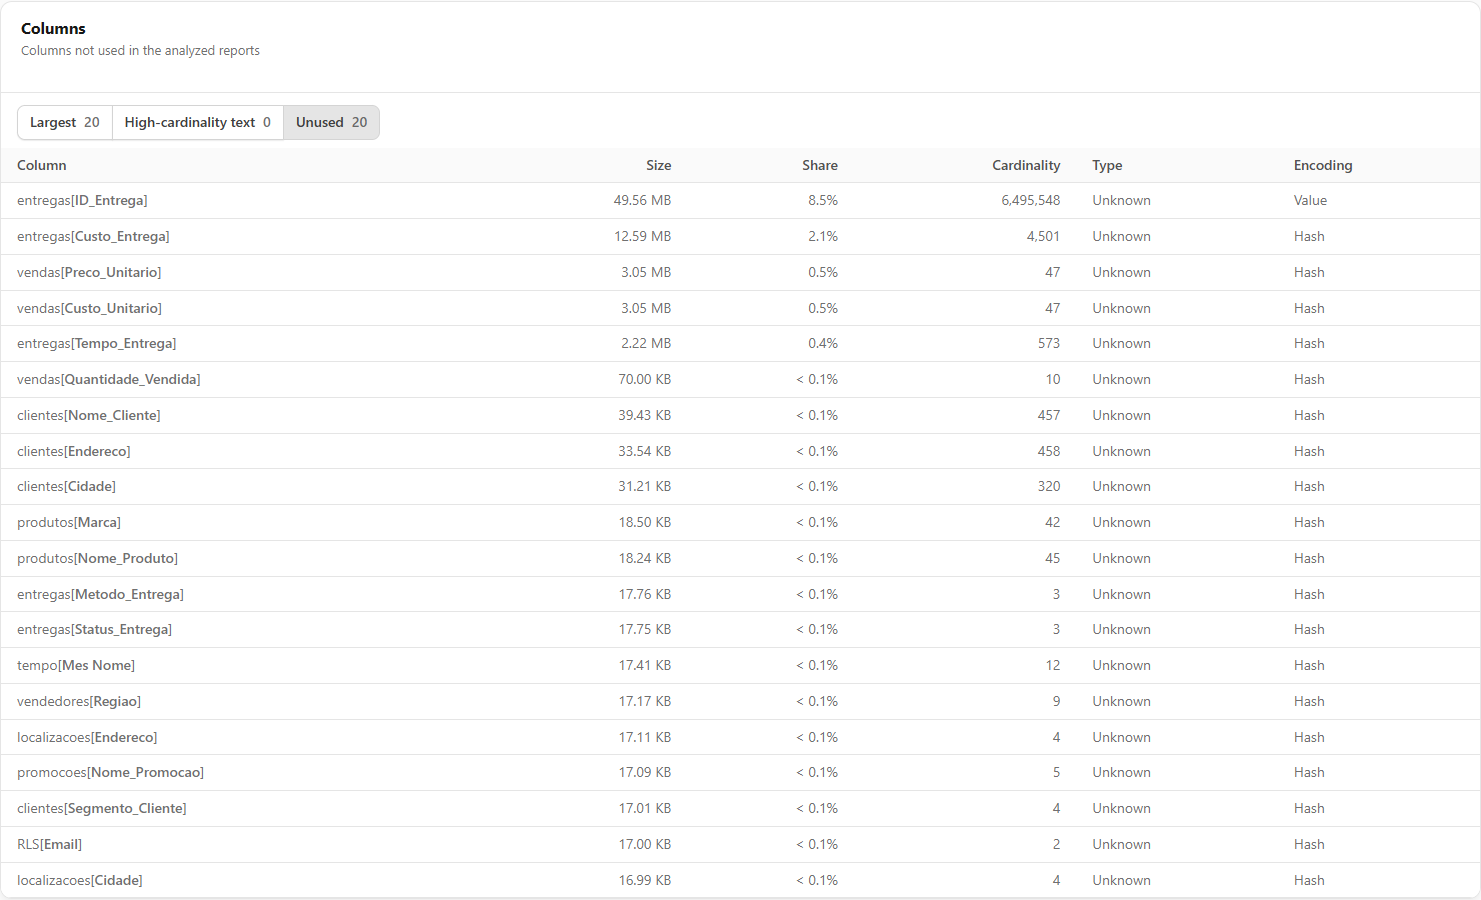
**What it is.** **Columns** card with three selectable views: **Largest** (the columns that take up the most memory), **High-cardinality text** (hash-encoded text with many distinct values) and **Unused** (columns not used in the analyzed reports). Each button shows the number of columns in the view.

**What it is for.** Find the columns that are candidates for removal or for type and cardinality adjustment, which are usually the cheapest memory optimizations.

<figure><picture><source srcset="/files/SqIexbwPHKkP3HSpavnS" media="(prefers-color-scheme: dark)"><img src="https://3938213054-files.gitbook.io/~/files/v0/b/gitbook-x-prod.appspot.com/o/spaces%2FH2bFRBmIfyK3kwVKbldl%2Fuploads%2Fgit-blob-42c44a11e8354a33742d5129504b26f0b89e3140%2Fpm-monitoramento-avaliacao-performance-colunas-en.png?alt=media" alt="Columns card in the Largest view, with size, share, cardinality, type and encoding"></picture><figcaption><p>Columns that take up the most memory</p></figcaption></figure>

**How to use**

1. In the **Columns** card, click **Largest**, **High-cardinality text** or **Unused**.
2. Read the table columns: **Column** (in the table\[column] format, with the **Dominant** and **Calculated** badges), **Size**, **Share**, **Cardinality**, **Type** and **Encoding**.

<figure><picture><source srcset="/files/j1Li5ZqXc0cwCDnfdtfK" media="(prefers-color-scheme: dark)"><img src="https://3938213054-files.gitbook.io/~/files/v0/b/gitbook-x-prod.appspot.com/o/spaces%2FH2bFRBmIfyK3kwVKbldl%2Fuploads%2Fgit-blob-55cc692f21c851d0e0bc312c8d61088a4626ed18%2Fpm-monitoramento-avaliacao-performance-colunas-nao-usadas-en.png?alt=media" alt="Columns card in the Unused view"></picture><figcaption><p>Unused view: columns not used in the analyzed reports</p></figcaption></figure>

**How it works:** if the column usage in reports was not collected, the **Unused** view warns that *"That does not mean every column is used."* instead of showing an empty list.

### Power Query

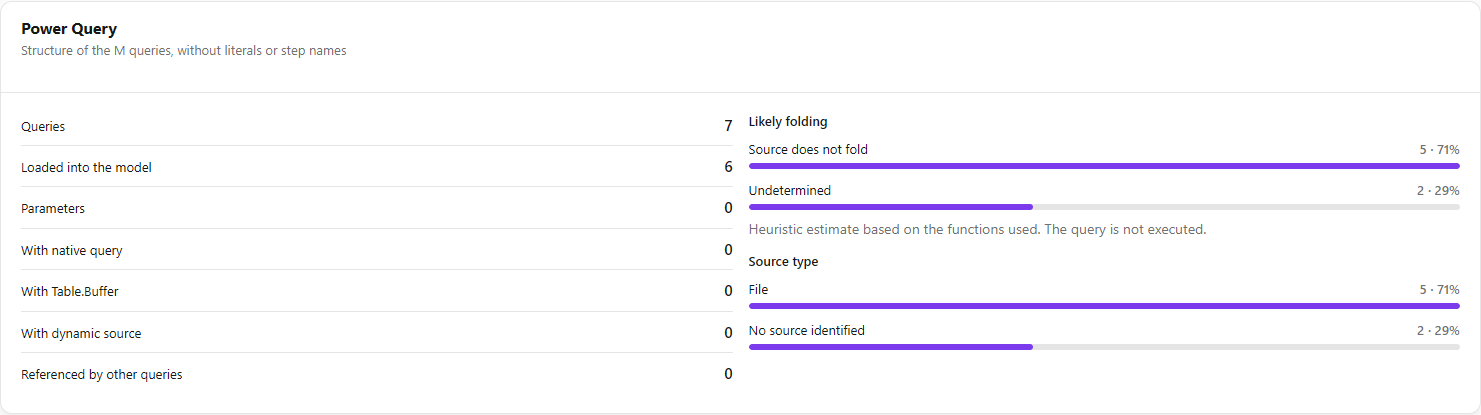
**What it is.** **Power Query** card (*"Structure of the M queries, without literals or step names"*).

**What it is for.** Assess the health of the load queries: how many use a native query, `Table.Buffer` or a dynamic source, and whether they tend to keep *query folding*.

<figure><picture><source srcset="/files/GocVzFz0QiLRqrDfmyCQ" media="(prefers-color-scheme: dark)"><img src="https://3938213054-files.gitbook.io/~/files/v0/b/gitbook-x-prod.appspot.com/o/spaces%2FH2bFRBmIfyK3kwVKbldl%2Fuploads%2Fgit-blob-274d1b84abbf3d28feb7b5ffa5048853cf3bd31a%2Fpm-monitoramento-avaliacao-performance-power-query-en.png?alt=media" alt="Power Query card with query counts and the folding and source type distributions"></picture><figcaption><p>Structure of the Power Query queries</p></figcaption></figure>

**How it works**

* Counts: **Queries**, **Loaded into the model**, **Parameters**, **With native query**, **With Table.Buffer**, **With dynamic source** and **Referenced by other queries**.
* **Likely folding** distributions (Likely folds, Likely breaks, Source does not fold, Undetermined) and **Source type** (Relational, OneLake, File, Generic ODBC or OLE DB, Dataflow).
* Folding is a **heuristic estimate** based on the functions used: the query is not run.

### Capacity and SKU

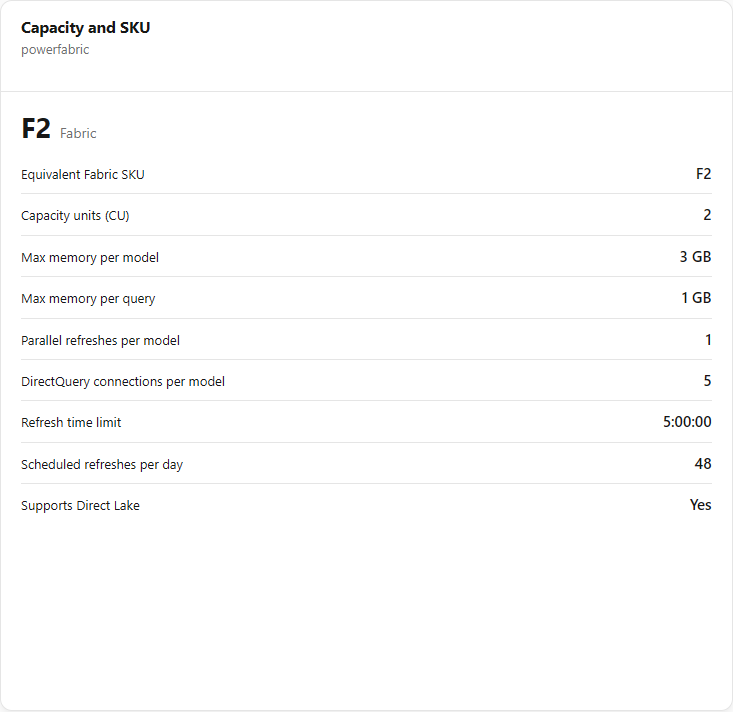
**What it is.** First card of the **Capacity** section: capacity name, SKU and family (Fabric, Power BI Premium, Embedded, Premium Per User...) and the SKU limits.

**What it is for.** Compare the model with the limits of the capacity it runs on (memory per model, parallel refreshes, maximum refresh time, etc.).

<figure><picture><source srcset="/files/hy4UBMO6PfnAT3nNZFoH" media="(prefers-color-scheme: dark)"><img src="https://3938213054-files.gitbook.io/~/files/v0/b/gitbook-x-prod.appspot.com/o/spaces%2FH2bFRBmIfyK3kwVKbldl%2Fuploads%2Fgit-blob-86ab638236b9393533aed5b2c5f323ae7f13a41a%2Fpm-monitoramento-avaliacao-performance-capacidade-en.png?alt=media" alt="Capacity and SKU card with the SKU and its limits"></picture><figcaption><p>Capacity and SKU</p></figcaption></figure>

**How it works**

* **Shared capacity**, **SKU being retired** or **SKU not in catalog** badges.
* SKU limits: **Equivalent Fabric SKU**, **Capacity units (CU)**, **Max memory per model**, **Max memory per query**, **Parallel refreshes per model**, **DirectQuery connections per model**, **Refresh time limit**, **Scheduled refreshes per day** and **Supports Direct Lake**.
* A SKU without limits in the catalog does not receive assumed limits.

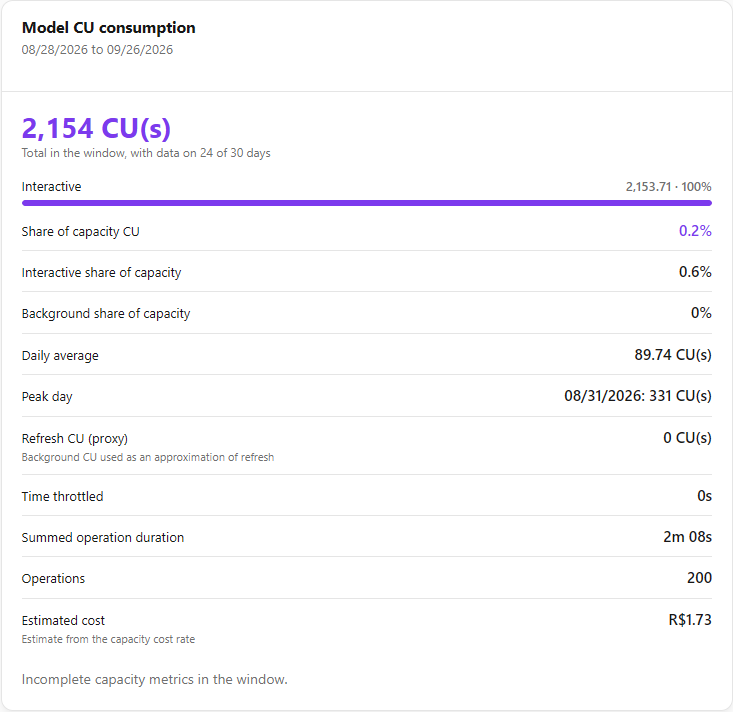
### Model CU consumption

**What it is.** **Model CU consumption** card, for the assessment window (the start and end dates appear in the subtitle).

**What it is for.** Measure the weight of the model on the capacity and find out whether the consumption comes from interactive usage or background processing.

<figure><picture><source srcset="/files/K9yPL8FIqQmeI7SCE3gS" media="(prefers-color-scheme: dark)"><img src="https://3938213054-files.gitbook.io/~/files/v0/b/gitbook-x-prod.appspot.com/o/spaces%2FH2bFRBmIfyK3kwVKbldl%2Fuploads%2Fgit-blob-8bb9303cf46247ab812c3f8bac8b97efeebbe05b%2Fpm-monitoramento-avaliacao-performance-consumo-cu-en.png?alt=media" alt="Model CU consumption card with the total in the window, the interactive and background split and the share of the capacity"></picture><figcaption><p>Model CU consumption in the window</p></figcaption></figure>

**How it works**

| Indicator                                      | Meaning                                                                                                                                             |
| ---------------------------------------------- | --------------------------------------------------------------------------------------------------------------------------------------------------- |
| Total in the window                            | CU(s) of the model in the window, stating on how many days there was data. Bar with the **Interactive**, **Background** and **Unclassified** split. |
| **Share of capacity CU**                       | Percentage of the capacity's total CU consumed by the model (and the interactive and background shares).                                            |
| **Daily average** / **Peak day**               | Average consumption per day and the day with the highest consumption.                                                                               |
| **Refresh CU (proxy)**                         | Background CU used as an approximation of the refresh cost.                                                                                         |
| **Time throttled**                             | Time during which the model's operations were throttled (highlighted when greater than zero).                                                       |
| **Summed operation duration** / **Operations** | Total time and number of operations.                                                                                                                |
| **Estimated cost**                             | Based on the capacity cost rate, when available.                                                                                                    |

Without metrics in the window, the screen warns that *"That does not mean zero consumption."* If the model ran on more than one capacity in the window, the percentages add up the capacities.

### Operations

**What it is.** **Operations** card (*"Breakdown of the model CU in the window"*).

**What it is for.** Find out which operations (queries, refreshes, etc.) account for most of the model's CU.

<figure><picture><source srcset="/files/QVevWBLDxnosbRTALKjf" media="(prefers-color-scheme: dark)"><img src="https://3938213054-files.gitbook.io/~/files/v0/b/gitbook-x-prod.appspot.com/o/spaces%2FH2bFRBmIfyK3kwVKbldl%2Fuploads%2Fgit-blob-5a1a1492db3e0f89dcecb352331e0c79e005e4dc%2Fpm-monitoramento-avaliacao-performance-operacoes-en.png?alt=media" alt="Operations card with operation, type, CU(s), share of model, duration and runs"></picture><figcaption><p>Breakdown of the model CU by operation</p></figcaption></figure>

**How it works:** **Operation**, **Type** (Interactive/Background), **CU(s)**, **Share of model**, **Duration** and **Runs** columns.

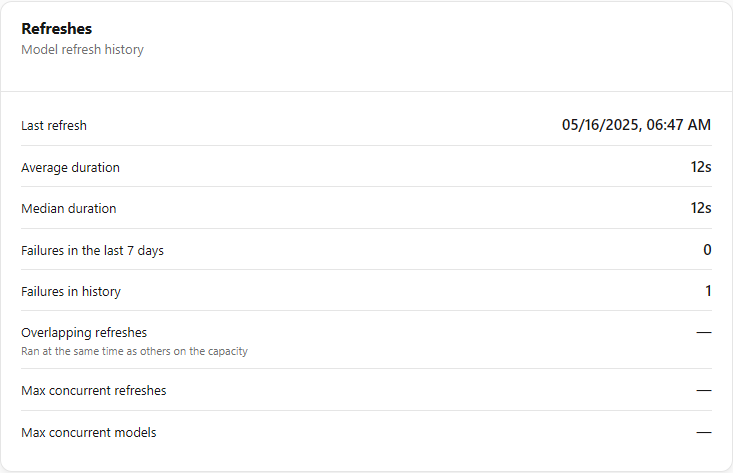
### Refreshes

**What it is.** **Refreshes** card (*"Model refresh history"*).

**What it is for.** Assess the stability and concurrency of the model's refreshes, which influence the schedule and incremental refresh recommendations.

<figure><picture><source srcset="/files/xaaVwoPNZco0aUDW1RKO" media="(prefers-color-scheme: dark)"><img src="https://3938213054-files.gitbook.io/~/files/v0/b/gitbook-x-prod.appspot.com/o/spaces%2FH2bFRBmIfyK3kwVKbldl%2Fuploads%2Fgit-blob-b06473423c637a8e3eee363d90198c903b37edad%2Fpm-monitoramento-avaliacao-performance-atualizacoes-en.png?alt=media" alt="Refreshes card with last refresh, durations, failures and concurrency"></picture><figcaption><p>Model refresh history</p></figcaption></figure>

**How it works:** items **Last refresh**, **Average duration**, **Median duration**, **Failures in the last 7 days**, **Failures in history**, **Overlapping refreshes** (ran at the same time as others on the capacity), **Max concurrent refreshes** and **Max concurrent models**.

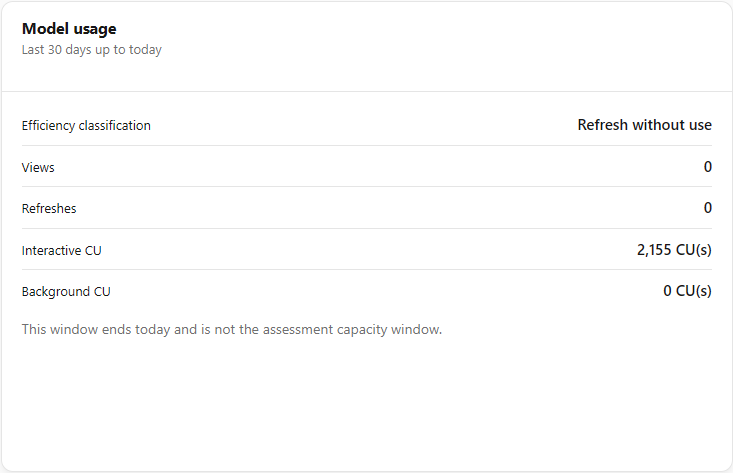
### Model usage

**What it is.** **Model usage** card, with the efficiency classification and the usage and refresh numbers.

**What it is for.** Identify models that consume capacity without delivering value, for example refreshed several times a day and hardly queried.

<figure><picture><source srcset="/files/e7OQFl3fEknXJPVPCpS9" media="(prefers-color-scheme: dark)"><img src="https://3938213054-files.gitbook.io/~/files/v0/b/gitbook-x-prod.appspot.com/o/spaces%2FH2bFRBmIfyK3kwVKbldl%2Fuploads%2Fgit-blob-b538bf4be1d337f1d82b644414cdbf603918b433%2Fpm-monitoramento-avaliacao-performance-uso-do-modelo-en.png?alt=media" alt="Model usage card with the efficiency classification, views, refreshes and CU"></picture><figcaption><p>Model usage and efficiency classification</p></figcaption></figure>

**How it works**

* Items: **Efficiency classification** (Healthy, Ghost artifact, Refresh without use, Over-refreshing), **Views**, **Refreshes**, **Interactive CU** and **Background CU**.
* Note: this window (*"Last N days up to today"*) ends **today** and is not the assessment's capacity window.

### Hide data, Export PDF or PNG

**What it is.** **Hide data** (it becomes **Show data**), **Export PDF** and **Export PNG** buttons in the header, displayed when there is an assessment on screen.

**What it is for.** Share the report as a document or image with the development team or with management.

<figure><picture><source srcset="/files/MtXKPRllhK7PB6HZ5P8t" media="(prefers-color-scheme: dark)"><img src="https://3938213054-files.gitbook.io/~/files/v0/b/gitbook-x-prod.appspot.com/o/spaces%2FH2bFRBmIfyK3kwVKbldl%2Fuploads%2Fgit-blob-ecc4ab773c7b7b9c219b05213cf2ff8e6c81bf7f%2Fpm-monitoramento-avaliacao-performance-exportar-pdf-png-en.png?alt=media" alt="Screen header with the Export PDF, Export PNG and Export data buttons"></picture><figcaption><p>Export buttons in the header</p></figcaption></figure>

**How to use**

1. Expand the sections and evidence that should appear in the file.
2. In the header, click **Export PDF** or **Export PNG**.

**How it works:** the export captures the page as it is on screen (whatever is visible and expanded goes into the file). The controls (buttons, filters, window selector) are omitted from the capture.

**Hide data:** masks the e-mail of whoever requested each assessment (**Displayed assessment** card, **History** and the JSON export of the full report). It is a convenience for sharing the screen or taking screenshots, not an access control; the choice applies to every screen that has the button.

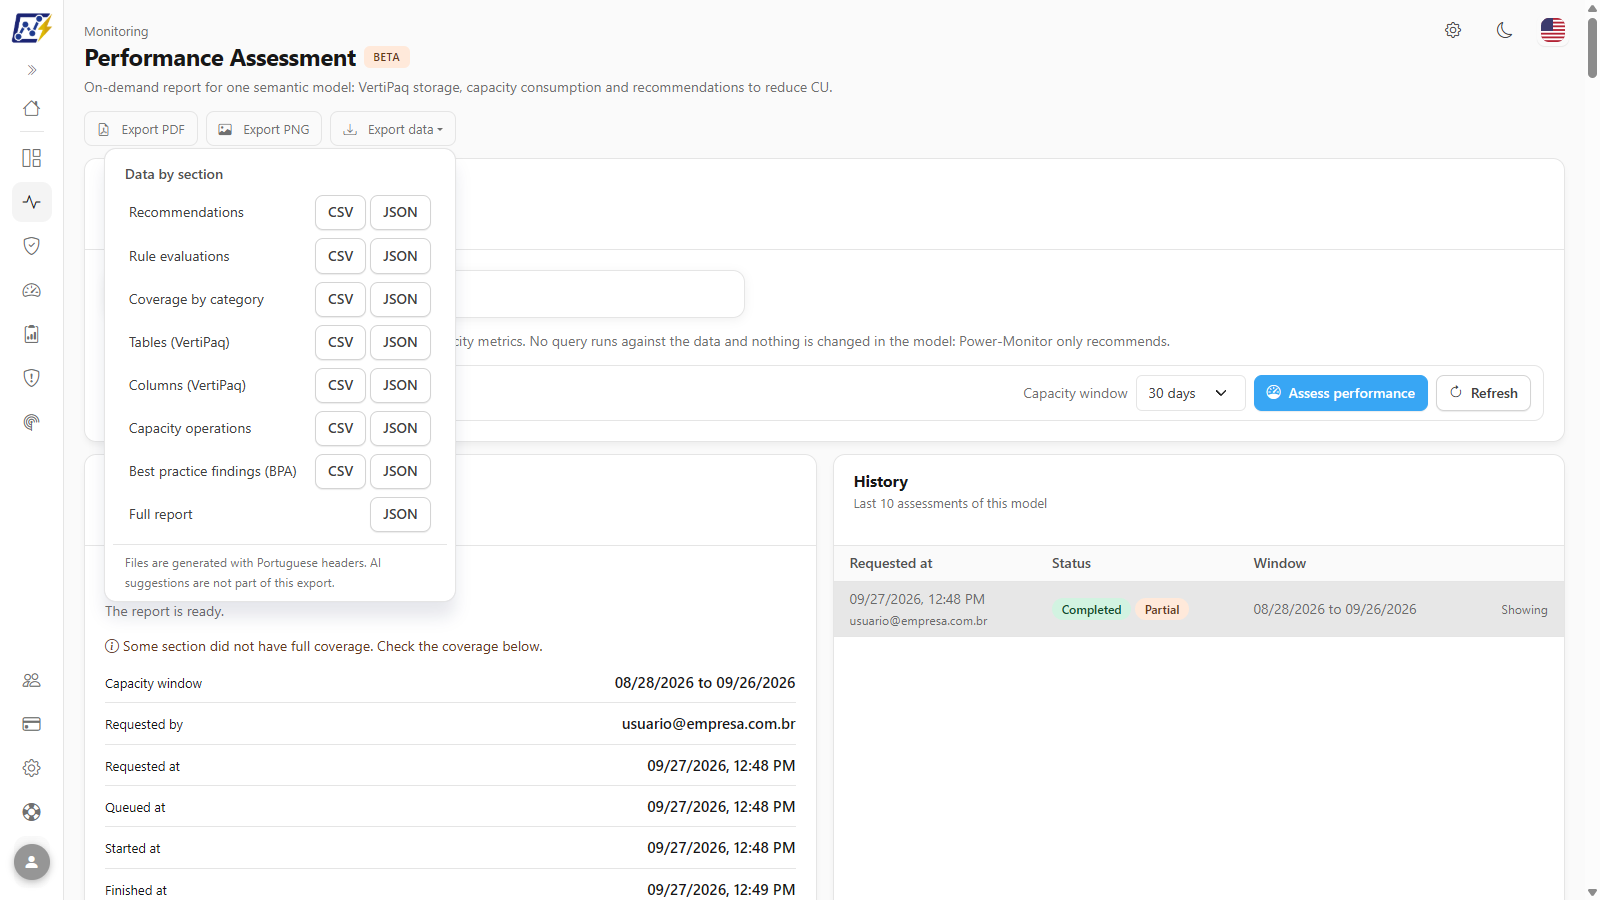
### Export data (CSV or JSON)

**What it is.** **Export data** menu in the header, with one row per report section and the available formats.

**What it is for.** Take the assessment data to a spreadsheet, a backlog or your own analysis tool.

<figure><picture><source srcset="/files/Wp1PF1XgXZooqPXHubZH" media="(prefers-color-scheme: dark)"><img src="https://3938213054-files.gitbook.io/~/files/v0/b/gitbook-x-prod.appspot.com/o/spaces%2FH2bFRBmIfyK3kwVKbldl%2Fuploads%2Fgit-blob-cc1856c36ecea010e8439dbe19444a0a91b60d3e%2Fpm-monitoramento-avaliacao-performance-exportar-dados-en.png?alt=media" alt="Export data menu open with the sections and the CSV and JSON formats"></picture><figcaption><p>Export data menu: one row per section, with the available formats</p></figcaption></figure>

**How to use** (assessment with **Completed** status)

1. In the header, click **Export data**. In other states, the button is disabled with the hint *"Available once the assessment is completed."*
2. In the **Data by section** group, find the desired section and click **CSV** or **JSON**.
3. The file is downloaded with a name starting with `avaliacao-performance`.

**How it works**

| Section                                             | CSV | JSON |
| --------------------------------------------------- | --- | ---- |
| Recommendations (includes the official source link) | Yes | Yes  |
| Rule evaluations (outcome of each catalog rule)     | Yes | Yes  |
| Coverage by category                                | Yes | Yes  |
| Tables (VertiPaq)                                   | Yes | Yes  |
| Columns (VertiPaq)                                  | Yes | Yes  |
| Capacity operations                                 | Yes | Yes  |
| Best practice findings (BPA)                        | Yes | Yes  |
| Full report                                         | -   | Yes  |

* The files are generated with Portuguese headers. AI suggestions are **not** included in this export.
* In a partial report, a section without data comes out as a CSV with only the header (or a JSON indicating that the section is not available).

{% hint style="info" %}
The **best practice findings (BPA)** that did not become evidence for a recommendation are not displayed on screen: they are available only in the *Best practice findings (BPA)* export and in the *Full report*.
{% endhint %}

## Rules and behavior

### Execution

* The assessment is **on demand**: there is no scheduled execution. The request stays **Awaiting dispatch** until the next cycle (every 20 seconds), goes to **Queued** and runs in the background. It usually takes a few minutes, depending on the size of the model.
* There is only **one active assessment per model**. There is no minimum interval between assessments: as soon as the previous one finishes, another can be requested.
* An assessment that goes more than **20 minutes without a progress signal** is marked as **Failed** (*run interrupted*).
* **Retention:** the 10 most recent assessments per model and the 5 most recent AI suggestions per assessment. The result of each assessment is a snapshot frozen at the moment it was made and remains available even if the model is deleted later.
* **Capacity window:** 7, 14 or 30 full days, ending yesterday in the organization's time zone (today is still being collected).

### Rule catalog

The recommendations come from a **deterministic** rule engine with 7 categories (Model, Power Query, Refresh, Storage mode, Aggregations, Capacity and Workload). Every rule has an official Microsoft source; when Microsoft does not publish a cutoff number, the threshold defined by Power Monitor is identified as **Power-Monitor threshold**. The catalog version used is recorded in each assessment, so that old assessments can be compared safely.

### Where the data comes from

| Data                                                                                  | Origin                                                                                                                                                                      |
| ------------------------------------------------------------------------------------- | --------------------------------------------------------------------------------------------------------------------------------------------------------------------------- |
| Model definition and VertiPaq storage                                                 | Metadata-only read through the model's **XMLA endpoint** (falling back to the definition obtained in the scan).                                                             |
| CU consumption, operations and throttling                                             | Capacity metrics collected by [capacity monitoring](/en/power-monitor/monitoramento/capacidades/ativar-monitoramento-de-capacidade.md) (Microsoft Fabric Capacity Metrics). |
| Estimated cost                                                                        | Capacity cost rate, when configured.                                                                                                                                        |
| Refreshes, schedule, usage, unused columns, report structure, lineage and criticality | Data already collected by Power Monitor on the other screens.                                                                                                               |
| Best practices (BPA)                                                                  | Power Monitor's own best practices analysis of the model.                                                                                                                   |

### Prerequisites

None of this prevents the request, but without these items the report comes out **partial**:

* **Dedicated capacity** (Fabric, Premium, Embedded or Premium Per User): on shared capacity (Pro) there is no XMLA read, and the live definition and VertiPaq sections are left out.
* **Organization Service Principal configured** in Power Monitor and with access to the model's workspace (as a workspace member), with the XMLA endpoint tenant setting enabled in the Fabric admin portal. The same permissions as the XMLA-based model size capture apply. Without valid credentials, the coverage shows *"The organization credentials were not available."*
* **Capacity monitoring active** so that there are CU metrics in the window; without them, the gain estimates and the capacity rules are not evaluated.
* For the **AI suggestion**: AI provider configured and budget available in *Settings › AI*.

## Frequently asked questions

<details>

<summary>I don't see the "Assess performance" button. Why?</summary>

Requesting assessments is exclusive to the organization's **Administrators**, because the XMLA read consumes resources of the customer's capacity. Other profiles can view the assessments already made of the models in their scope. If you are an administrator and the button is disabled, there is already an assessment running for the model.

</details>

<details>

<summary>The assessment ended as "Partial report". Did it fail?</summary>

No. Partial means that some data source was not available (for example, shared capacity, lack of XMLA access, lack of capacity metrics in the window). The **Coverage** section shows what was missing and the **Rules not evaluated** card lists the affected rules. Fix the cause and request a new assessment.

</details>

<details>

<summary>The VertiPaq section does not appear or says there is no readable storage.</summary>

Reading the storage depends on the XMLA endpoint: the model must be on dedicated capacity and the Power Monitor Service Principal must have access to the workspace. DirectQuery models, Live connections and Direct Lake models not yet loaded into memory have no VertiPaq storage to read.

</details>

<details>

<summary>Is the estimated gain guaranteed?</summary>

No. It is an **estimate** based on the metrics of the chosen window, and some values are upper bounds ("up to ..."). **Shifted CU** recommendations move the consumption to another workload and are not net savings. Validate each recommendation, especially the **Heuristic** and **Low confidence** ones, before applying.

</details>

<details>

<summary>Does the assessment change my model or read my data?</summary>

No. The assessment reads only metadata (structure, sizes, cardinalities, expressions) and capacity metrics. No query is run on the data, no value is read and no change is made to the model.

</details>

<details>

<summary>What is sent to the AI in the "AI suggestion"?</summary>

The assessment metrics and the rule findings, including table and column names. The Power Query structure is only sent, with literals, numbers, steps and comments masked, if sharing is enabled in *Settings › AI*. The mode used is recorded in each suggestion.

</details>

<details>

<summary>Why is the window of the "Model usage" card different from the assessment window?</summary>

Usage (views and refreshes) is calculated for the last days **up to today**, while the capacity metrics use the window chosen in the request, which ends yesterday. The screen indicates this difference on the card itself.

</details>

## Related pages

* [Monitoring](/en/power-monitor/monitoramento.md)
* [Semantic Models (Governance)](/en/power-monitor/governanca/modelos-semanticos.md)
* [Semantic Models (Monitoring)](/en/power-monitor/monitoramento/modelos-semanticos.md)
* [Average Execution Time](/en/power-monitor/performance/tempo-medio-de-execucao.md)
* [Consumption Metrics](/en/power-monitor/monitoramento/metricas-de-consumo.md)
* [Capacities](/en/power-monitor/monitoramento/capacidades.md)
* [Enable Capacity Monitoring](/en/power-monitor/monitoramento/capacidades/ativar-monitoramento-de-capacidade.md)
* [Model Size (XMLA)](/en/power-monitor/mapeamento/tamanho-de-modelos.md)
* [Settings](/en/power-monitor/configuracoes.md)


---

# Agent Instructions
This documentation is published with GitBook. GitBook is the documentation platform designed so that both humans and AI agents can read, navigate, and reason over technical content effectively. Learn more at gitbook.com.

## Querying This Documentation
If you need additional information that is not directly available in this page, you can query the documentation by asking a question.

Perform an HTTP GET request on the following URL with the `ask` and `goal` query parameters:

```
GET https://docs.powermonitor.com.br/en/power-monitor/performance/avaliacao-de-performance.md?ask=<question>&goal=<user_goal>
```

`ask` is the immediate question: it should be specific, self-contained, and written in natural language.
`goal` is what the user is ultimately trying to achieve, the reason they need the answer. Sharing it helps GitBook give you a better, more relevant answer. A goal is most helpful when it describes the outcome the user wants rather than restating the question. For example, with `ask=how do I create an API token`, a goal like `automate deployments from our CI pipeline` lets GitBook tailor the answer to that use case.

The response will contain a direct answer to the question and relevant excerpts and sources from the documentation.

Use this mechanism when the answer is not explicitly present in the current page, you need clarification or additional context, or you want to retrieve related documentation sections.