> For the complete documentation index, see [llms.txt](https://docs.powermonitor.com.br/llms.txt). Markdown versions of documentation pages are available by appending `.md` to page URLs; this page is available as [Markdown](https://docs.powermonitor.com.br/en/power-monitor/performance/lakehouse-e-warehouse.md).
# Lakehouse and Warehouse
Pick a Lakehouse or Warehouse by name and open the performance diagnosis of its T-SQL queries, Capacity Units consumption and scheduled tasks.
The **Lakehouse and Warehouse** screen is the entry point, in the **Performance** menu, to the performance diagnosis of a **Warehouse** or of a **Lakehouse SQL analytics endpoint** in Microsoft Fabric. You search for the item by name and the analysis opens right away, with the query impact score, regressions, concurrency, cache, failures, SQL Pool, scheduled tasks and Capacity Units (CU) consumption.
**How to access:** *Performance › Lakehouse and Warehouse*. Available to all profiles, within each user's workspace scope. The screen is **read-only**: no action changes the item or Fabric.
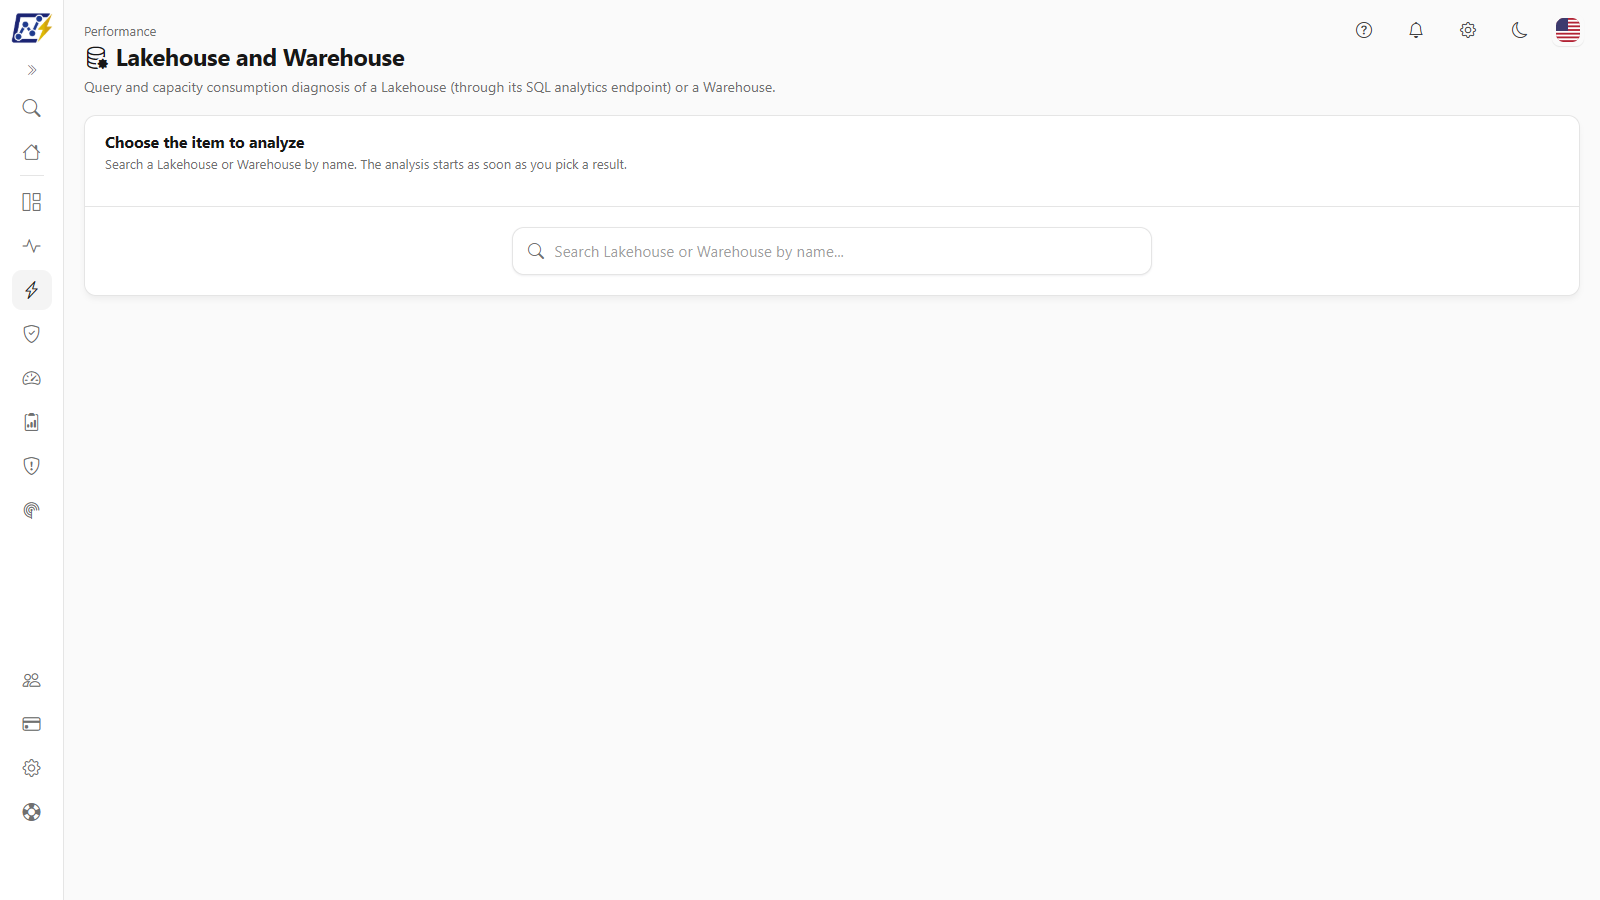
Lakehouse or Warehouse picker
## What it is for
* **Reach the analysis without going through Storage**: before, the analysis only opened from an item's actions menu in *Governance › Storage*. Now you start from the item name.
* **Diagnose slowness** in a Warehouse or a Lakehouse (SQL analytics endpoint): which queries weigh the most, whether there was a regression, whether the cache is cold, whether the SQL Pool is under pressure.
* **Attribute consumption**: see who and which application consume the most and how many Capacity Units the item spent.
## Screen components
### Item selection
**What it is:** the *Search Lakehouse or Warehouse by name...* field, below the **Choose the item to analyze** title.
**What it is for:** finding the item without navigating to the Storage list.
**How to use:**
1. Type at least 2 characters of the name (the screen shows *Type at least 2 characters.* while there are fewer).
2. Choose the result in the list; each item shows its type (**Lakehouse** or **Warehouse**) and the workspace.
3. The analysis starts as soon as you choose a result. To switch items, use the search field that stays above the analysis, labeled **Analyze another item**.
**How it works:** if nothing is found, *No Lakehouse or Warehouse found.* appears; if the search fails, a message asks you to try again. The clear button empties the search. The name search matches any part of the name, shows up to 30 results in alphabetical order and lists only items from **monitored** workspaces within your scope, the same ones the actions menu in *Governance › Storage* offers. You can move through the list with the arrow keys, choose with **Enter** and close with **Esc**.
### Item analysis
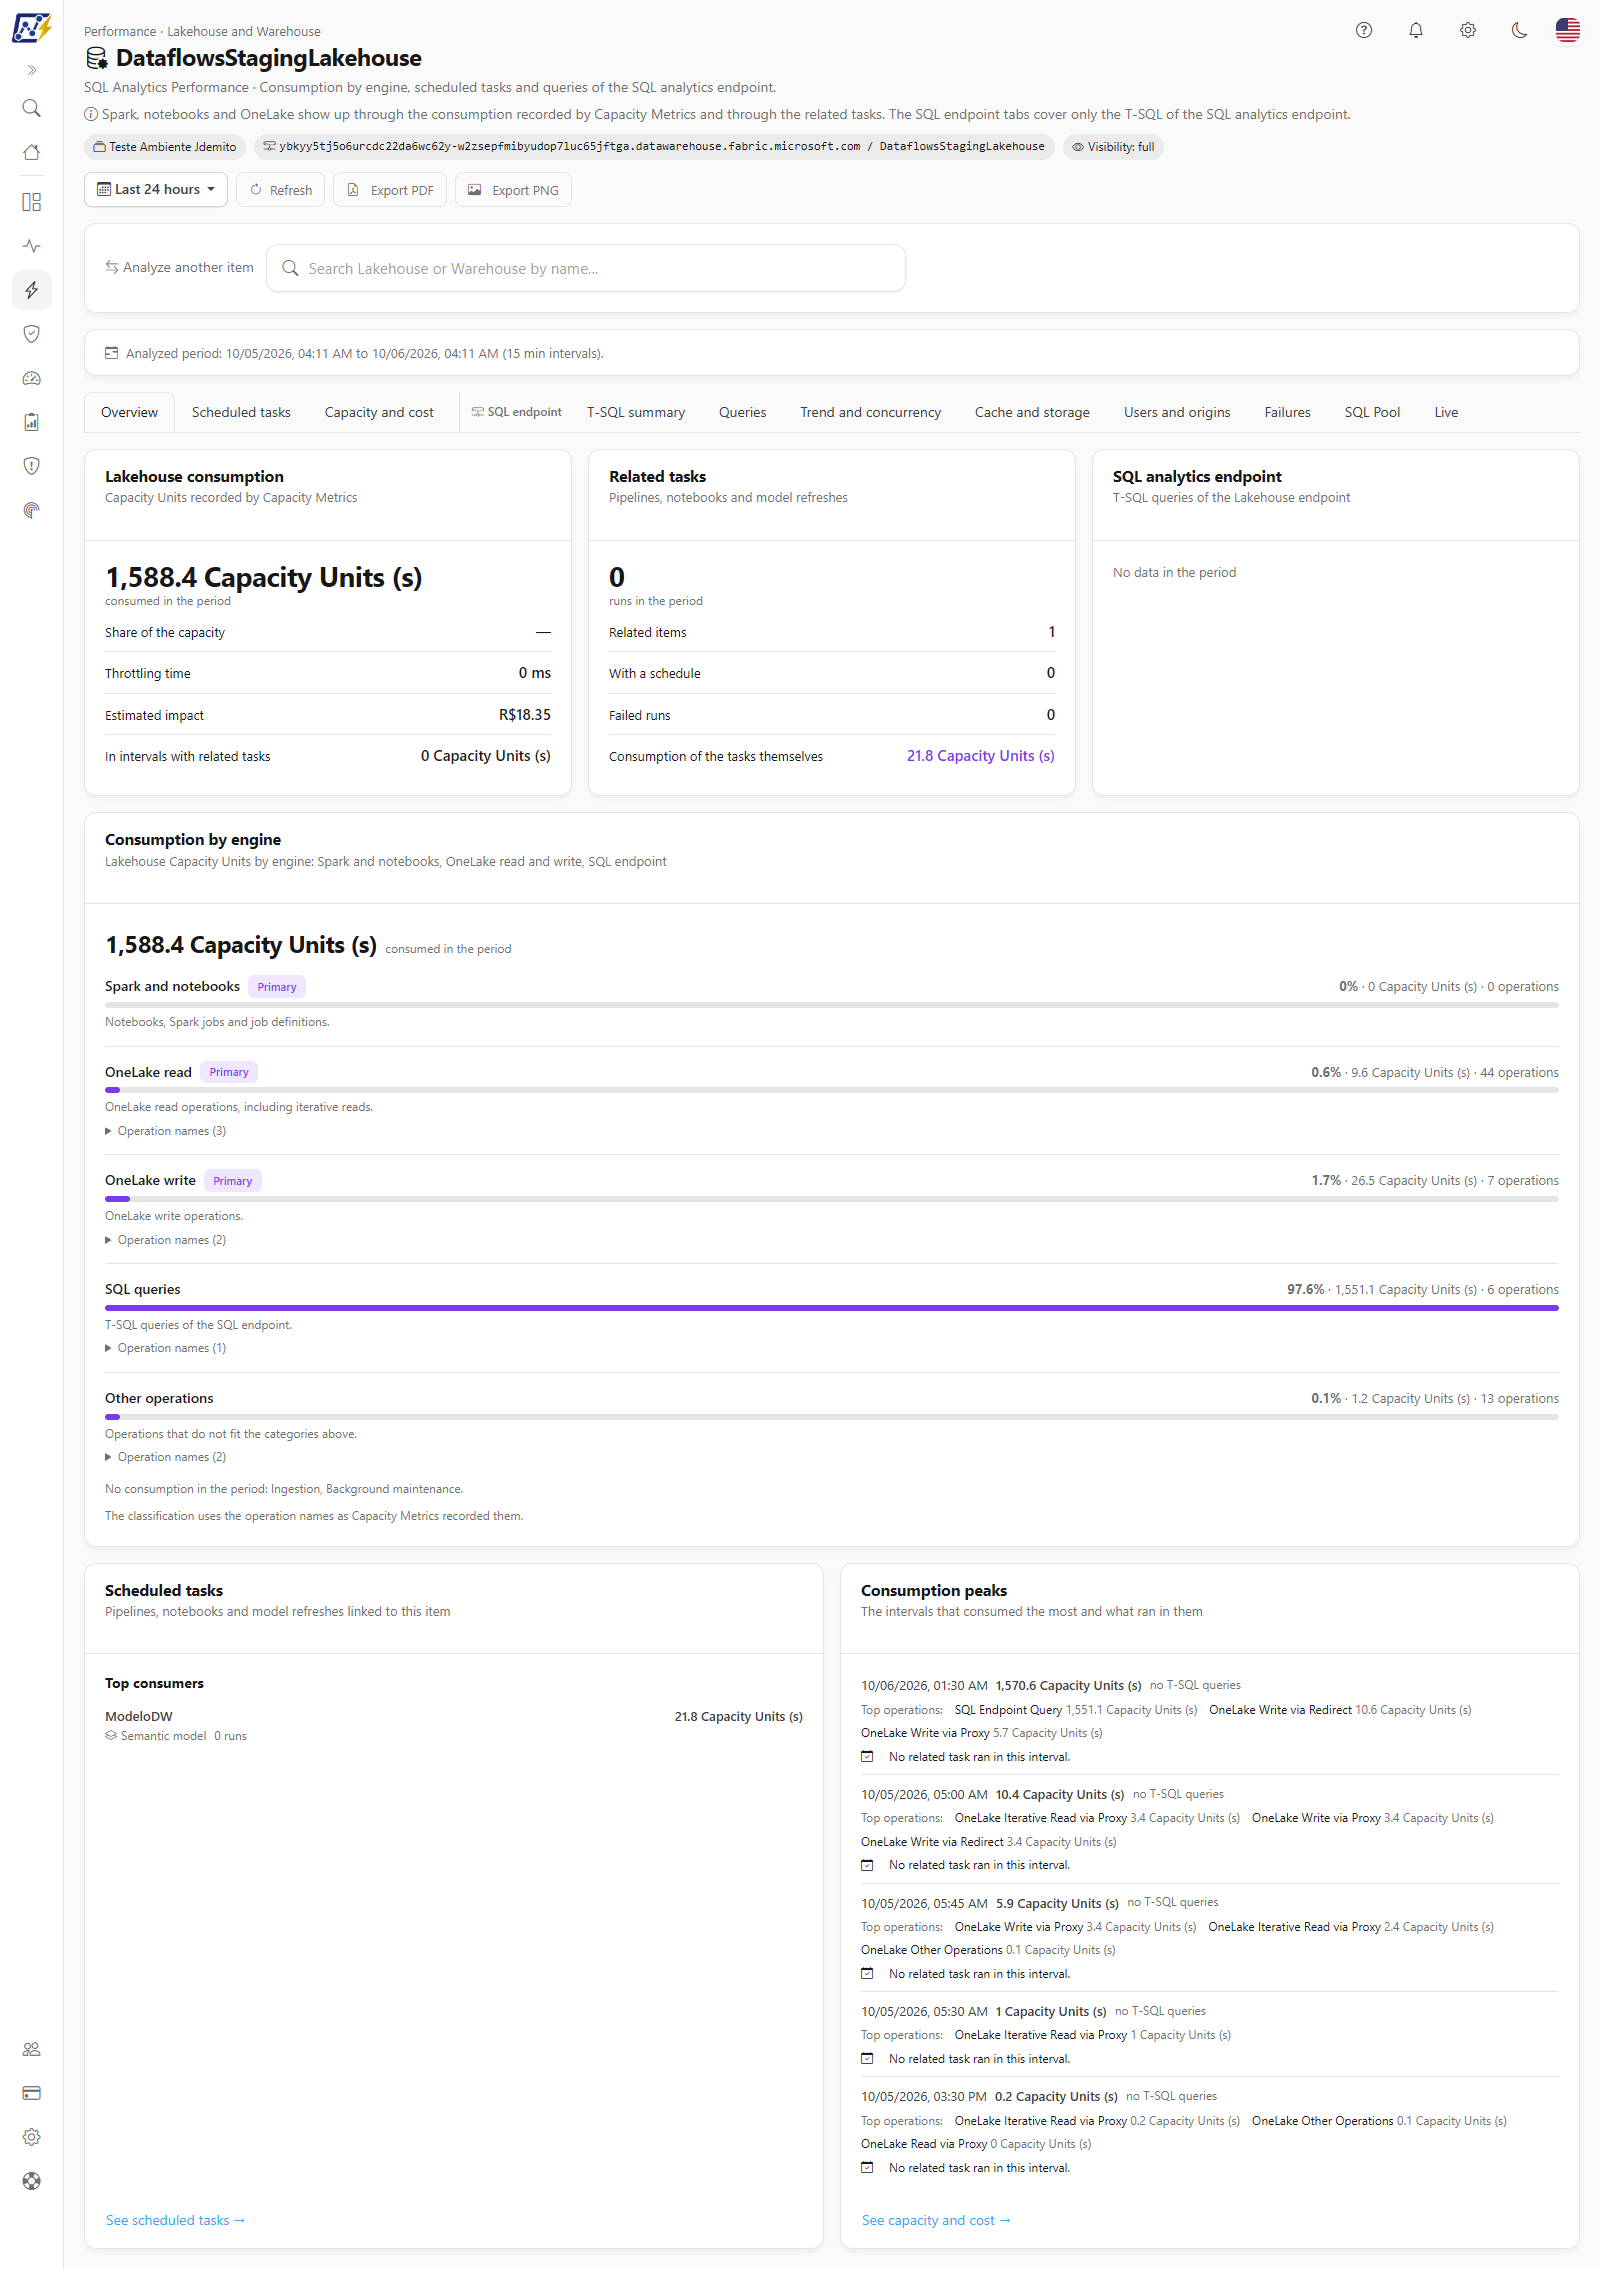
After you choose, the screen shows the same **Performance Analysis** that opens from the actions menu in *Governance › Storage*: period selector (from **Last hour** to **Last 30 days**), tabs by item type (Overview, Queries, Trend and concurrency, Cache and storage, Users and origins, Failures, SQL Pool, Scheduled tasks, Capacity and cost and Live), PDF and PNG export and the explained diagnoses. The complete description of each tab, of the impact score and of the diagnoses is in [Performance Analysis](/en/power-monitor/governanca/armazenamento/analise-de-performance-sql.md).
From this entry, the top of the analysis shows the path *Performance · Lakehouse and Warehouse* (opened from Storage, the path is *Governance · Storage · Performance Analysis*), the item name, the subtitle according to the type (for a Lakehouse, the type title is **SQL Analytics Performance**) and three context chips: **Workspace**, **SQL endpoint (host / database)** and **Visibility** (*full*, *limited* or *unknown*). Below come the period selector, **Refresh** and the PDF and PNG export, and the **Analyze another item** field. When you switch items, the browser Back button returns to the previous item. A Lakehouse opens on its own **Overview** (consumption, tasks and SQL endpoint summary) and groups the T-SQL tabs under **SQL endpoint**; a Warehouse opens on the T-SQL **Overview**.
Analysis opened from the picker
## Rules and behavior
* **Prerequisites.** The Power Monitor Service Principal must be an administrator of the item's workspace and the item must have Query Insights (default on Warehouses and SQL analytics endpoints). Without access to the SQL endpoint, the analysis shows only the tabs that do not depend on it (Scheduled tasks and Capacity and cost). See the details in [Performance Analysis](/en/power-monitor/governanca/armazenamento/analise-de-performance-sql.md#prerequisites).
* **On-demand reading.** T-SQL data is read from the SQL endpoint every time you open the analysis, change the period or click **Refresh**; nothing is collected periodically or stored.
* **Direct link.** The analysis address keeps the item and the active tab: when you copy the link, whoever opens it (with access to the item) lands on the same spot.
* **Sensitive data.** The analysis shows SQL query text, logins and hosts. Be careful when sharing screenshots; SQL text is not included in PNG/PDF exports.
## Step by step: analyzing a slow Warehouse
{% stepper %}
{% step %}
Open *Performance › Lakehouse and Warehouse* and type the item name.
{% endstep %}
{% step %}
Choose the item in the list and wait for the progress screen.
{% endstep %}
{% step %}
Start with the **Overview** tab and the **What stands out** block; adjust the **period** to the time range of the problem.
{% endstep %}
{% step %}
Open **Queries** to see what weighs the most and **Capacity and cost** for CU consumption.
{% endstep %}
{% endstepper %}
## Frequently asked questions
I cannot find my Lakehouse or Warehouse.
Confirm that the item exists in a workspace of your scope and that the inventory has already collected it. Newly created items appear after the next inventory scan.
The analysis says it cannot read the SQL endpoint.
The Power Monitor Service Principal must be an administrator of the item's workspace. Add it in [Governance › Workspaces](/en/power-monitor/governanca/workspaces.md) or in Settings › Additional permissions and try again.
## Related pages
* [Performance Analysis](/en/power-monitor/governanca/armazenamento/analise-de-performance-sql.md): complete description of the tabs, the impact score and the diagnoses
* [Governance › Storage](/en/power-monitor/governanca/armazenamento.md)
* [Average Execution Time](/en/power-monitor/performance/tempo-medio-de-execucao.md)
* [Performance Assessment](/en/power-monitor/performance/avaliacao-de-performance.md)
---
# Agent Instructions
This documentation is published with GitBook. GitBook is the documentation platform designed so that both humans and AI agents can read, navigate, and reason over technical content effectively. Learn more at gitbook.com.
## Querying This Documentation
If you need additional information that is not directly available in this page, you can query the documentation by asking a question.
Perform an HTTP GET request on the following URL with the `ask` and `goal` query parameters:
```
GET https://docs.powermonitor.com.br/en/power-monitor/performance/lakehouse-e-warehouse.md?ask=&goal=
```
`ask` is the immediate question: it should be specific, self-contained, and written in natural language.
`goal` is what the user is ultimately trying to achieve, the reason they need the answer. Sharing it helps GitBook give you a better, more relevant answer. A goal is most helpful when it describes the outcome the user wants rather than restating the question. For example, with `ask=how do I create an API token`, a goal like `automate deployments from our CI pipeline` lets GitBook tailor the answer to that use case.
The response will contain a direct answer to the question and relevant excerpts and sources from the documentation.
Use this mechanism when the answer is not explicitly present in the current page, you need clarification or additional context, or you want to retrieve related documentation sections.