> For the complete documentation index, see [llms.txt](https://docs.powermonitor.com.br/llms.txt). Markdown versions of documentation pages are available by appending `.md` to page URLs; this page is available as [Markdown](https://docs.powermonitor.com.br/en/power-monitor/performance/limpeza-de-modelo.md).

# Model Cleanup

Find out which tables, columns, and measures of a semantic model are not used in any report, filter, relationship, RLS/OLS, or measure, Measure Killer style, without changing anything in the model.

**Model Cleanup** shows, for a chosen semantic model, which **tables, columns, and measures are not used** anywhere: not in the visuals and filters of the reports bound to it, nor in relationships, security rules (RLS/OLS), measures, calculated columns, or composite models that depend on it. It is the same idea as tools such as *Measure Killer*: identify what can be removed to make the model **smaller, faster to refresh, and simpler to maintain**.

In addition to the list of what is not used, the screen shows **where each item is used** (down to the page, visual, and role in the visual), the physical source of each column, the relationships, the Power Query code of each table, and a per-report summary, including **broken visuals**.

**How to access:** *Performance › Model Cleanup*. Available to all profiles (read-only).

<figure><picture><source srcset="/files/9zvzkRMtZH3pFVbFcTSD" media="(prefers-color-scheme: dark)"><img src="https://3938213054-files.gitbook.io/~/files/v0/b/gitbook-x-prod.appspot.com/o/spaces%2FH2bFRBmIfyK3kwVKbldl%2Fuploads%2Fgit-blob-847f0cc322ffd41f9eea01cc30acd66d9899d2d0%2Fpm-qualidade-limpeza-modelo-en.png?alt=media" alt="Model Cleanup with the Unused tab open for a semantic model"></picture><figcaption><p>Unused tab: unused tables, columns, and measures</p></figcaption></figure>

{% hint style="warning" %}
**Power Monitor does not delete anything.** The screen is for analysis only: removing fields is done by you, in Power BI Desktop or in the modeling tool you use, and is entirely your responsibility. The mapping considers **only semantic models and reports**; usage by Data Agents, Fabric Apps, and other artifacts is **not** analyzed. Before deleting anything, **keep a backup of the semantic model**.
{% endhint %}

## What it is for

* **Reduce the model size** and the refresh time/Capacity Units consumption, by removing imported columns that nobody uses.
* **Simplify the experience** for users and for AI, by eliminating dead measures and tables that clutter the field list.
* **Prepare a migration** (for example, to DirectLake or to an enterprise model), knowing exactly what is needed.
* **Find broken visuals** that reference fields that no longer exist in the model.
* **Answer "where is this field used?"** before renaming or changing a measure.

## Features

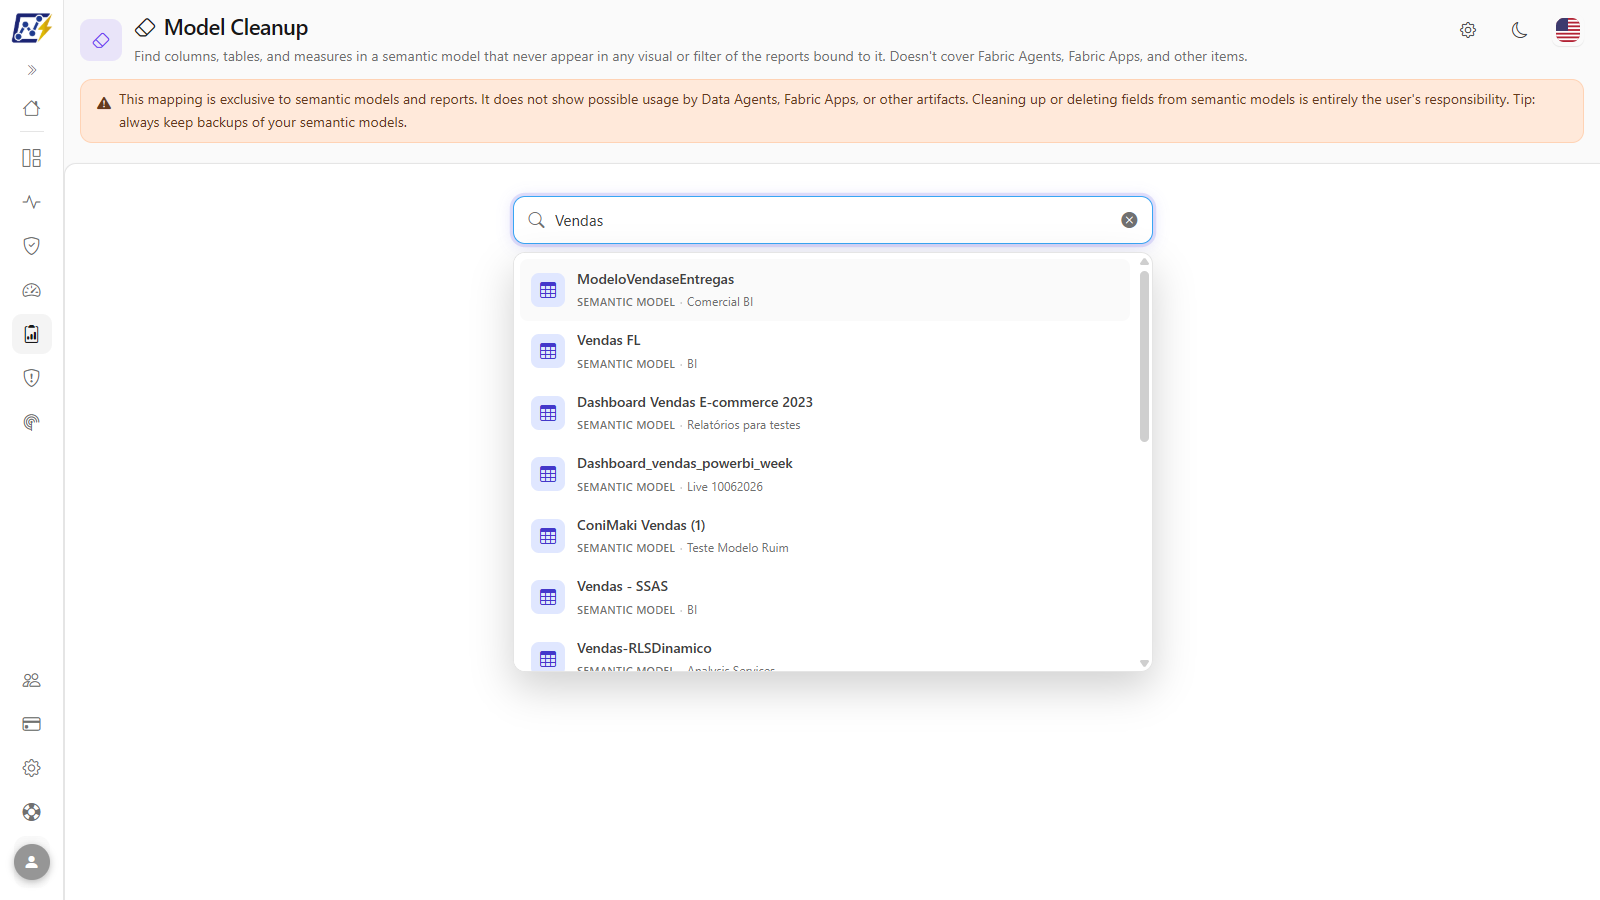
### Model selection and Run again

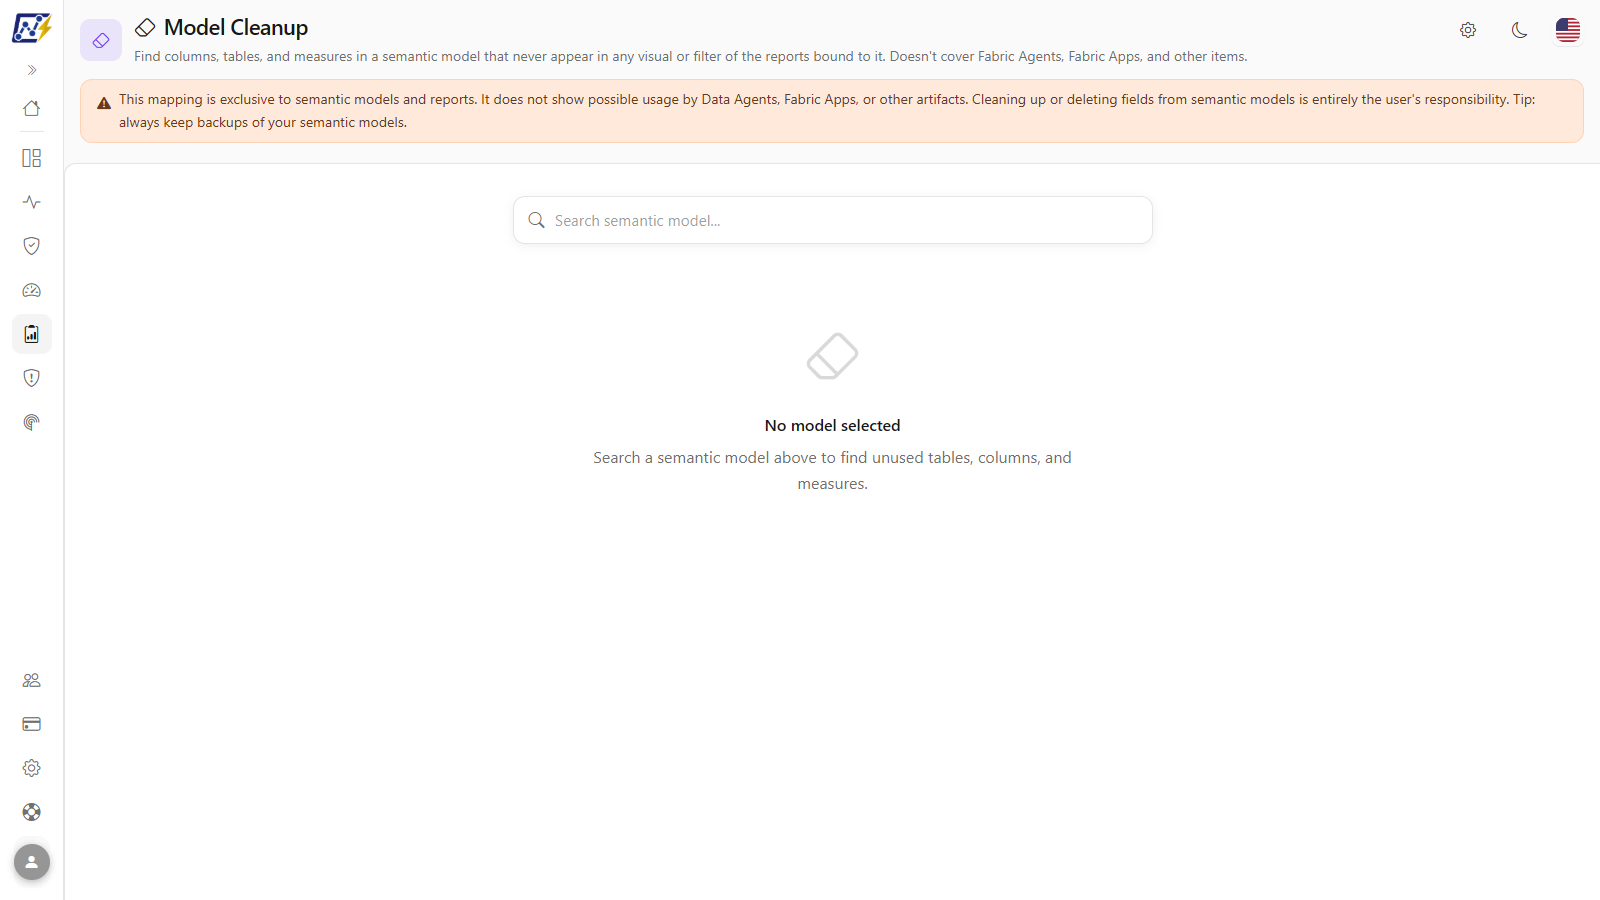
**What it is:** the *Search semantic model...* field at the top of the screen and, after the choice, the strip with the model, the workspace, and the **Run again** button.

**What it is for:** choosing the model to analyze and redoing the analysis when the report structure is collected again.

<figure><picture><source srcset="/files/fBn9elU5C2ZJNw4Ghamx" media="(prefers-color-scheme: dark)"><img src="https://3938213054-files.gitbook.io/~/files/v0/b/gitbook-x-prod.appspot.com/o/spaces%2FH2bFRBmIfyK3kwVKbldl%2Fuploads%2Fgit-blob-43850d233fc2bc04e457b5ed034d4571fb8bce1f%2Fpm-qualidade-limpeza-modelo-selecao-en.png?alt=media" alt="Search semantic model field with the suggestions list open"></picture><figcaption><p>Model search and selection</p></figcaption></figure>

**How to use:**

1. Read the scope notice at the top: the analysis considers only semantic models and reports.
2. Type at least 2 characters in **Search semantic model...** and click the suggestion (or use **↑**/**↓** and **Enter**).
3. The strip below the search confirms the model and the workspace, and the screen displays *Analyzing the model...*.
4. To redo the analysis of the same model, click **Run again**, in the strip.

**How it works:** the analysis runs when you select the model and only reads the metadata already collected: nothing is changed. If *This semantic model was not found...* appears, the model was deleted or left your workspace scope; if *Could not analyze this semantic model.* appears, click **Run again**. The search does not suggest Microsoft standard artifacts (see [Rules and behavior](#where-the-data-comes-from)).

### Coverage notices

**What it is:** the messages displayed above the tabs when the result may be incomplete or there is nothing to clean up.

**What it is for:** avoiding removing a field that is in use in a report that has not been analyzed yet.

* *"{N} of {total} reports bound to this model were not included in this analysis because their structure has not been captured yet."*: these reports were **ignored** (and not treated as if they used nothing).
* **No report with captured structure**: it is not possible to know what is in use. *This does not mean nothing is used.*
* **Nothing to clean up**: all tables, columns, and measures appear in some usage.

**How to use:** if the first notice appears, follow the step-by-step **How to complete the analysis coverage** (further below) before using the list of unused items.

### Unused tab

**What it is:** the first tab of the result, with what can be removed.

**What it is for:** building the model's cleanup list: imported columns that nobody uses, dead measures, and entire unused tables.

| Section                                      | Content                                                                                                                                                                                                 |
| -------------------------------------------- | ------------------------------------------------------------------------------------------------------------------------------------------------------------------------------------------------------- |
| **Unused tables**                            | Tables in which **all** columns and measures are unused and that are not protected by RLS/OLS                                                                                                           |
| **Unused columns**                           | Table and column. Items hidden in the model receive the *Hidden* badge                                                                                                                                  |
| **Unused measures**                          | Table and measure                                                                                                                                                                                       |
| **Partially unused tables/columns/measures** | Items used **only** by report measures that, in turn, do not appear in any visual, filter, or conditional formatting. The tooltip of the *Partially unused* badge cites the report measure(s) involved. |

**How to use:**

1. With the model analyzed, open the **Unused** tab.
2. Review the **Unused tables**, **Unused columns**, and **Unused measures** sections.
3. Review the **partially unused** item sections and hover over the *Partially unused* badge to see which report measure keeps them "alive".
4. Click a section title to collapse or expand it (this applies to the sections of all tabs).

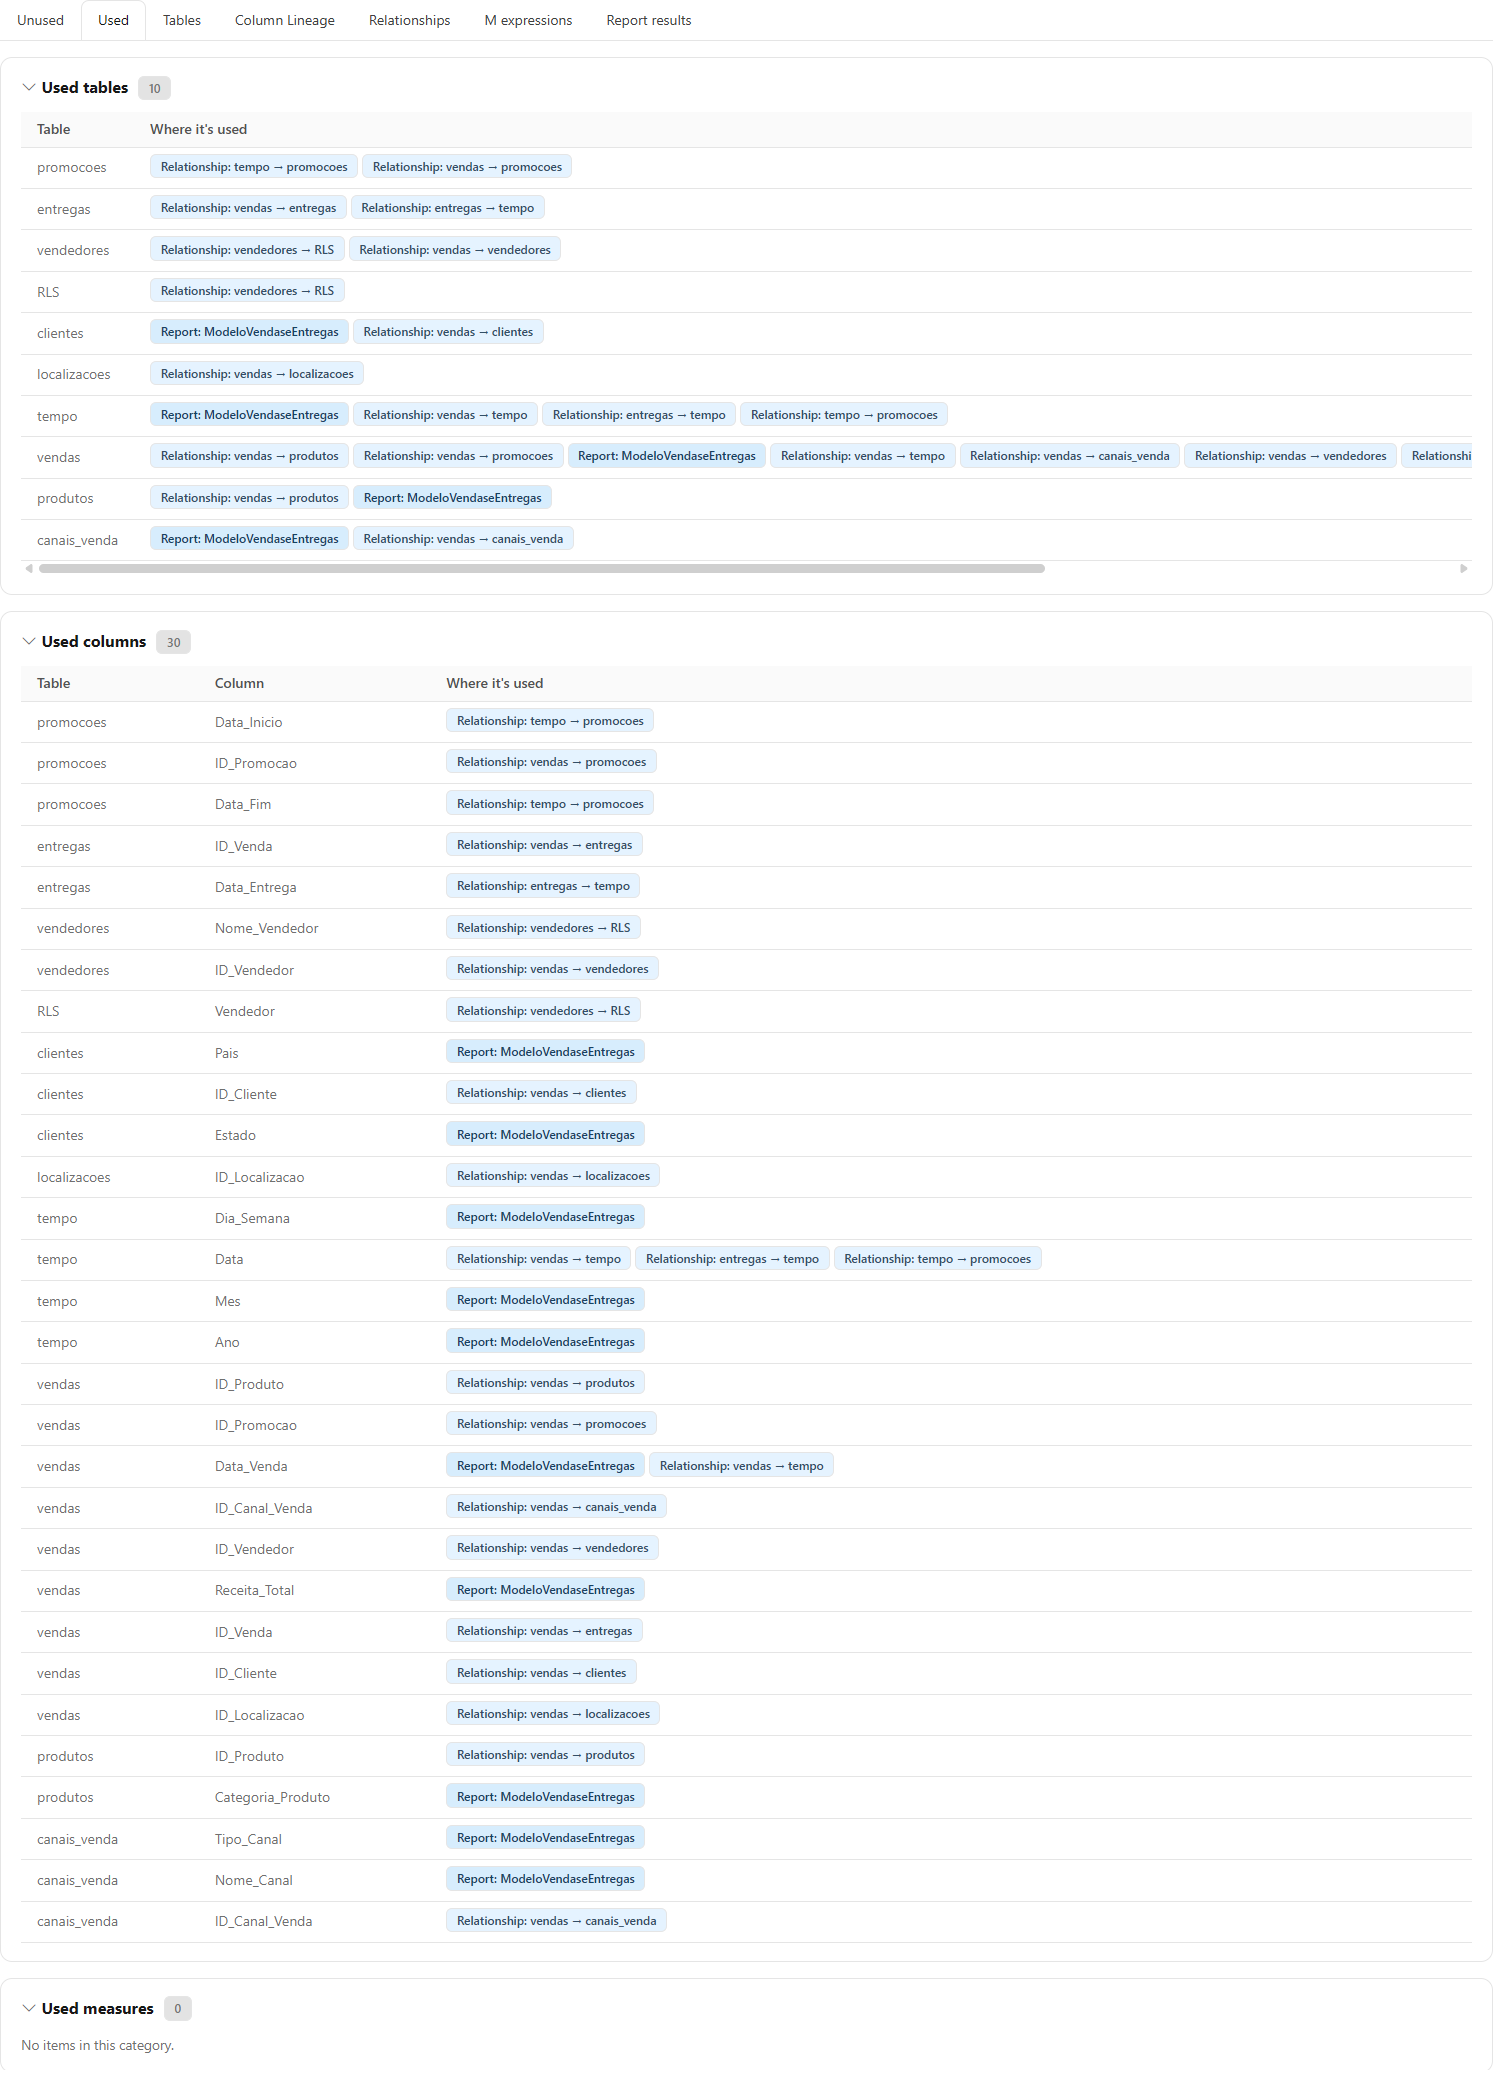
### Used tab and "Where it's used" badges

**What it is:** the tab with **Used tables**, **Used columns**, and **Used measures**, each with the **Where it's used** column, made up of colored badges that indicate the source of the usage.

**What it is for:** answering "where is this field used?" before renaming or changing a measure.

<figure><picture><source srcset="/files/00a7zh6jk0g9ZXITo4jb" media="(prefers-color-scheme: dark)"><img src="https://3938213054-files.gitbook.io/~/files/v0/b/gitbook-x-prod.appspot.com/o/spaces%2FH2bFRBmIfyK3kwVKbldl%2Fuploads%2Fgit-blob-f30f9b03fbed63d3784699d6e6f0230910ff3470%2Fpm-qualidade-limpeza-modelo-usados-en.png?alt=media" alt="Used tab with the colored badges in the Where it&#x27;s used column"></picture><figcaption><p>Used tab with the usage source badges</p></figcaption></figure>

| Badge                                                      | Meaning                                                                       |
| ---------------------------------------------------------- | ----------------------------------------------------------------------------- |
| **Report: {name}**                                         | Used in a visual, filter, sort order, or conditional formatting of the report |
| **RLS: role "{name}"**                                     | Used by a row-level security role                                             |
| **OLS: role "{name}"**                                     | Column protected by object-level security for a role                          |
| **Relationship: {from → to}**                              | Column used as a relationship key                                             |
| **Used by measure "{name}"**                               | Referenced by the DAX expression of a measure that is itself used             |
| **Used by calculated column "{name}"**                     | Referenced by a used calculated column                                        |
| **Used by composite model "{name}"**                       | Used by a semantic model that consumes this model                             |
| **Used by report measure "{name}"**                        | Referenced by a measure created inside a report (and used in it)              |
| **Used by calculation group "{name}"**                     | Referenced by a calculation group item                                        |
| **Used by detail rows (drillthrough) expression "{name}"** | Referenced by a detail rows expression                                        |

**How it works:** a table is "used" when any of its columns or measures is used; it inherits the badges of its fields. When applicable, the tab also shows the notices *"{N} table(s) protected by row-level security (RLS): never suggested for deletion..."* and *"{N} dependent composite model(s) considered..."*.

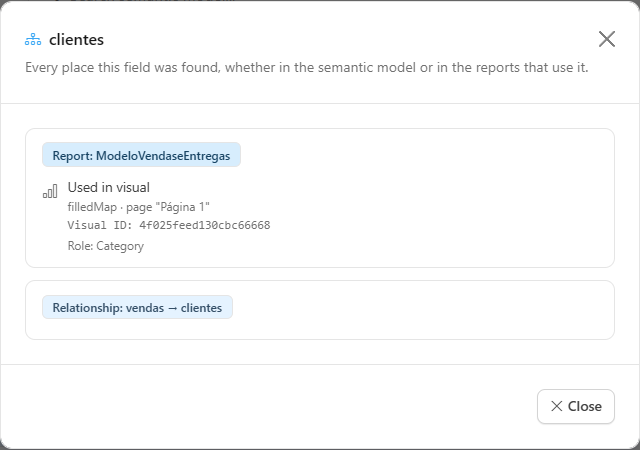
### Usage detail

**What it is:** the modal opened when you click any badge in the **Where it's used** column (in the **Used**, **Tables**, and **Column Lineage** tabs).

**What it is for:** knowing exactly on which page, visual, and role the field appears: for example, to notify the report owner before a change.

<figure><picture><source srcset="/files/Ui9CMtMjvv1vOatVD4HO" media="(prefers-color-scheme: dark)"><img src="https://3938213054-files.gitbook.io/~/files/v0/b/gitbook-x-prod.appspot.com/o/spaces%2FH2bFRBmIfyK3kwVKbldl%2Fuploads%2Fgit-blob-a7b4c5af8cbdec264c61961a976a9681e6537fcb%2Fpm-qualidade-limpeza-modelo-detalhe-uso-en.png?alt=media" alt="Usage detail modal of a field, with location, visual, page, visual ID, and role"></picture><figcaption><p>Every place the field was found</p></figcaption></figure>

**How to use:**

1. In the **Where it's used** column, click one of the badges (for example, **Report: Sales**).
2. Read the list of occurrences. For reports, each row shows the location (*Report filter*, *Page filter "{page}"*, *Visual filter*, *Used in visual*, *Visual sort order*, or *Visual conditional formatting*), the visual type and the page, the **Visual ID** (to tell apart visuals of the same type on the same page), and the field's **Role** in the visual (for example, `Category`, `Y`, `Tooltip`).
3. Click **Close** (or the **X**) to return to the result.

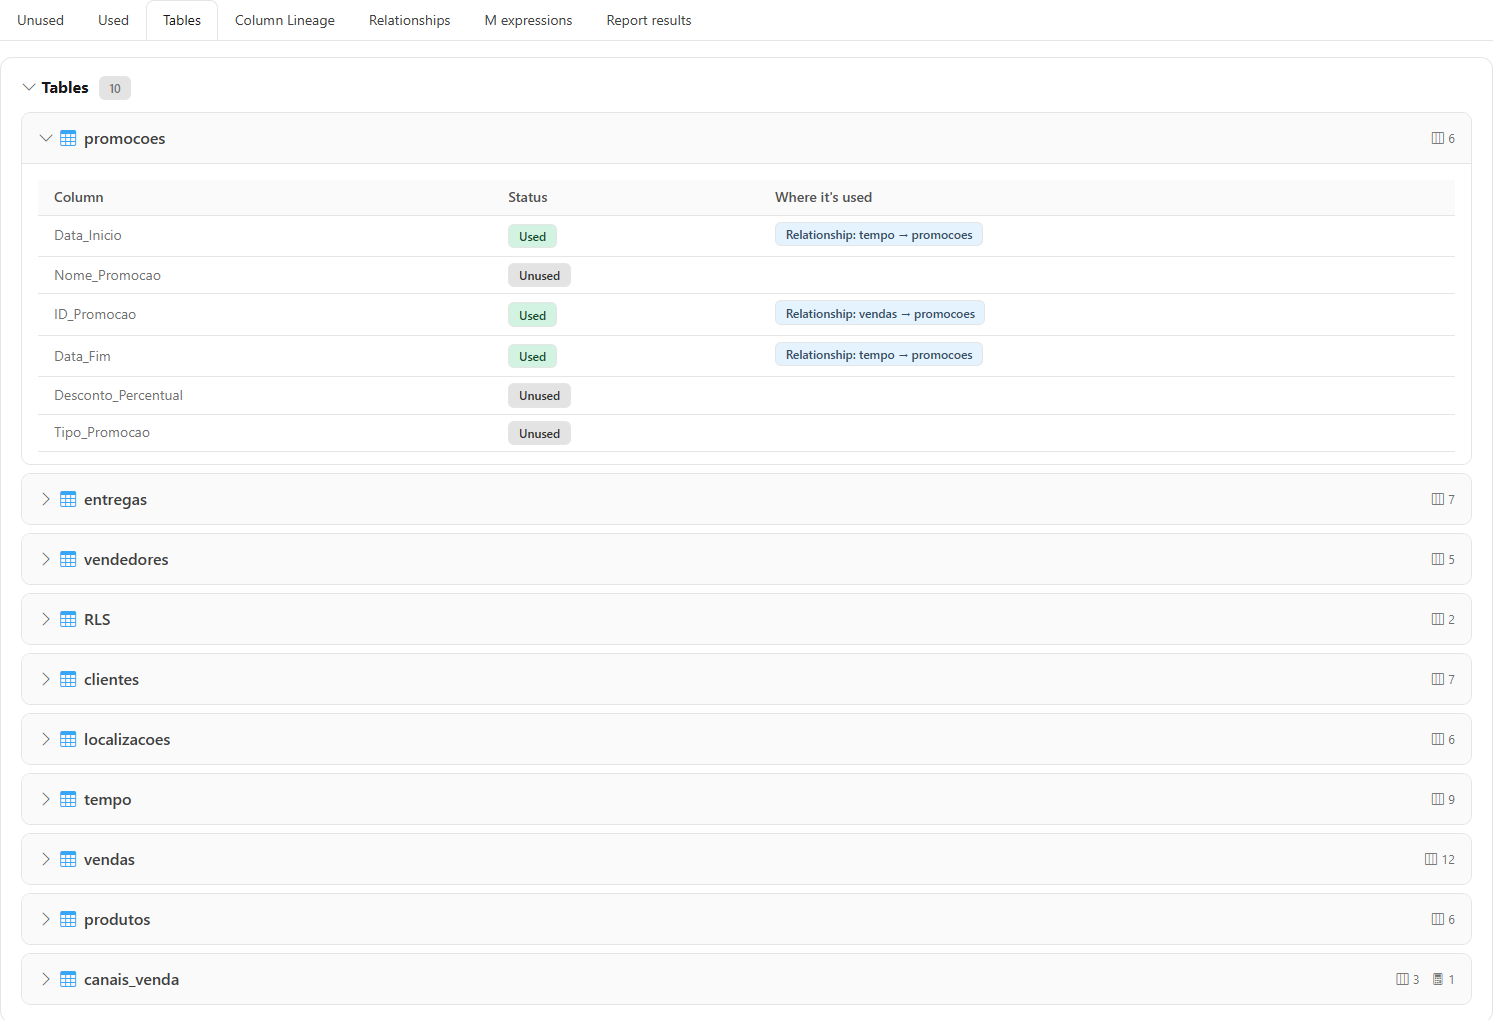
### Tables tab

**What it is:** the view grouped by table (accordion).

**What it is for:** reviewing the model table by table, seeing used and unused items side by side.

<figure><picture><source srcset="/files/jYSfwer0MqebjJcQFyOB" media="(prefers-color-scheme: dark)"><img src="https://3938213054-files.gitbook.io/~/files/v0/b/gitbook-x-prod.appspot.com/o/spaces%2FH2bFRBmIfyK3kwVKbldl%2Fuploads%2Fgit-blob-911aa71abd3f5a46633ab8e238d772b51f4e4ea7%2Fpm-qualidade-limpeza-modelo-tabelas-en.png?alt=media" alt="Tables tab with a table expanded showing columns and measures with Status and Where it&#x27;s used"></picture><figcaption><p>Tables tab with a table expanded</p></figcaption></figure>

**How to use:**

1. Open the **Tables** tab.
2. Click a table name to expand its **columns** and **measures**, with the **Status** (*Used*, *Unused*, or *Partially unused*) and the **Where it's used** column.
3. Click again to collapse it.

### Column Lineage tab

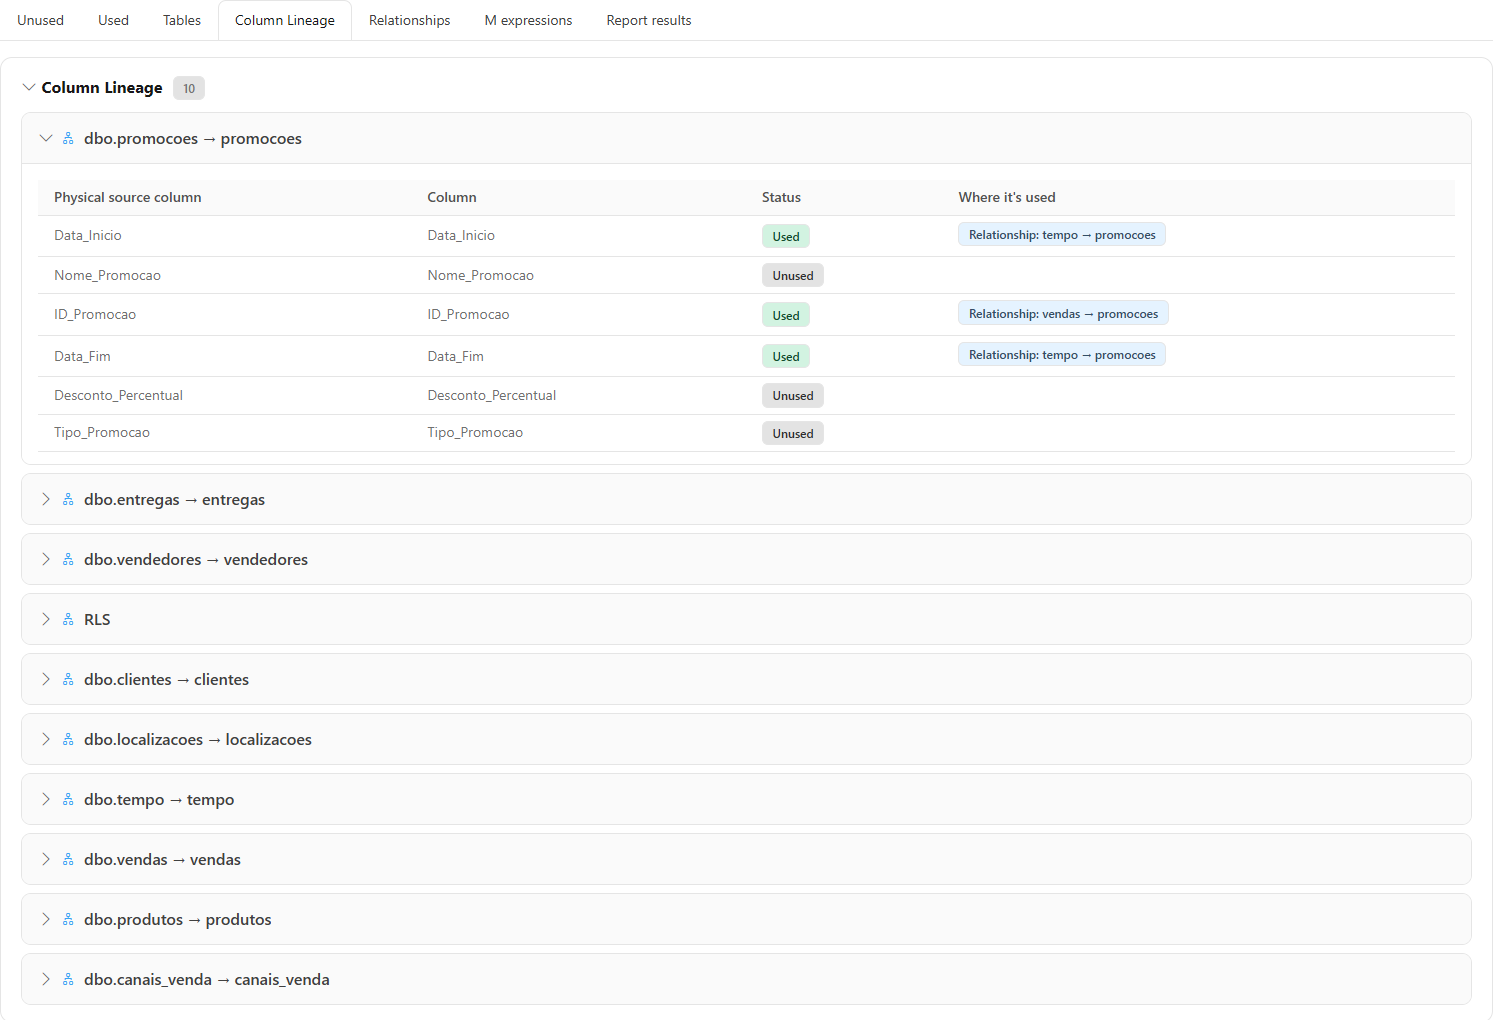
**What it is:** the same per-table view, plus the **Physical source column**: the name of the column in the data source, identified from Power Query.

**What it is for:** preparing a migration or talking to the database team knowing which physical column each field comes from.

<figure><picture><source srcset="/files/7XEIyB2d1S7uzKIApVk0" media="(prefers-color-scheme: dark)"><img src="https://3938213054-files.gitbook.io/~/files/v0/b/gitbook-x-prod.appspot.com/o/spaces%2FH2bFRBmIfyK3kwVKbldl%2Fuploads%2Fgit-blob-0b8e5f9af17e623f5c8c6b05476bdf477c339793%2Fpm-qualidade-limpeza-modelo-linhagem-colunas-en.png?alt=media" alt="Column Lineage tab with the physical source column"></picture><figcaption><p>Physical source column of each field</p></figcaption></figure>

**How to use:**

1. Open the **Column Lineage** tab.
2. Click a table name to expand it.
3. Check the **Physical source column** column.

**How it works:** when the source cannot be identified reliably (for example, tables that merge sources), *Not identified* appears. Measures have no physical source and appear with "-".

### Relationships tab

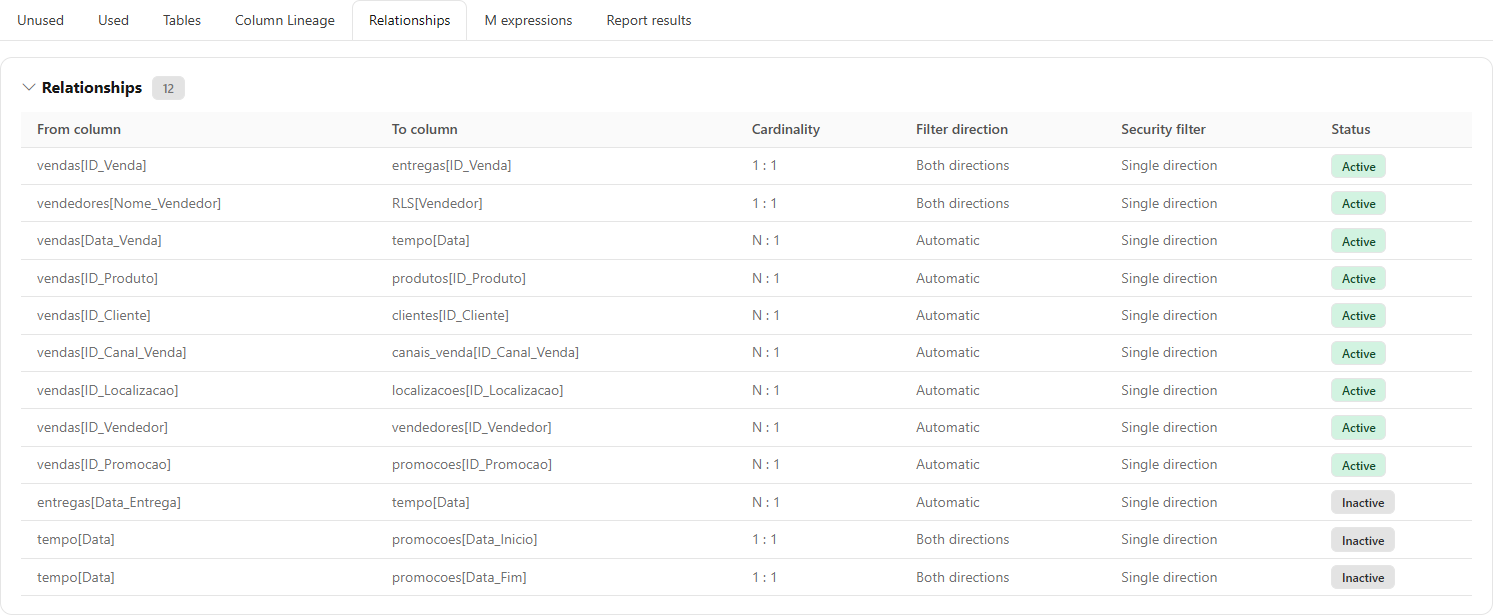
**What it is:** the list of the model's relationships.

**What it is for:** finding bidirectional or inactive relationships during the model review.

<figure><picture><source srcset="/files/kItgDrcTm2ySZ0KuNWRQ" media="(prefers-color-scheme: dark)"><img src="https://3938213054-files.gitbook.io/~/files/v0/b/gitbook-x-prod.appspot.com/o/spaces%2FH2bFRBmIfyK3kwVKbldl%2Fuploads%2Fgit-blob-c2e7cd18e2e7e7c5ec31f6cedfe4365011c2f375%2Fpm-qualidade-limpeza-modelo-relacionamentos-en.png?alt=media" alt="Relationships tab with from, to, direction, security filter, cardinality, and status"></picture><figcaption><p>Model relationships</p></figcaption></figure>

| Column               | Content                                               |
| -------------------- | ----------------------------------------------------- |
| **From column**      | `Table[Column]` on the from side                      |
| **To column**        | `Table[Column]` on the to side                        |
| **Filter direction** | *Automatic*, *Single direction*, or *Both directions* |
| **Security filter**  | *Single direction*, *Both directions*, or *None*      |
| **Cardinality**      | In the `from : to` format (for example, `N : 1`)      |
| **Status**           | *Active* or *Inactive*                                |

**How it works:** security filter direction and cardinality depend on the full model definition; when it is not available, these fields appear empty.

### M expressions tab

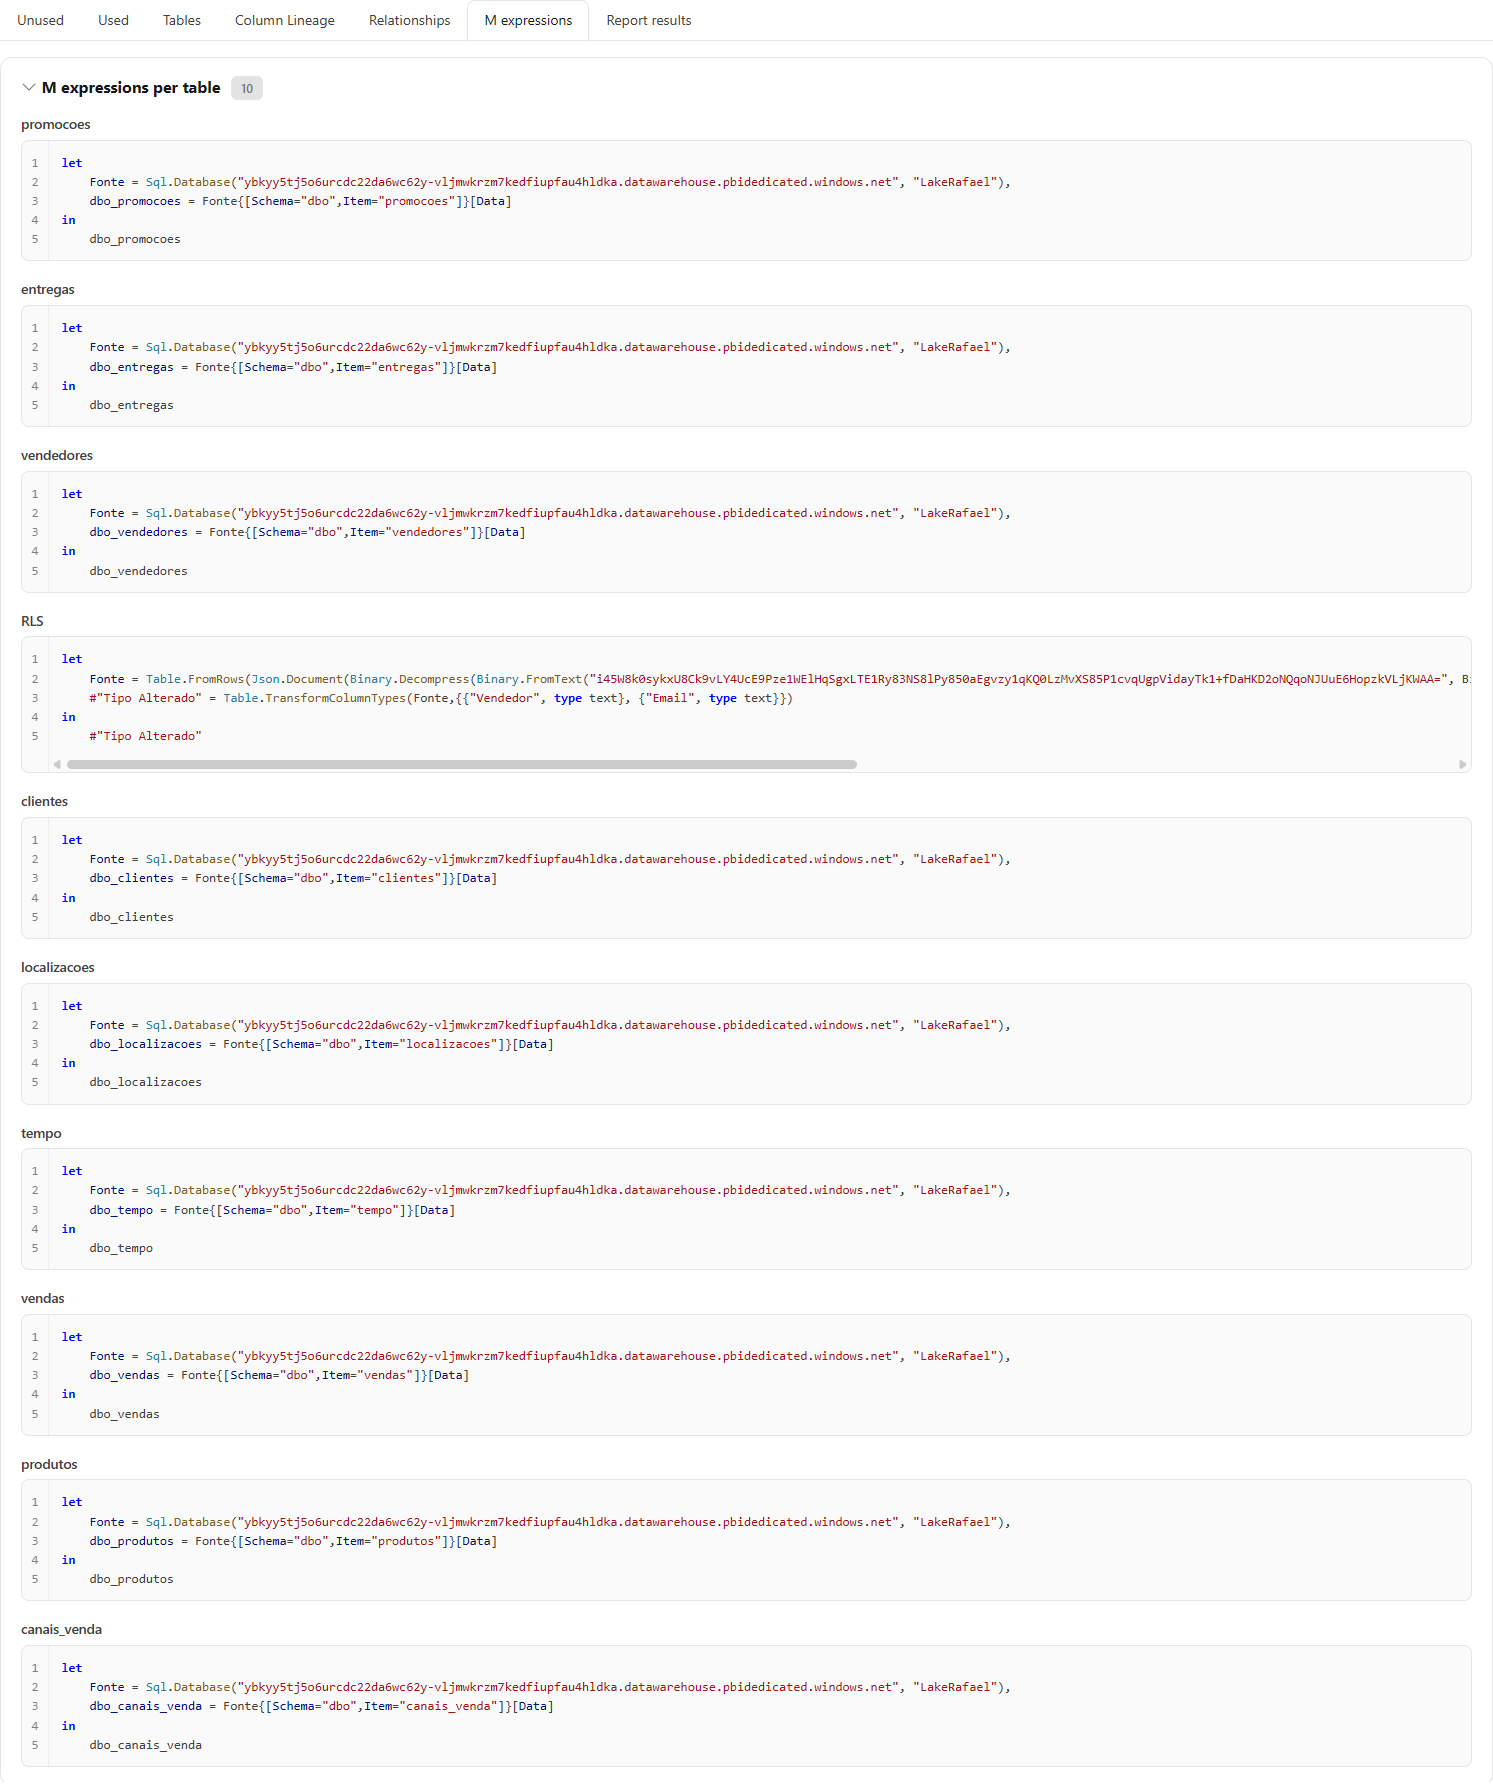
**What it is:** the model's Power Query code, with syntax highlighting and line numbers, in two sections: **M expressions per table** (tables with more than one source appear in more than one block) and **Shared M expressions** (parameters and shared queries).

**What it is for:** understanding where each table reads its data from and reviewing filters and transformations without opening Power BI Desktop.

<figure><picture><source srcset="/files/BreW3mnX2B6tXjkmVCDD" media="(prefers-color-scheme: dark)"><img src="https://3938213054-files.gitbook.io/~/files/v0/b/gitbook-x-prod.appspot.com/o/spaces%2FH2bFRBmIfyK3kwVKbldl%2Fuploads%2Fgit-blob-3982624f19a2742836366f411772e66c6f552465%2Fpm-qualidade-limpeza-modelo-expressoes-m-en.png?alt=media" alt="M expressions tab with the Power Query code of a table"></picture><figcaption><p>Power Query code per table</p></figcaption></figure>

**How to use:** open the **M expressions** tab and scroll through the sections; click a section title to collapse or expand it.

### Report results tab

**What it is:** a summary per report bound to the model.

**What it is for:** finding **broken visuals**: visuals that display fields that no longer exist in the model.

<figure><picture><source srcset="/files/7OsGMhDXYzkmQREtRnQS" media="(prefers-color-scheme: dark)"><img src="https://3938213054-files.gitbook.io/~/files/v0/b/gitbook-x-prod.appspot.com/o/spaces%2FH2bFRBmIfyK3kwVKbldl%2Fuploads%2Fgit-blob-6014b9277da2010c167f4a322edb3f36d2a8ef8d%2Fpm-qualidade-limpeza-modelo-resultado-relatorio-en.png?alt=media" alt="Report results tab with Pages, Visuals, and Broken visuals"></picture><figcaption><p>Per-report summary, with broken visuals</p></figcaption></figure>

| Column             | Content                                                                                                                                                                                                 |
| ------------------ | ------------------------------------------------------------------------------------------------------------------------------------------------------------------------------------------------------- |
| **Report**         | Name of the analyzed report                                                                                                                                                                             |
| **Type**           | Report type                                                                                                                                                                                             |
| **Pages**          | Number of pages                                                                                                                                                                                         |
| **Visuals**        | Number of visuals                                                                                                                                                                                       |
| **Broken visuals** | Visuals that display at least one field that **no longer exists** in the model (a sign of a column or measure deleted/renamed after the report's last edit). Highlighted in red when greater than zero. |

**How to use:**

1. Open the **Report results** tab.
2. Look at the **Broken visuals** column: values in red indicate reports with visuals that use fields that no longer exist in the model.
3. Open the report in Power BI and fix or remove the affected visuals.

## Rules and behavior

### What counts as "used"

A field is considered used when it appears in any of these places:

1. **Power BI reports bound to the model**: visual fields, visual filters, page filters, report filters (filter pane), visual sort order, and conditional formatting.
2. **Measures created in the report** (*report-level measures*), as long as the measure itself is used in the report.
3. **Relationships**: the key columns on both sides.
4. **Security**: tables and columns referenced by **RLS** roles and columns protected by **OLS**.
5. **Calculation groups and detail rows expressions** (default "See records"/drillthrough): the columns referenced in the DAX of calculation items and detail rows expressions always count as used.
6. **DAX dependencies**: everything that a **used** measure or calculated column references: in a chain (a used measure that references another measure, which references a column, makes all three used).
7. **Dependent composite models**: fields used by semantic models that consume this model (considering those models' reports, RLS, relationships, and dependencies). Matching is done by table/field name and covers **one level** of dependency.

### Protections against false "unused"

* **Security tables are never suggested for deletion.** A table used by an RLS role (even if it does not appear in any report) stays out of the unused list.
* **Reports without collected structure are ignored**, never treated as "using nothing". The coverage notice shows how many were left out.
* **A table with no named columns or measures** is never listed as unused.
* **A report measure that nobody uses does not count as usage**: the fields that only it references become *partially unused*.
* **Ambiguous DAX references are discarded.** When in doubt, the analysis prefers not to mark a usage rather than invent one.

### Where the data comes from

* **Report structure** (pages, visuals, filters, report measures): collected by the **Report Structure** routine, which by default runs daily (around 10:50 PM Brasília time, UTC-3; an administrator can change the frequency to weekly or monthly in [Settings › Monitoring](/en/power-monitor/configuracoes/monitoramento.md#run-frequency)) and can be triggered manually by an administrator in *Mapping › Models and reports › Report Structure*.
* **Model definition** (tables, columns, measures, expressions, relationships, RLS/OLS roles): collected by the inventory and model mapping scans.
* Only **Power BI reports** are analyzed; paginated reports are not included in the usage calculation.
* **Workspace scope**: the search shows only models of the workspaces you can view.
* **Microsoft standard artifacts.** Models created by Microsoft itself (such as the Fabric Capacity Metrics app and the usage metrics models) are not analyzed: they do not even appear in the search suggestions and, if one of them is opened some other way, the screen says *This is a Microsoft standard artifact and is not analyzed here.* (it is not treated as an error). The rule is the same as in the other analyses (the search follows your organization's policy) and can be configured by Administrators (see [Microsoft standard artifacts](/en/power-monitor/qualidade-de-dados/exposicao-de-dados.md#microsoft-standard-artifacts)).

## Step by step: common scenarios

### How to complete the analysis coverage

1. If the notice *"{N} of {total} reports bound to this model were not included in this analysis..."* appears, ask an **administrator** to run the scan in *Mapping › Models and reports › Report Structure* (or wait for the automatic daily run).
2. After the scan finishes, return to Model Cleanup and click **Run again** in the model strip.
3. Confirm that the coverage notice has disappeared before using the list of unused items.

### How to clean up a model safely

{% stepper %}
{% step %}

### Select the model and check coverage

Search for the model. If the notice about reports without captured structure appears, ask an administrator to run the **Report Structure** routine and click **Run again**.
{% endstep %}

{% step %}

### Review the Unused tab

Start with the **unused columns** of imported tables: they are the ones that reduce the model size the most. Leave the *partially unused* items for later: first remove the dead report measures.
{% endstep %}

{% step %}

### Confirm usages outside the scope

Check whether any item is consumed by Data Agents, Fabric Apps, Analyze in Excel, notebooks, or external queries: usages that this screen does not see.
{% endstep %}

{% step %}

### Back up and remove

Save a copy of the model (for example, the .pbix/.pbip file or the Git repository), remove the items in your modeling tool, and publish.
{% endstep %}

{% step %}

### Check the reports

After the next scan, run the analysis again and check the **Report results** tab: *Broken visuals* should remain at zero.
{% endstep %}
{% endstepper %}

## Frequently asked questions

<details>

<summary>Is Model Cleanup different from the "Remove unused columns" rule of the Best Practices Score?</summary>

Yes. The BPA rule only looks inside the model (DAX expressions and relationships) and only evaluates hidden items. Model Cleanup also considers **everything the reports use** (visuals, filters, sort order, conditional formatting, report measures), security, and dependent composite models.

</details>

<details>

<summary>A column appears as unused, but it is used in "Analyze in Excel" or by a Data Agent.</summary>

These usages are not analyzed. The screen covers only semantic models and the Power BI reports bound to them. Always confirm before deleting.

</details>

<details>

<summary>What are "broken visuals"?</summary>

They are visuals that display at least one field that no longer exists in the model: usually a column or measure that was deleted or renamed after the report's last edit. These visuals show an error to users and must be fixed in the report.

</details>

<details>

<summary>Why do the security filter direction and cardinality appear empty for some relationships?</summary>

This information comes from the full model definition. When it is not available for that model, the fields stay empty instead of displaying an assumed value.

</details>

<details>

<summary>Can the screen delete the items automatically?</summary>

No. Power Monitor is a read-only monitoring and governance platform and never changes your semantic models.

</details>

## Related pages

* [Best Practices Score](/en/power-monitor/qualidade-de-dados/score-de-boas-praticas-bpa.md)
* [Data Lineage](/en/power-monitor/qualidade-de-dados/linhagem-de-dados.md): composite models and reports bound to the model
* [Mapping](/en/power-monitor/mapeamento.md): scans that feed the analysis
* [Model Size](/en/power-monitor/mapeamento/tamanho-de-modelos.md)


---

# Agent Instructions
This documentation is published with GitBook. GitBook is the documentation platform designed so that both humans and AI agents can read, navigate, and reason over technical content effectively. Learn more at gitbook.com.

## Querying This Documentation
If you need additional information that is not directly available in this page, you can query the documentation by asking a question.

Perform an HTTP GET request on the following URL with the `ask` and `goal` query parameters:

```
GET https://docs.powermonitor.com.br/en/power-monitor/performance/limpeza-de-modelo.md?ask=<question>&goal=<user_goal>
```

`ask` is the immediate question: it should be specific, self-contained, and written in natural language.
`goal` is what the user is ultimately trying to achieve, the reason they need the answer. Sharing it helps GitBook give you a better, more relevant answer. A goal is most helpful when it describes the outcome the user wants rather than restating the question. For example, with `ask=how do I create an API token`, a goal like `automate deployments from our CI pipeline` lets GitBook tailor the answer to that use case.

The response will contain a direct answer to the question and relevant excerpts and sources from the documentation.

Use this mechanism when the answer is not explicitly present in the current page, you need clarification or additional context, or you want to retrieve related documentation sections.