> For the complete documentation index, see [llms.txt](https://docs.powermonitor.com.br/llms.txt). Markdown versions of documentation pages are available by appending `.md` to page URLs; this page is available as [Markdown](https://docs.powermonitor.com.br/en/power-monitor/performance/tempo-medio-de-execucao.md).

# Average Execution Time

Identify semantic models, Data Pipelines, Copy Jobs, Dataflows, and Notebooks whose last run was above the historical average time and receive email alerts when the deviation is large.

**Average execution time deviation monitoring** notifies you when a load starts taking longer than usual. A refresh that usually takes 20 minutes and suddenly takes 1 hour almost always indicates a problem, such as volume growth, a bottleneck at the source, capacity contention, or a logic change, even when the run finishes successfully.

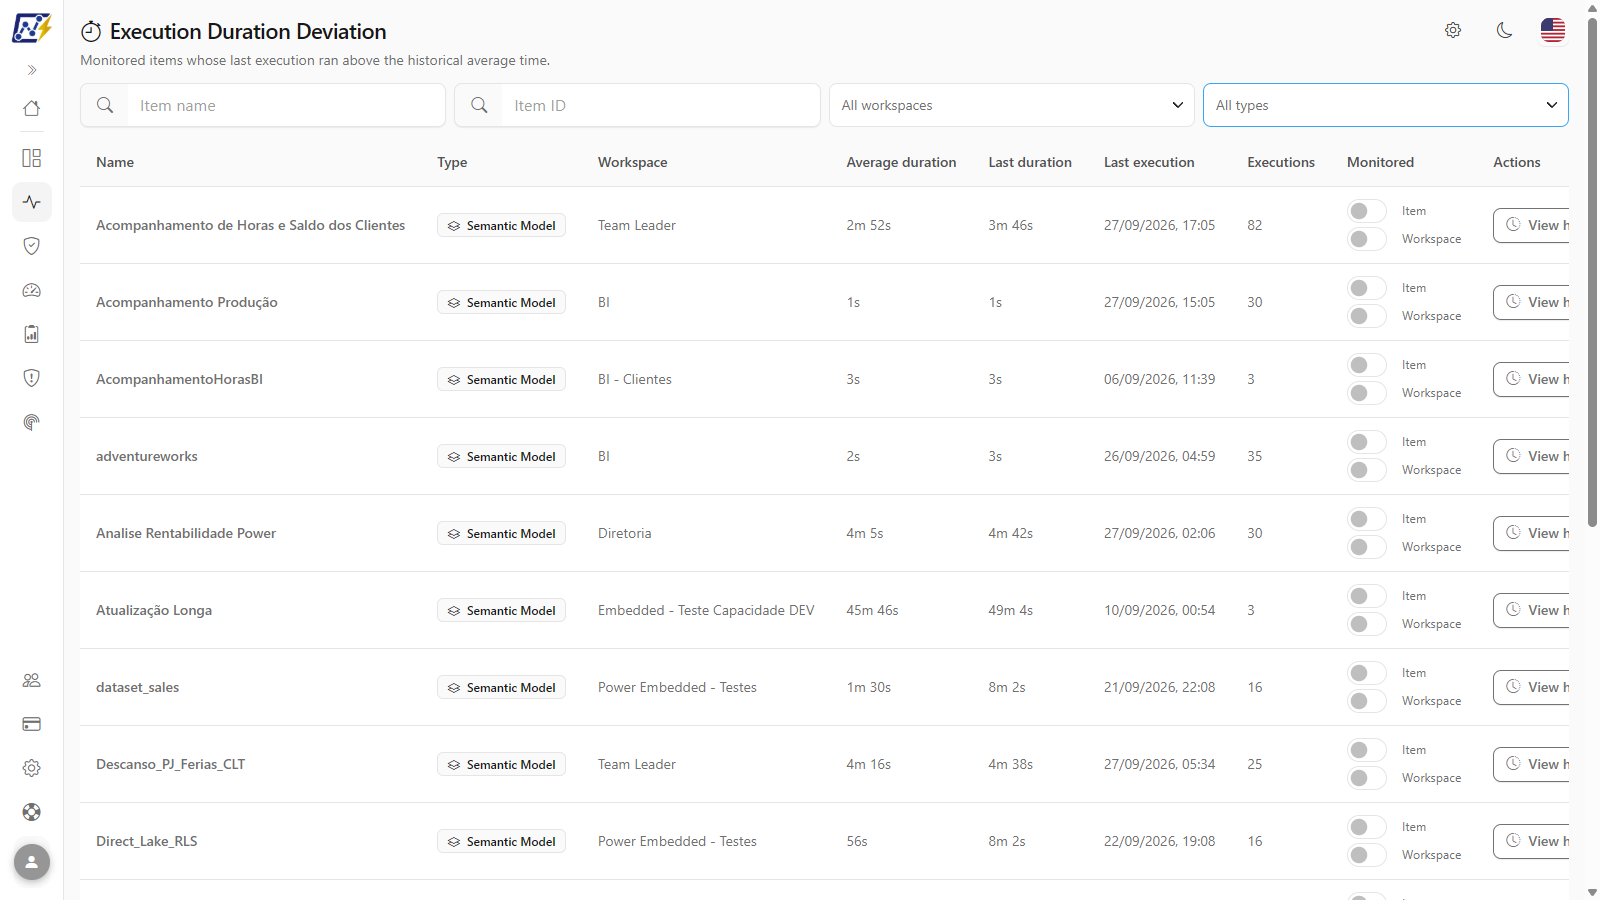
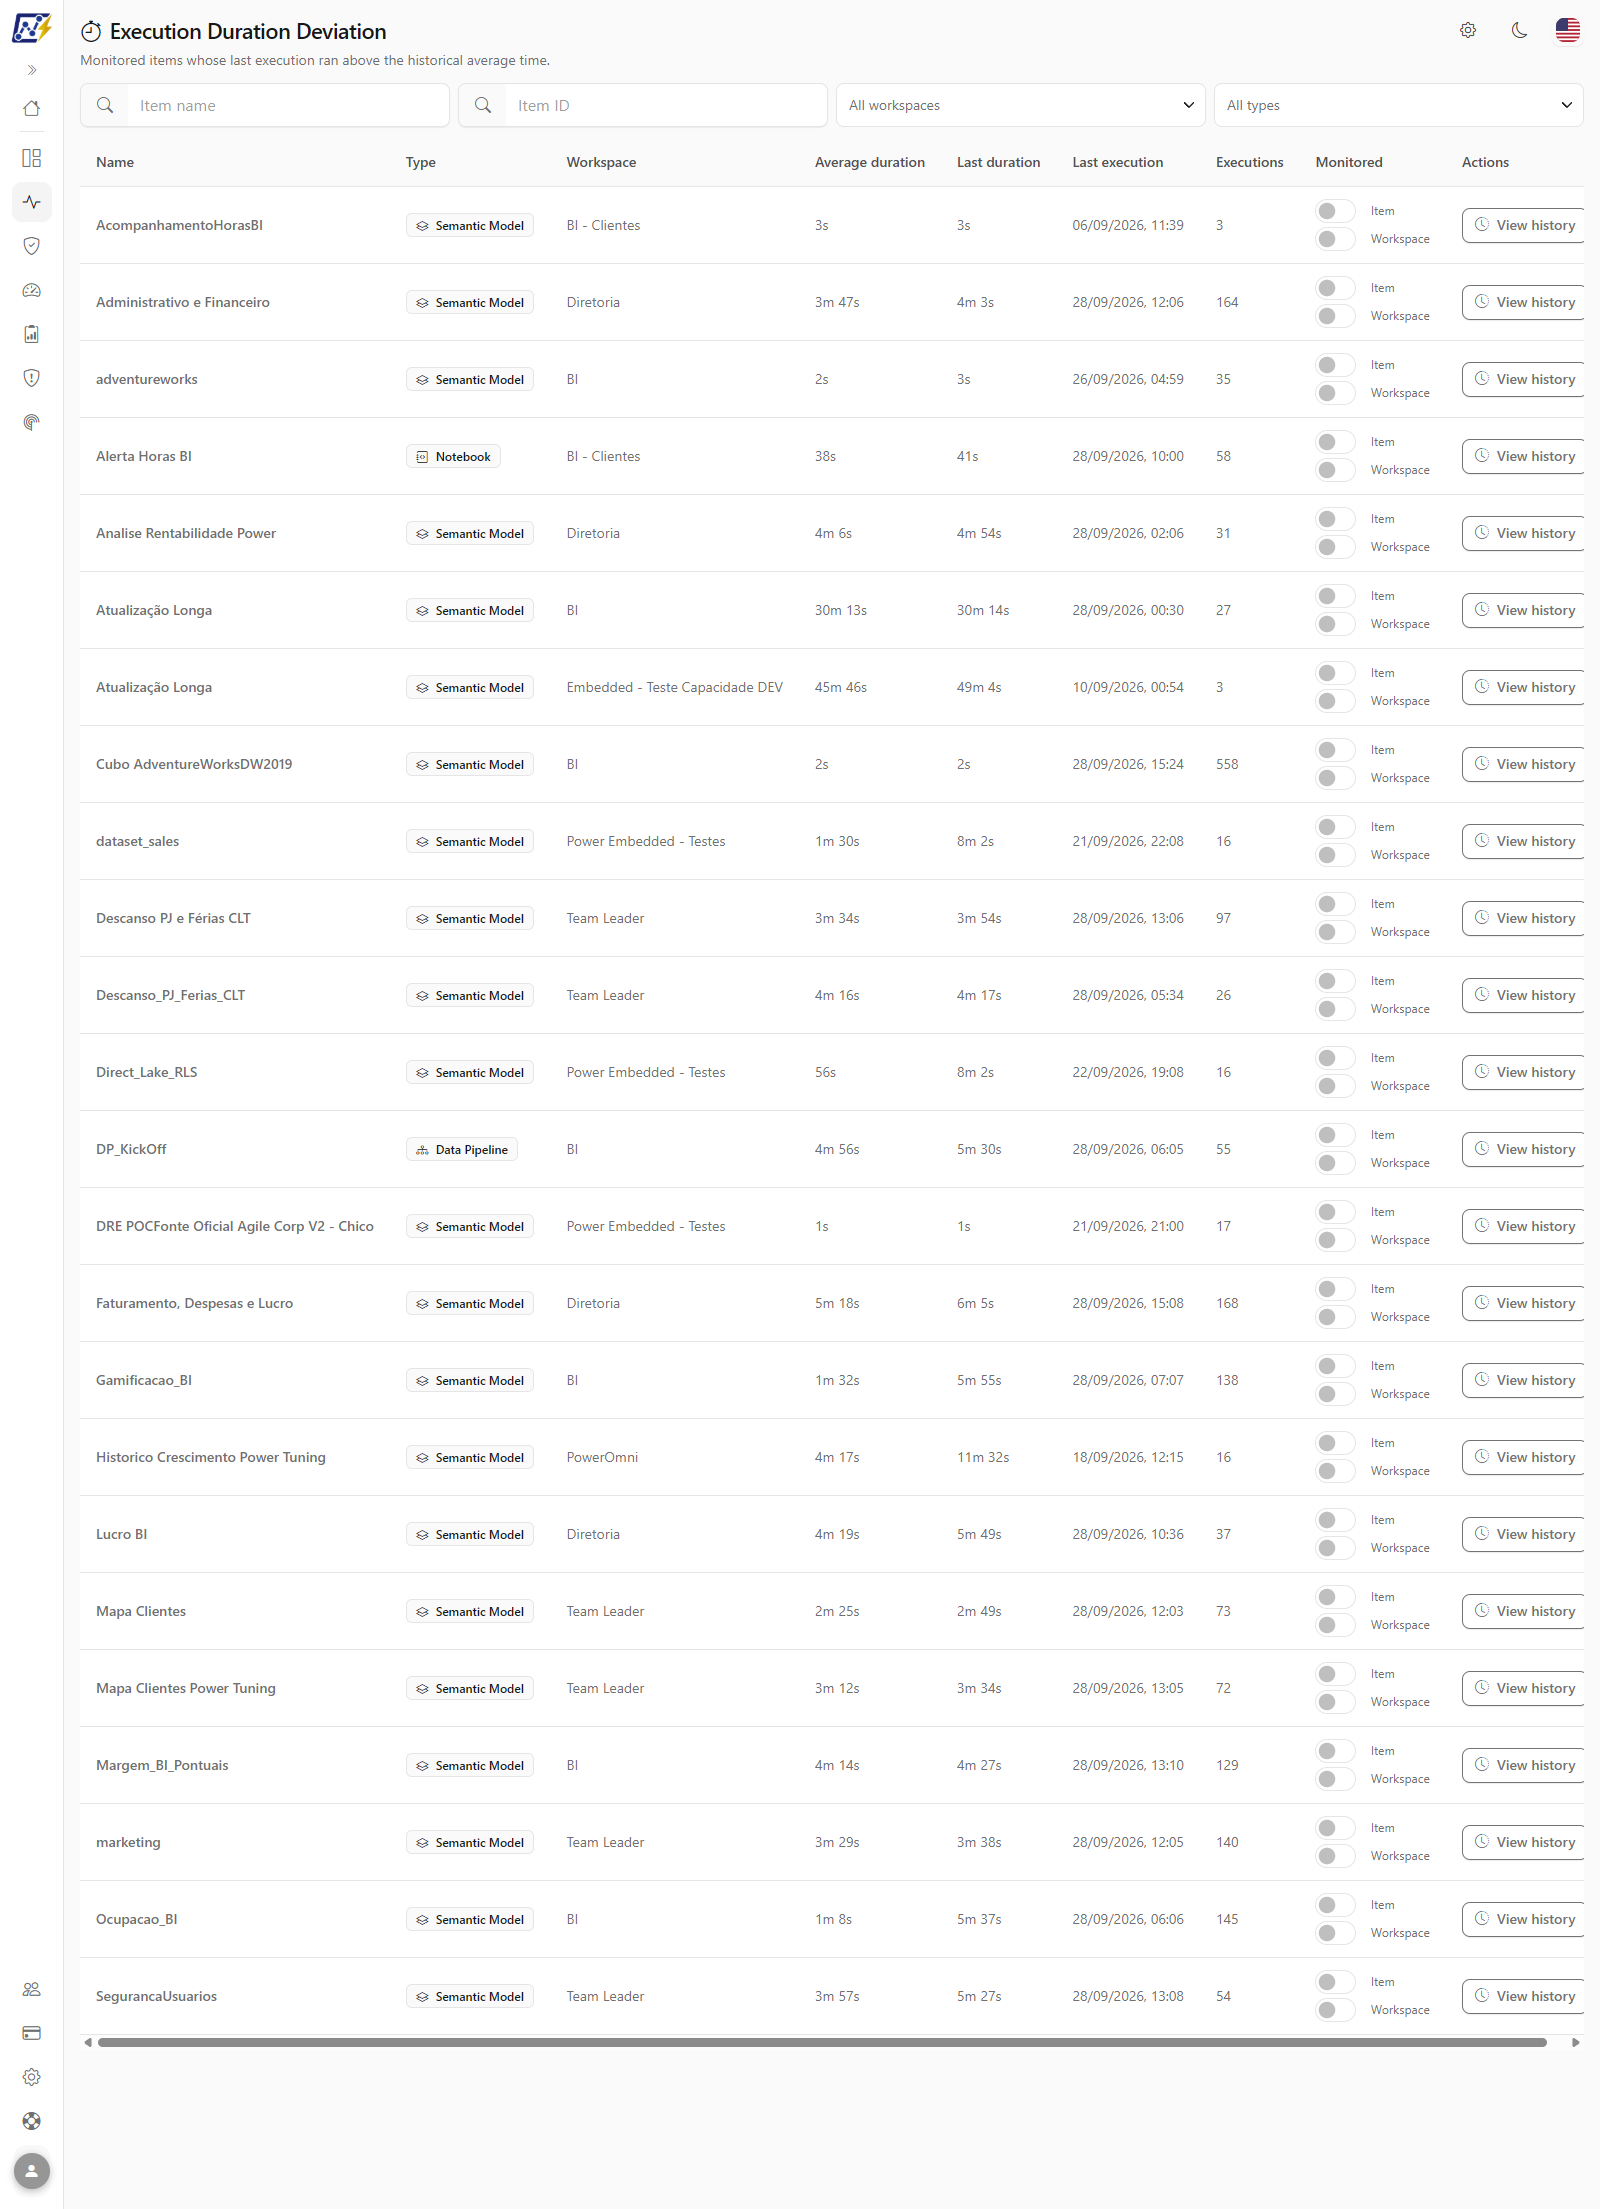
The **Average Execution Time** screen (page title: **Execution Duration Deviation**) lists the monitored items whose **last run was above the historical average time beyond the thresholds set by your organization** (percentage above average and minimum average, in *Settings › Monitoring*) and lets you turn monitoring on or off per item and per workspace.

**How to access:** menu *Performance › Average Execution Time*.

The view is available to **all** user **profiles**, respecting each user's **workspace scope** (users with restricted visibility see only the items of the allowed workspaces). The monitoring toggles can only be changed by **administrators**: for other profiles they appear disabled, with the message *"This action is restricted to organization administrators."*. An administrator can also block this page for specific users (see [Users](/en/power-monitor/usuarios.md)).

<figure><picture><source srcset="/files/71kDN9D9ubBHX5L9cKcw" media="(prefers-color-scheme: dark)"><img src="https://3938213054-files.gitbook.io/~/files/v0/b/gitbook-x-prod.appspot.com/o/spaces%2FH2bFRBmIfyK3kwVKbldl%2Fuploads%2Fgit-blob-a5464bccaa80f568644821485a3570291e3d0394%2Fpm-monitoramento-tempo-medio-execucao-en.png?alt=media" alt="Execution Duration Deviation screen with filters and a table of items with average duration, last duration, and monitoring toggles"></picture><figcaption><p>Execution Duration Deviation screen</p></figcaption></figure>

## What it is for

* **Detect degradation before failure:** a load that gets slower and slower usually overruns the refresh window or the timeout days later. The duration deviation shows the problem before that.
* **Protect data SLAs:** find out early that the executive report's semantic model took twice as long as usual today.
* **Investigate capacity consumption:** longer runs consume more Capacity Units (CU). A duration deviation helps explain consumption spikes.
* **Receive email alerts** only when the deviation is relevant (configurable percentage and minimum duration), without noise from fast items.

## Item types covered

| Type                         | Where the duration comes from                                                              |
| ---------------------------- | ------------------------------------------------------------------------------------------ |
| **Semantic Model**           | Refresh history of semantic models (collected every 15 minutes).                           |
| **Data Pipeline**            | Fabric job runs (collected every 2 hours).                                                 |
| **Copy Job**                 | Fabric job runs (collected every 2 hours).                                                 |
| **Notebook**                 | Fabric job runs (collected every 2 hours).                                                 |
| **Dataflow** (Gen1 and Gen2) | Gen2: Fabric job runs (every 2 hours). Gen1: Power BI transaction history (every 2 hours). |

{% hint style="info" %}
For there to be duration history for Fabric items (Data Pipeline, Copy Job, Notebook, and Dataflow Gen2), **Fabric Jobs** monitoring must be enabled in *Settings › Monitoring*, and the Power Monitor service principal must have access to the workspace. The history is collected for all items, whether deviation monitoring is turned on for them or not. So, when you turn on monitoring for an item, the average already starts with the existing history.
{% endhint %}

## Features

### Enable the deviation alert (Settings › Monitoring)

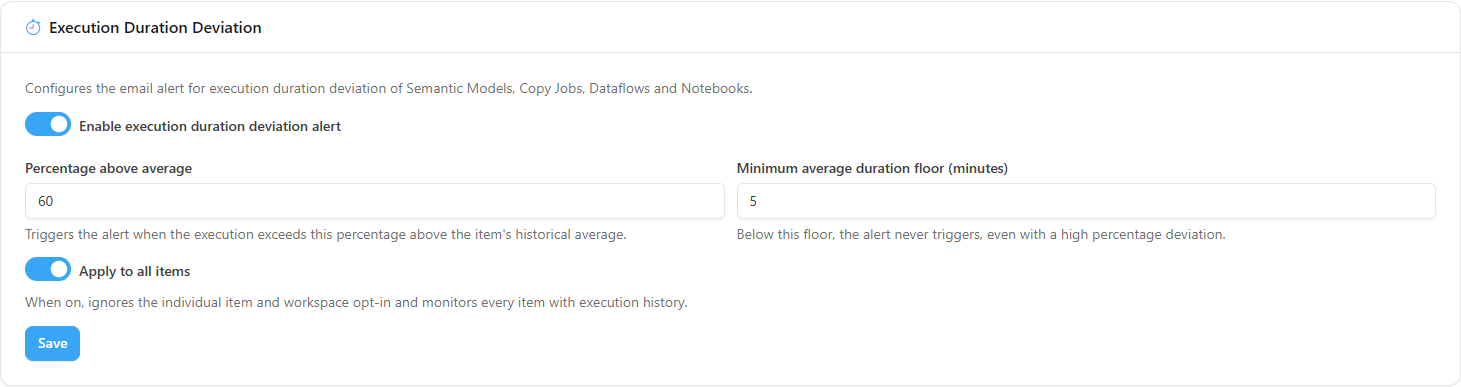
**What it is.** The **Execution Duration Deviation** section in *Settings › Monitoring*, where an **Administrator** turns on detection for the organization and defines the sensitivity of the email alert.

**What it is for.** It is the prerequisite for the screen: with the alert turned off, the list is always empty. It also defines when it is worth notifying someone (percentage and minimum floor), avoiding noise from fast items.

<figure><picture><source srcset="/files/p9NSULKhNGD53wEkGGtE" media="(prefers-color-scheme: dark)"><img src="https://3938213054-files.gitbook.io/~/files/v0/b/gitbook-x-prod.appspot.com/o/spaces%2FH2bFRBmIfyK3kwVKbldl%2Fuploads%2Fgit-blob-b951431e603208ec35b9bea15a2df931131f58f0%2Fpm-configuracoes-monitoramento-desvio-tempo-en.png?alt=media" alt="Execution Duration Deviation section in Settings › Monitoring"></picture><figcaption><p>Deviation alert configuration in Settings › Monitoring</p></figcaption></figure>

**How to use**

Prerequisite: **Administrator** profile.

{% stepper %}
{% step %}

#### Open the configuration

Go to *Settings › Monitoring* and find the **Execution Duration Deviation** section.
{% endstep %}

{% step %}

#### Turn on the alert

Select **Enable execution duration deviation alert**.
{% endstep %}

{% step %}

#### Adjust the sensitivity

Enter the **Percentage above average** (1 to 1000) and the **Minimum average duration floor (minutes)** (0 to 1440).
{% endstep %}

{% step %}

#### Define the scope

To monitor everything without selecting item by item, turn on **Apply to all items**. Otherwise, choose the items and workspaces with the toggles (see ["Item" and "Workspace" toggles](#item-and-workspace-toggles) and [Turn on monitoring from the Governance screens](#turn-on-monitoring-from-the-governance-screens)).
{% endstep %}

{% step %}

#### Save

Click **Save**. The message *Settings saved successfully.* confirms it was saved.
{% endstep %}
{% endstepper %}

**How it works**

| Field                                         | Default | Effect                                                                                                                              |
| --------------------------------------------- | ------- | ----------------------------------------------------------------------------------------------------------------------------------- |
| **Enable execution duration deviation alert** | Off     | Turns on detection and email sending for the organization. It is also a prerequisite for the screen to display items.               |
| **Percentage above average**                  | 60%     | The email is triggered when the run exceeds the average by more than this percentage. Accepts 1 to 1000.                            |
| **Minimum average duration floor (minutes)**  | 10      | If the item's average is lower than this value, the alert never triggers, even with a high percentage deviation. Accepts 0 to 1440. |
| **Apply to all items**                        | Off     | Ignores the item and workspace toggles and monitors every item with execution history.                                              |

The fields are saved together with the **Save** button. See also [Settings](/en/power-monitor/configuracoes.md) and the [Email trigger rule](#email-trigger-rule).

### Filters by name, ID, workspace, and type

**What it is.** The filter strip at the top of the screen: two search fields (**Item name** and **Item ID**) and two multi-select lists with search (**All workspaces** and **All types**).

**What it is for.** Focusing the analysis on one item, on a critical workspace, or on a load type (for example, only the overnight **Data Pipeline** runs).

<figure><picture><source srcset="/files/D24Zmrk42Nf3kutk2X2T" media="(prefers-color-scheme: dark)"><img src="https://3938213054-files.gitbook.io/~/files/v0/b/gitbook-x-prod.appspot.com/o/spaces%2FH2bFRBmIfyK3kwVKbldl%2Fuploads%2Fgit-blob-d397025c84556ff72f46a5cb252486b8ab352928%2Fpm-monitoramento-tempo-medio-execucao-filtros-en.png?alt=media" alt="Filter strip with Item name, Item ID, All workspaces, and All types"></picture><figcaption><p>Execution Duration Deviation screen filters</p></figcaption></figure>

**How to use**

1. Type part of the name in **Item name** (case-insensitive) or the item's full Power BI/Fabric GUID in **Item ID**. The list reloads as you type.
2. Click **All workspaces** and select one or more workspaces. Use the panel's search field to find the workspace by name.
3. Click **All types** and select one or more types: **Semantic Model**, **Copy Job**, **Dataflow**, **Notebook**, or **Data Pipeline**.
4. To clear a selection list, click the **×** next to it.

<figure><picture><source srcset="/files/f1S5tYZydZF12uPoFbuc" media="(prefers-color-scheme: dark)"><img src="https://3938213054-files.gitbook.io/~/files/v0/b/gitbook-x-prod.appspot.com/o/spaces%2FH2bFRBmIfyK3kwVKbldl%2Fuploads%2Fgit-blob-f8844c3a708e2b9dd08c1e19a2f131b0b4c94597%2Fpm-monitoramento-tempo-medio-execucao-filtro-tipos-en.png?alt=media" alt="All types list open with Semantic Model, Copy Job, Dataflow, Notebook, and Data Pipeline"></picture><figcaption><p>Multi-select of item types</p></figcaption></figure>

**How it works.** List selections are applied right after the last selection (there is a short delay to avoid a reload on every click). If nothing matches the filters, the screen displays **No anomalies right now**; adjust the filters to see another slice.

### Table of items above average

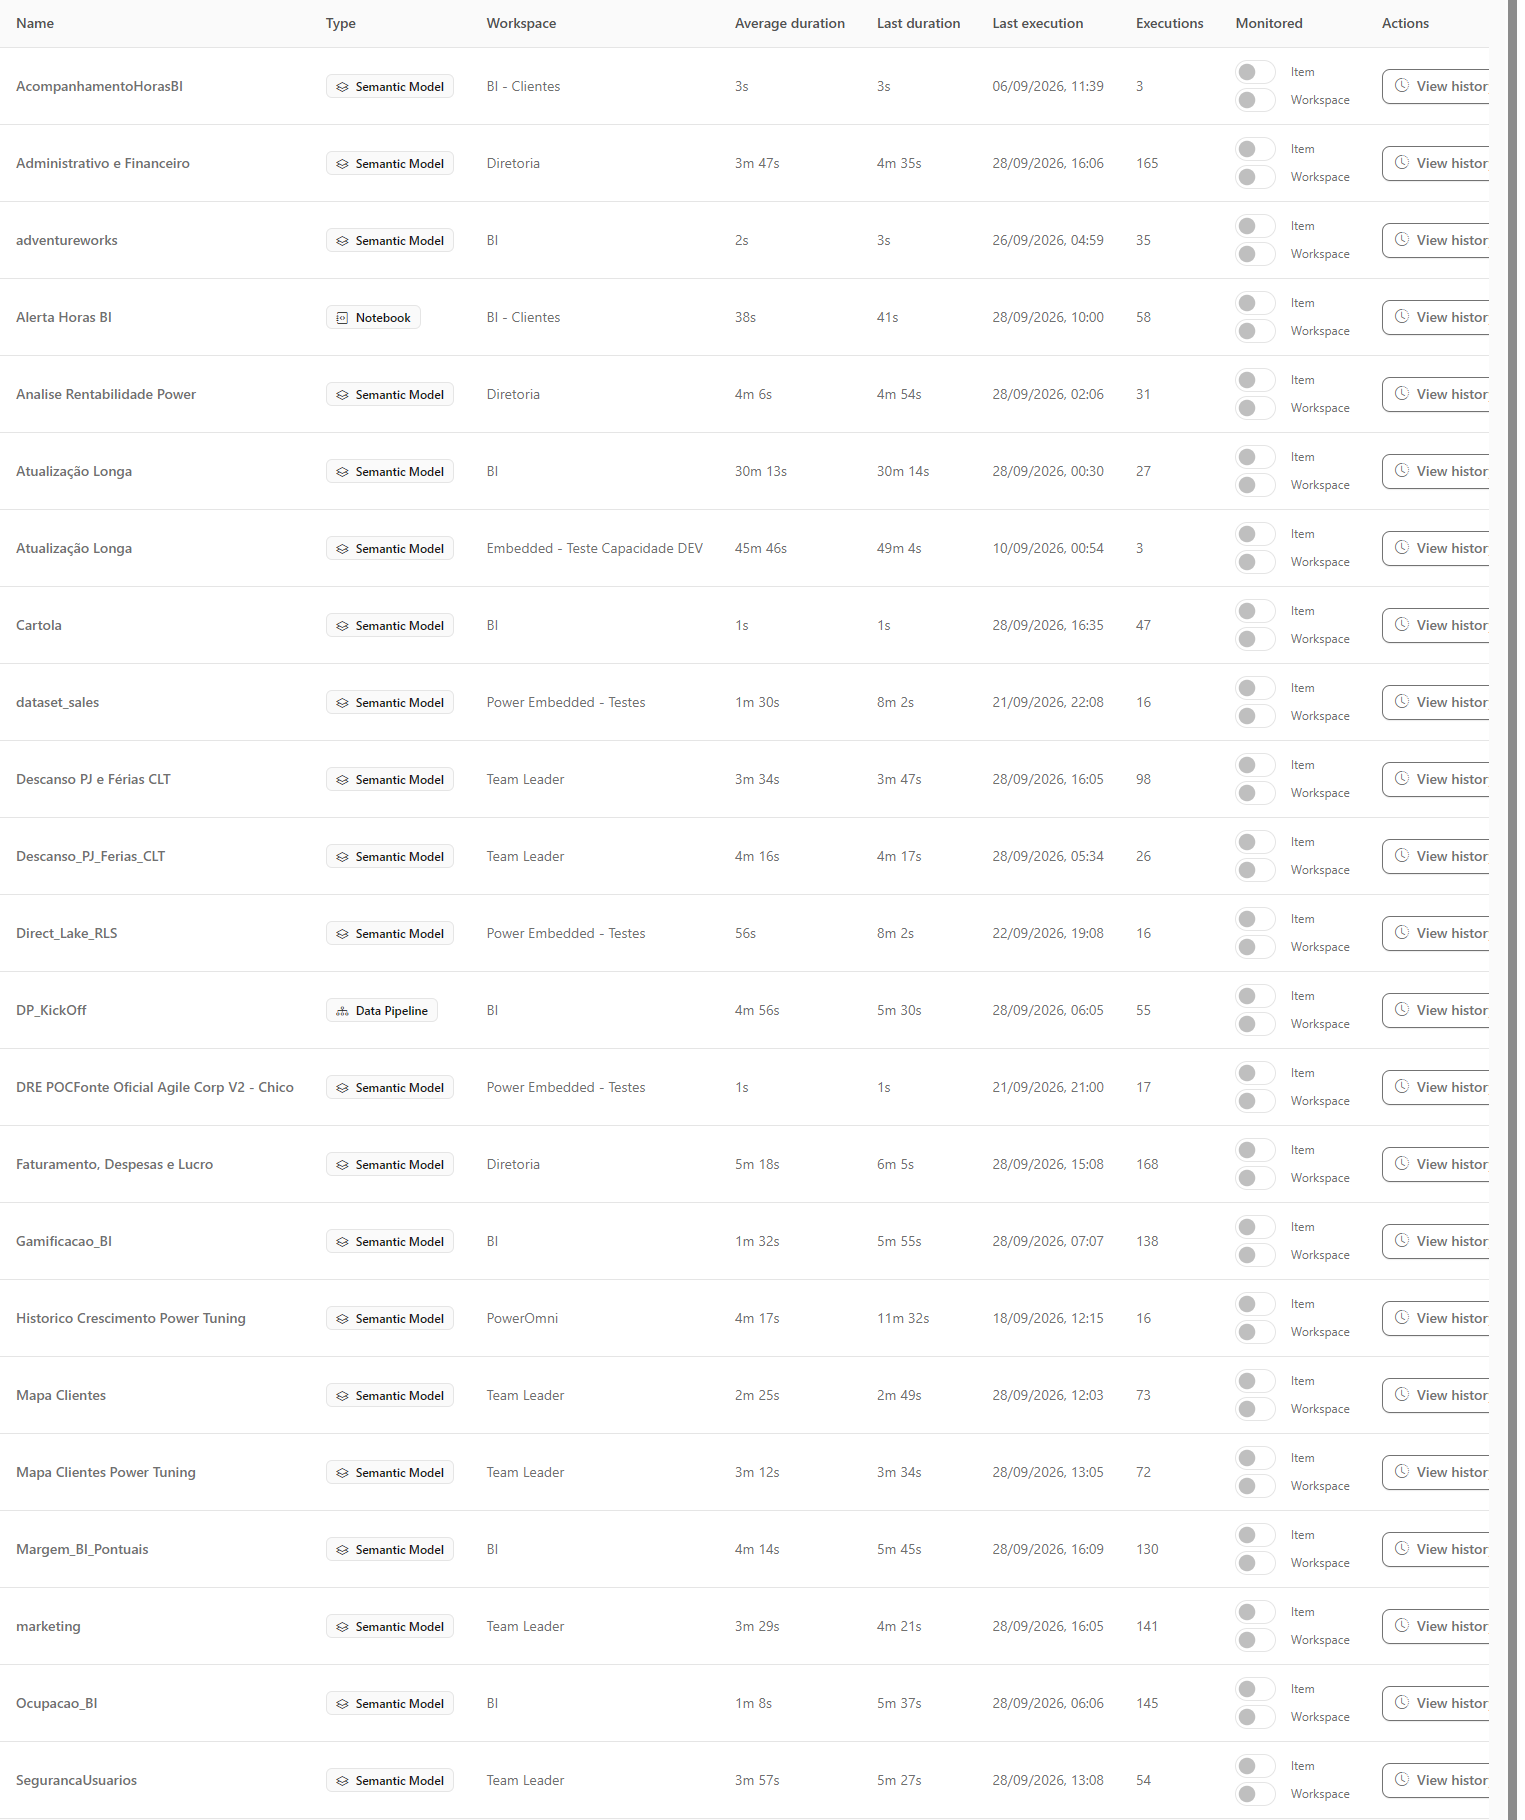
**What it is.** The list of monitored items whose **last run was above the historical average time and the organization's thresholds** (see [Thresholds applied to the list](#thresholds-applied-to-the-list)), in alphabetical order, with average duration, last duration, date of the last run, and number of runs used in the calculation.

**What it is for.** Seeing at a glance what is slower than usual right now and by how much: for example, a model that usually takes 20 minutes and took 1 hour.

<figure><picture><source srcset="/files/rJCCmJBq6GDaarSAKc5W" media="(prefers-color-scheme: dark)"><img src="https://3938213054-files.gitbook.io/~/files/v0/b/gitbook-x-prod.appspot.com/o/spaces%2FH2bFRBmIfyK3kwVKbldl%2Fuploads%2Fgit-blob-56a2c161fb3ce6fdbf6eb27cbca6d108789bfe0c%2Fpm-monitoramento-tempo-medio-execucao-linha-item-en.png?alt=media" alt="Table with name, type, workspace, average duration, last duration, last execution, executions, toggles, and the View history button"></picture><figcaption><p>Items table: average duration vs last duration</p></figcaption></figure>

**How to use**

1. In each row, compare **Average duration** with **Last duration**.
2. Check **Executions** to know how many runs make up the average: few runs make the average less representative.
3. Click the ⋮ menu at the end of the row (or right-click the row) and choose **View history** to open the item's [execution history](#execution-history-modal).

**How it works**

| Column                         | Meaning                                                                                                     |
| ------------------------------ | ----------------------------------------------------------------------------------------------------------- |
| **Name**                       | Item name.                                                                                                  |
| **Type**                       | Semantic Model, Copy Job, Dataflow, Notebook, or Data Pipeline.                                             |
| **Workspace**                  | The item's workspace.                                                                                       |
| **Average duration**           | Average duration of all stored runs of the item (includes the last one).                                    |
| **Last duration**              | Duration of the most recent run.                                                                            |
| **Last execution**             | Date and time of the most recent run.                                                                       |
| **Executions**                 | Number of stored runs used in the calculation.                                                              |
| **Monitored**                  | **Item** and **Workspace** toggles (see below).                                                             |
| **Actions** (no visible title) | ⋮ button with the row menu, which contains **View history**. The same menu opens by right-clicking the row. |

* Durations appear in a compact format: `45s`, `12m 30s`, `1h 25m`, or `2d 3h`.
* When no item is above average, the screen shows *No anomalies right now*, which is good news. The conditions for an item to appear are in [Which items appear in the list](#which-items-appear-in-the-list).
* If the query fails, *Error loading monitored items.* appears with the **Try again** button.

### Thresholds applied to the list

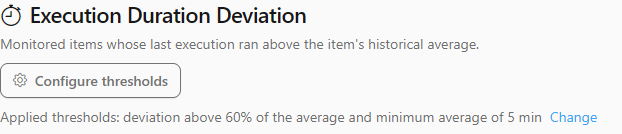
**What it is.** A line right below the screen title with the organization's thresholds used to build the list: *"Applied thresholds: deviation above X% of the average and minimum average of Y min"*, followed by the **Change** link, and the **Configure thresholds** button.

**What it is for.** Understanding why an item appears (or not) in the list and adjusting the sensitivity without hunting for the setting.

<figure><picture><source srcset="/files/F2pTNgOD7odqMTNdWq97" media="(prefers-color-scheme: dark)"><img src="https://3938213054-files.gitbook.io/~/files/v0/b/gitbook-x-prod.appspot.com/o/spaces%2FH2bFRBmIfyK3kwVKbldl%2Fuploads%2Fgit-blob-c1cc9c575bf76d3c554b6f7695310d7eac393288%2Fpm-performance-tempo-medio-execucao-limites-en.png?alt=media" alt="Screen header with the Configure thresholds button and the Applied thresholds line with the Change link"></picture><figcaption><p>Thresholds applied to the list and shortcut to the setting</p></figcaption></figure>

**How to use**

1. Read the thresholds line to know the percentage and minimum average in effect (the default is 60% and 10 minutes).
2. To change them (**Administrator** profile), click **Change** or **Configure thresholds**: it opens *Settings › Monitoring* already scrolled to the **Execution Duration Deviation** block.
3. Adjust the fields and click **Save**. On the next query of the screen, the list uses the new thresholds.

**How it works**

* The thresholds are those of *Settings › Monitoring* and the rule is the same as the alert email: the item appears when the **average** is **greater than or equal to** the minimum average and the **last duration** is **greater than** *average × (1 + percentage ÷ 100)*. The percentage is exclusive and the minimum average is inclusive (see [Email trigger rule](#email-trigger-rule)).
* The **Change** link and the **Configure thresholds** button only appear for those who can open *Settings* (administrators whose page has not been blocked). Other profiles see the hint *"Ask an administrator to adjust the thresholds in Settings."*.
* If the server does not report the thresholds, the **Applied thresholds** line is not displayed.

### "Item" and "Workspace" toggles

**What it is.** Two toggles in the **Monitored** column of each row: **Item** (monitoring only that item) and **Workspace** (monitoring all eligible items in the workspace).

**What it is for.** Deciding, directly from the screen, what keeps being tracked: for example, turning off a test item that always varies, or turning on the entire workspace of a critical product.

**How to use**

Prerequisite: **Administrator** profile. For other profiles, the toggles appear disabled with the hint *This action is restricted to organization administrators.*

1. In the **Monitored** column, click the **Item** toggle to turn only that item on or off.
2. Or click the **Workspace** toggle to turn on or off all eligible items in the workspace, including those that do not yet appear in the list. All rows of the same workspace reflect the change.
3. The change is saved immediately, with no confirmation message (a loading indicator appears next to the toggle); if it fails, the toggle returns to its previous position.

**How it works**

* An item is monitored when **the item itself OR its workspace** is turned on (or when **Apply to all items** is active). One of the two is enough; that is why the screen shows both side by side, making it clear which one is turning monitoring on.
* The **Item** toggle is disabled when the item has been deleted from the environment (*Deleted item. The individual opt-in is no longer available.*). The **Workspace** toggle is disabled when the item's workspace could not be identified (*This item has no resolved workspace.*).

{% hint style="warning" %}
Because the list shows only items that are **already monitored**, turning off both toggles of an item makes it disappear the next time the screen is loaded. To **turn on** monitoring for an item that is not yet in the list, use the Governance screens (see [Turn on monitoring from the Governance screens](#turn-on-monitoring-from-the-governance-screens)) or the **Apply to all items** option in the settings.
{% endhint %}

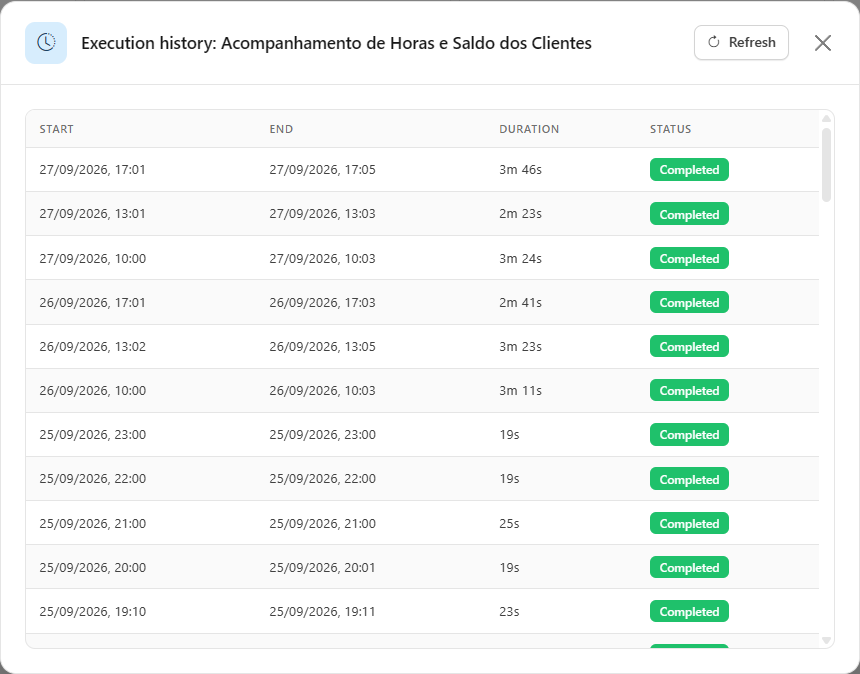
### "Execution history" modal

**What it is.** The **Execution history:** modal, opened by the **View history** option of the row's ⋮ menu, with all stored runs of the item, from most recent to oldest.

**What it is for.** Seeing whether the deviation is an isolated case or a growth trend, and identifying atypical runs (for example, a failure that pulled the average up).

<figure><picture><source srcset="/files/KXfpdcsB7ETSxxiexfB2" media="(prefers-color-scheme: dark)"><img src="https://3938213054-files.gitbook.io/~/files/v0/b/gitbook-x-prod.appspot.com/o/spaces%2FH2bFRBmIfyK3kwVKbldl%2Fuploads%2Fgit-blob-2abcb303714a983540c60cf80a55d4452834c1e8%2Fpm-monitoramento-tempo-medio-execucao-modal-historico-en.png?alt=media" alt="Execution history modal with the Start, End, Duration, and Status columns"></picture><figcaption><p>Execution history of an item</p></figcaption></figure>

**How to use**

{% stepper %}
{% step %}

#### Open the history

On the item's row, open the ⋮ menu (or right-click the row) and click **View history**.
{% endstep %}

{% step %}

#### Identify the pattern

Go through the runs with **Start**, **End**, **Duration**, and **Status**. Check whether the deviation is a one-off (an isolated run) or a growth trend over the last runs. Runs with **Failed** status also count toward the average.
{% endstep %}

{% step %}

#### Reload, if needed

Click **Refresh** to fetch the runs again. Close the modal with the **X** or by clicking outside it.
{% endstep %}

{% step %}

#### Cross-check with consumption

To understand the impact on the capacity, check [Consumption Metrics](/en/power-monitor/monitoramento/metricas-de-consumo.md) and [Consumption Anomalies](/en/power-monitor/monitoramento/anomalias-de-consumo.md) for the same period. For semantic models, consider requesting a [Performance Assessment](/en/power-monitor/performance/avaliacao-de-performance.md).
{% endstep %}
{% endstepper %}

**How it works**

| Column       | Meaning                                                                                                                                   |
| ------------ | ----------------------------------------------------------------------------------------------------------------------------------------- |
| **Start**    | Start date and time of the run.                                                                                                           |
| **End**      | End date and time.                                                                                                                        |
| **Duration** | Duration of the run.                                                                                                                      |
| **Status**   | **Completed** (green), **Failed** (red), **In progress** (blue). Other statuses appear as reported by Microsoft (for example, cancelled). |

With no runs, the modal displays *No execution recorded for this item.*; if the query fails, *Error loading execution history.*

### Turn on monitoring from the Governance screens

**What it is.** The **Monitor execution duration deviation** field in the details of workspaces, semantic models, and data engineering items, on the Governance screens.

**What it is for.** Including in monitoring an item or workspace that does not yet appear on this screen (the screen only lists items that are already monitored). Needed only when **Apply to all items** is turned off.

**How to use**

Prerequisite: **Administrator** profile.

1. Open the resource detail on the corresponding Governance screen:
   * **Entire workspace:** *Governance › Workspaces* (see [Workspaces](/en/power-monitor/governanca/workspaces.md));
   * **Semantic model:** *Governance › Semantic Models* (see [Semantic Models (Governance)](/en/power-monitor/governanca/modelos-semanticos.md));
   * **Data Pipeline, Copy Job, Dataflow, or Notebook:** *Governance › Data and Engineering › Data Engineering* (see [Data Engineering](/en/power-monitor/governanca/dados-e-engenharia/engenharia-de-dados.md)).
2. Turn on the **Monitor execution duration deviation** field.
3. The item starts being evaluated with the history already collected and appears on this screen when its last run is above average.

## Rules and behavior

### How the average is calculated

* The **average** is the arithmetic mean of the duration of **all stored runs** of the item that have a recorded duration, **including the last run** and including runs that failed.
* The **last run** is the most recent one by end time (or start time, when it has not finished yet).
* **At least 2 runs** are required for there to be an average to compare against. With a single run, the item does not appear in the list and does not generate an alert.
* The rule is a **simple percentage above the average**, not a standard deviation. Runs that are **faster** than the average are never treated as an anomaly.

### Which items appear in the list

An item appears on the screen when **all** of the conditions below are true:

1. The deviation alert is **enabled** for the organization (in *Settings › Monitoring*). With it turned off, the list is always empty.
2. The item is **monitored**: item toggle on, **or** workspace toggle on, **or** the **Apply to all items** option active.
3. The item has **more than one** stored run.
4. The **last duration exceeds the average by the configured percentage** and the **item's average is equal to or greater than the minimum average** (the thresholds from *Settings › Monitoring*, the same as the email; see [Thresholds applied to the list](#thresholds-applied-to-the-list)). A run that is only slightly slower (for example, from 1s to 3s) or an item whose average is below the minimum does not appear.

{% hint style="info" %}
**The screen and the email use the same thresholds.** The screen answers *"what is slower than usual right now?"* with the same thresholds as the alert (percentage above average and minimum average). The differences: the screen compares with the average of all stored runs and shows the current state, while the email compares with the reference average of the last 7 days (or 30), is evaluated every hour, once per run, and is only sent if the alert is enabled and you are a recipient.
{% endhint %}

### Email trigger rule

Every hour, Power Monitor evaluates the monitored items and triggers the alert when:

* the item's **reference average** is **greater than or equal to the configured minimum floor**; **and**
* the **last duration** is **greater than** *reference average × (1 + percentage ÷ 100)*.

The email's **reference average** is the average of the runs in the **7 days before** the observed run (the observed run itself does not count). If there are no runs in those 7 days, the average of the **last 30 days** is used. With no runs in either window, the item does not generate an alert.

**Example** (percentage 60%, floor 10 min): a model with an average of 20 min triggers if the last refresh exceeds 32 min. A run of exactly 32 min does not trigger, because the limit is exclusive. A notebook with an average of 4 min never triggers, because it is below the floor.

### The alert email

* **Subject:** *\[ALERT] Execution time above normal - {item name} - {organization}*.
* **Content:** item name and type, workspace, average duration, observed duration, percentage above average, detection date, and a link to this screen.
* **One email per run:** the same run never generates two alerts. A new slow run generates a new alert.
* **Recipients:** organization administrators and users marked as **Receives alerts** in the item's workspace scope (see [Users](/en/power-monitor/usuarios.md)). Users excluded from the **Execution Duration Deviation** notification type in *Settings › Notifications* do not receive it.
* **Channel:** email only. This alert type is not sent to Teams, Slack, or Telegram.
* The occurrences also appear in the **Execution duration deviation** block of the Environment Checklist emails (daily and hourly).

## Frequently asked questions

<details>

<summary>The screen is empty. What could it be?</summary>

Check, in this order: (1) whether the alert is enabled in *Settings › Monitoring*; (2) whether there are monitored items (item toggle, workspace toggle, or **Apply to all items**); (3) whether the items have at least 2 collected runs. If all of that is correct, an empty screen simply means that no item exceeds the configured thresholds right now (for example, a run that went from 1s to 3s does not appear when the minimum average is 10 min).

</details>

<details>

<summary>An item appears on the screen, but I did not receive an email. Why?</summary>

The screen and the email apply the same thresholds (**Percentage above average** and **Minimum average duration floor (minutes)**), but the email compares the last run with the average of the 7 days before it (or of the last 30), is evaluated every hour and is sent once per run. An item with no previous runs in those windows appears on the screen, but does not generate an email. Also check whether you are a recipient (administrator, or user with **Receives alerts** on the workspace) and whether you are not excluded from the *Execution Duration Deviation* type in *Settings › Notifications*.

</details>

<details>

<summary>I turned off the toggle and the item disappeared from the list. Is that an error?</summary>

No. The screen lists only monitored items. Without the item toggle and the workspace toggle (and without **Apply to all items**), the item is no longer monitored and no longer appears.

</details>

<details>

<summary>Do failed runs count toward the average?</summary>

Yes. The average considers all stored runs with a recorded duration, regardless of status. Use the **View history** modal to identify atypical runs.

</details>

<details>

<summary>Why can't I change the toggles?</summary>

Only organization administrators can turn monitoring on or off. For other profiles, the screen is view-only.

</details>

<details>

<summary>How often is the alert evaluated?</summary>

Detection runs every hour on the data already collected. Because Fabric items and Dataflows Gen1 are collected every 2 hours, and semantic models every 15 minutes, the email may arrive some time after the run ends.

</details>

<details>

<summary>An item that got slower does not appear in the list. Why?</summary>

The list only shows items that exceed the organization's thresholds: the last duration must exceed the average by the **configured percentage** (exclusive) and the average must be **equal to or greater than the minimum average**. A run that went from 1s to 3s, or an item whose average is below the minimum, does not appear. See the thresholds in effect in the **Applied thresholds** line and, if needed, adjust them in *Settings › Monitoring*.

</details>

<details>

<summary>Why don't I see the Configure thresholds button?</summary>

The button and the **Change** link only appear for those who can open *Settings* (administrators). Other profiles see the hint to ask an administrator to adjust the thresholds.

</details>

## Related pages

* [Artifact Refreshes](/en/power-monitor/dashboards/atualizacoes-de-artefatos.md)
* [Semantic Models](/en/power-monitor/monitoramento/modelos-semanticos.md)
* [Microsoft Fabric Items](/en/power-monitor/monitoramento/itens-do-microsoft-fabric.md)
* [Data Freshness](/en/power-monitor/monitoramento/atualizacao-de-dados.md)
* [Alerts](/en/power-monitor/monitoramento/alertas.md)
* [Settings](/en/power-monitor/configuracoes.md)
* [Monitoring (overview)](/en/power-monitor/monitoramento.md)


---

# Agent Instructions
This documentation is published with GitBook. GitBook is the documentation platform designed so that both humans and AI agents can read, navigate, and reason over technical content effectively. Learn more at gitbook.com.

## Querying This Documentation
If you need additional information that is not directly available in this page, you can query the documentation by asking a question.

Perform an HTTP GET request on the following URL with the `ask` and `goal` query parameters:

```
GET https://docs.powermonitor.com.br/en/power-monitor/performance/tempo-medio-de-execucao.md?ask=<question>&goal=<user_goal>
```

`ask` is the immediate question: it should be specific, self-contained, and written in natural language.
`goal` is what the user is ultimately trying to achieve, the reason they need the answer. Sharing it helps GitBook give you a better, more relevant answer. A goal is most helpful when it describes the outcome the user wants rather than restating the question. For example, with `ask=how do I create an API token`, a goal like `automate deployments from our CI pipeline` lets GitBook tailor the answer to that use case.

The response will contain a direct answer to the question and relevant excerpts and sources from the documentation.

Use this mechanism when the answer is not explicitly present in the current page, you need clarification or additional context, or you want to retrieve related documentation sections.