> For the complete documentation index, see [llms.txt](https://docs.powermonitor.com.br/llms.txt). Markdown versions of documentation pages are available by appending `.md` to page URLs; this page is available as [Markdown](https://docs.powermonitor.com.br/en/power-monitor/qualidade-de-dados/dicionario-de-dados.md).
# Data Dictionary
Browse Gateway, Server, Database, Table, and Column and find out which semantic models and reports use each physical object in the environment, plus which notebooks, pipelines, Copy Jobs, and dataflow
The **Data Dictionary** organizes all the sources used by your semantic models in a physical tree (**Gateway › Server › Database › Table › Column**) and, for any node you choose, shows **where it is used**: which semantic models read that object and which reports access those models. The dictionary also has a branch for the **Fabric Lakehouses and Warehouses**, which shows which notebooks, pipelines, Copy Jobs, and dataflows **read** and **write** each table and column.
It is the reverse view of [Data Lineage](/en/power-monitor/qualidade-de-dados/linhagem-de-dados.md): lineage starts from **a model** and shows its sources; the dictionary starts from **a physical object** and shows all of its consumers.
**How to access:** *Data Quality › Data Dictionary*. Available to all profiles (read-only).
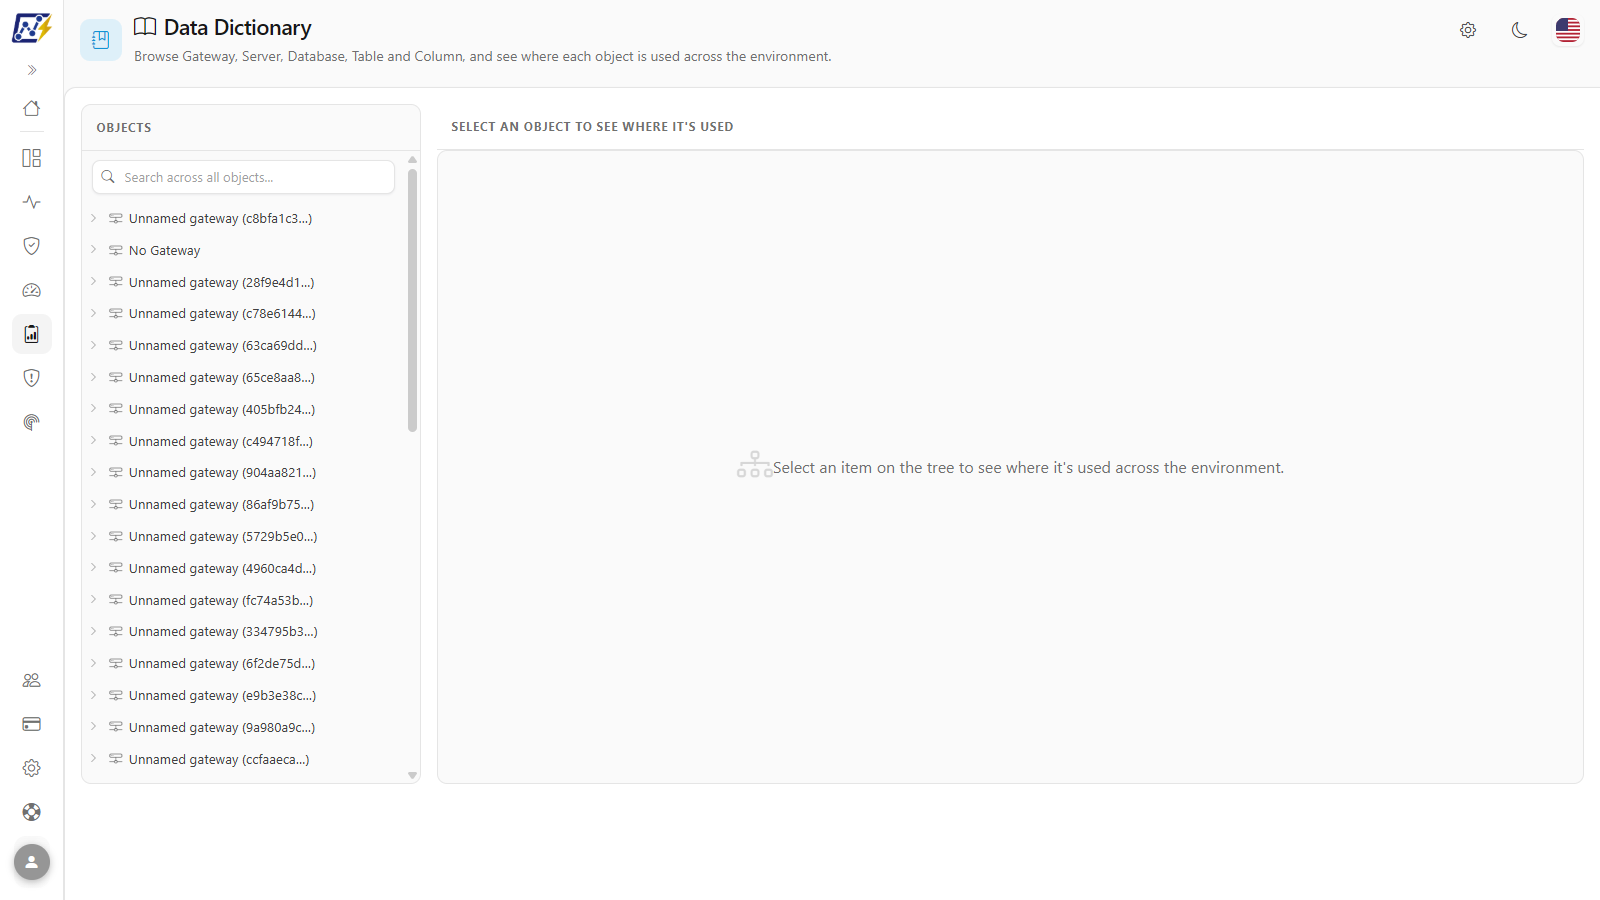
Object tree and "where used" diagram
## What it is for
* **Maintenance window.** Before restarting a server, patching a database, or replacing a gateway machine, list all the models and reports that will stop refreshing.
* **Schema change.** See who reads a specific table or column before renaming or removing it.
* **Source consolidation.** Identify databases that feed many models (candidates for a shared enterprise model) and databases used by a single model.
* **Risk concentration on gateways.** See how many models depend on each gateway.
* **Changes to Fabric tables.** Before changing a table in a Lakehouse or Warehouse, see which notebooks, pipelines, Copy Jobs, and dataflows read or write to it, in the **Lakehouse and Warehouse (Fabric)** branch.
## Features
### Object tree
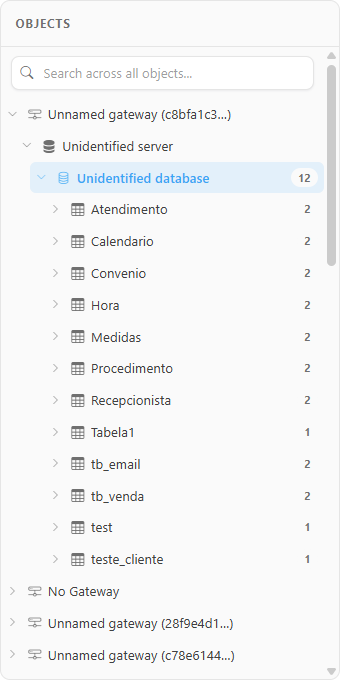
**What it is:** the **Objects** panel, on the left, with the physical hierarchy **Gateway › Server › Database › Table › Column** of all sources used by the semantic models.
**What it is for:** browsing the environment starting from the infrastructure: for example, opening a gateway and seeing which servers and databases go through it.
Gateway › Server › Database › Table › Column tree
**How to use:**
1. When the screen opens, the **Objects** panel loads the gateways (and the **No Gateway** node).
2. Click the arrow or the name of a node to expand it. The tables of a database and the columns of a table are loaded when you expand the node (a loading indicator appears).
3. Click the node again to collapse it.
| Level | What it shows |
| ------------ | ----------------------------------------------------------------------------------------------------------------------------- |
| **Gateway** | Each registered gateway. Sources accessed without a gateway (cloud services, Fabric items) are under the **No Gateway** node. |
| **Server** | Servers/instances under the gateway |
| **Database** | Databases of each server, with the number of tables |
| **Table** | Tables of the database, with the number of semantic models that use them |
| **Column** | Columns of the table, with the data type |
**How it works:**
* Clicking a node also **selects** it: the right panel starts showing where that object is used, even if you are only expanding the tree.
* When the server or the database cannot be identified, the nodes appear as *Unidentified server* or *Unidentified database*.
* At the bottom of the tree, *"N table(s) couldn't be placed in the tree..."* may appear: tables whose source could not be determined: the Power Query expression could not be parsed **and** the model has no identifiable connection.
### Search across all objects
**What it is:** the *Search across all objects...* field, at the top of the **Objects** panel, which searches **all** levels of the tree, including tables and columns not yet expanded.
**What it is for:** finding a table or column without knowing which gateway, server, or database it is in.
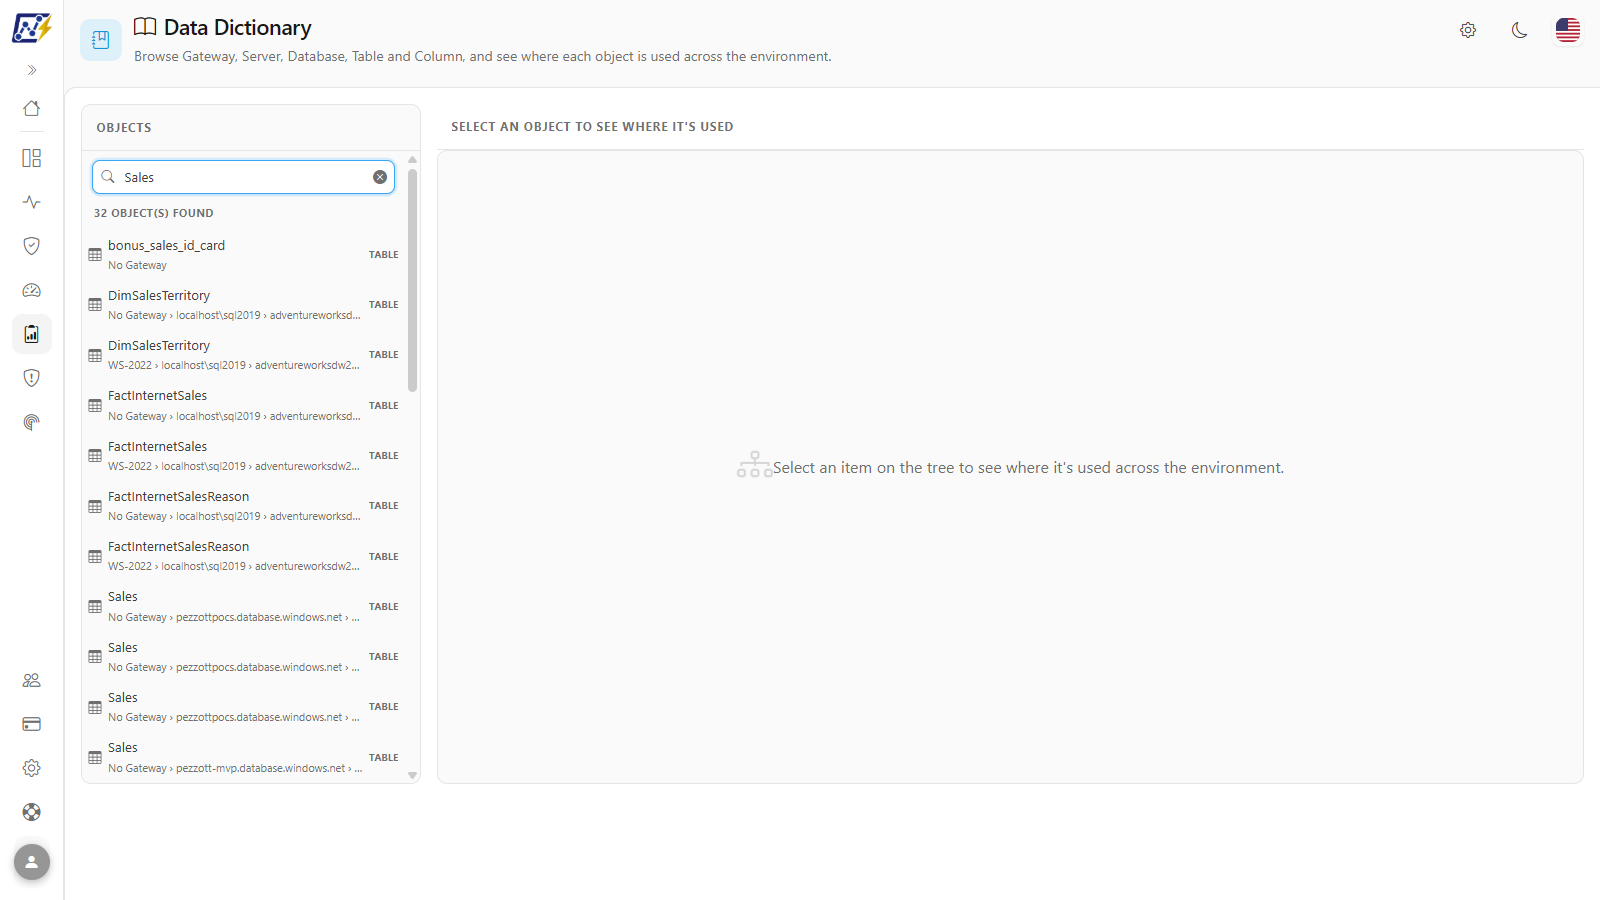
Search across all levels, with the path of each result
**How to use:**
1. Type at least 2 characters of the name of the gateway, server, database, table, or column. With fewer than 2 characters, the notice *Type at least 2 characters to search* appears.
2. The tree is replaced by the list *N object(s) found*. Each result shows the name, the full path (gateway › server › database › table), and the level.
3. Click the desired result; the right panel shows where the object is used.
4. Click the field's **X** (**Clear**) to return to the full tree.
**How it works:** structural results (gateway, server, database, table) appear before columns. The path distinguishes objects with the same name. With no results, *No object found* appears. The search covers the tree of gateways, servers, databases, tables, and columns of the semantic models; the **Lakehouse and Warehouse (Fabric)** branch is not part of it and stays hidden while you search.
### "Where used" diagram
**What it is:** the right panel, which shows the flow from the selected object to its consumers: **Gateway → Server → Database → Table → Column → Models using it → Reports accessing it**.
**What it is for:** listing all models and reports affected by server maintenance, a database patch, a gateway replacement, or a schema change.
Object tree and "where used" diagram
**How to use:**
1. Select a node in the tree or a search result. While nothing is selected, the panel displays *Select an item on the tree to see where it's used across the environment.*
2. Read the **Models using it (N)** groups (each model with its workspace) and **Reports accessing it (N)**.
**How it works:** only the levels up to the node you clicked appear, when you click a database, for example, the diagram goes from the gateway to the database and jumps straight to the models that use it. If no model uses the object, *No semantic model uses this object.* appears.
### Zoom, fit, and fullscreen
**What it is:** the buttons in the diagram toolbar: **Zoom out**, **Zoom in**, **Fit to screen**, and **Fullscreen**.
**What it is for:** reading diagrams with many models and reports.
**How to use:**
1. Use **Zoom in** / **Zoom out** (or the mouse wheel over the diagram).
2. Click and drag the diagram area to move it.
3. **Fit to screen** recenters and frames the entire diagram.
4. **Fullscreen** expands the panel to fill the whole screen; **Exit fullscreen** returns to normal.
**How it works:** the toolbar only appears when some model uses the selected object.
### Export
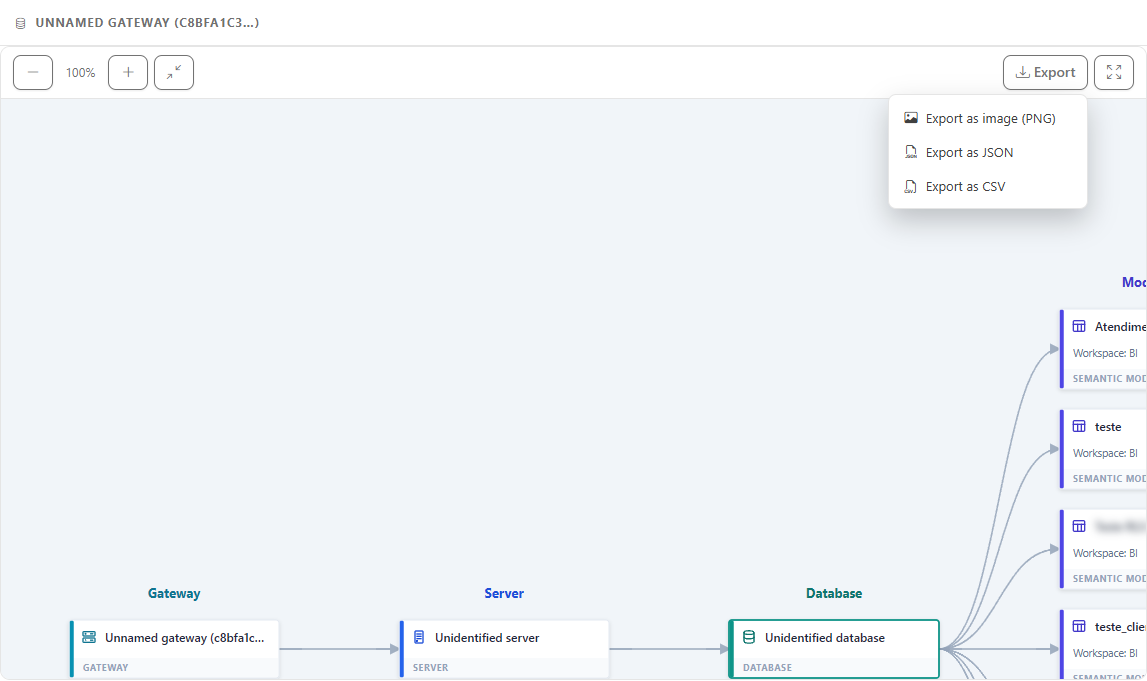
**What it is:** the **Export** button in the diagram toolbar, with **Export as image (PNG)**, **Export as JSON**, and **Export as CSV**.
**What it is for:** giving the infrastructure team or the report owners the impact list of a maintenance.
Usage diagram export options
**How to use:**
1. With an object selected, click **Export**.
2. Choose the format. The file (`dicionario-de-dados-...`) is downloaded by the browser.
| Export | Content |
| --------------------- | -------------------------------------------------------------------------------------------------------------------------------------------------------------------------------------------------------------------------------------------------------------------- |
| Export as image (PNG) | The diagram as an image |
| Export as JSON | Selected object, models, and reports in structured format |
| Export as CSV | One row per model/report pair, with the columns, in this order, *Workspace*, *Semantic Model*, *Model Remote ID*, *Report*, *Report Remote ID*, and *App ID*. Models with no report also generate a row. The file opens correctly in Excel with accented characters. |
### Lakehouse and Warehouse (Fabric) branch
**What it is:** an extra branch at the end of the **Objects** tree, called **Lakehouse and Warehouse (Fabric)**, which lists the Lakehouses and Warehouses whose tables are **read or written by Notebooks, Data Pipelines, Copy Jobs, and Dataflows**. The hierarchy is **Storage (Lakehouse or Warehouse) › Table › Column**. While the rest of the tree starts from semantic models, this branch starts from Fabric data engineering items.
**What it is for:** before renaming, emptying, or changing a table in a Lakehouse or Warehouse, knowing which items read it and which write to it.
**How to use:**
1. Scroll to the end of the **Objects** panel and click **Lakehouse and Warehouse (Fabric)**. The number next to the name indicates how many Lakehouses and Warehouses were found; the list is loaded the first time the branch is opened.
2. Click a Lakehouse or Warehouse to see its tables (the workspace appears below the name and the number next to it is the table count). Each table appears as *schema.table* and shows two counters: the eye icon indicates how many items read it (**Items that read**) and the pencil, how many write to it (**Items that write**).
3. Click a table to see the observed columns, with the same counts. The tree and the lists show 200 rows at a time; use **Show more** for the rest.
4. The right panel shows the usage of the selected node (storage, table, or column).
**How it works:**
* The right panel has two lists: **Read by (N)** and **Written by (N)**. Each row is an item (**Item**, **Item type**, and **Workspace**), with the **Confidence** (**Exact** or **Inferred**) and the **Evidence** (the kind of excerpt that originated the dependency and its location, as short text; the **dynamic** marker appears when the table name is built at run time).
* When you select a storage, the list also includes the **Table** column; when you select a column, it includes the **Column usage** column (**Select**, **Filter**, **Join**, **Write**, **Mapping**, or **All columns**).
* Each list shows 100 rows at a time (**Show more**). With no items, *No item reads this object.* or *No item writes to this object.* appears. If the list is limited by the server, the screen warns you.
* Only tables that the [Fabric item dependencies](/en/power-monitor/qualidade-de-dados/linhagem-de-dados.md#how-dependencies-are-collected) collector found in notebooks, pipelines, Copy Jobs, and dataflows enter the branch. With none, the branch shows *No Lakehouse or Warehouse with tables read or written by Notebooks, Pipelines, Copy Jobs, or Dataflows.*
* The branch respects the workspace scope: you only see Lakehouses, Warehouses, and items from the workspaces you can view.
* **Export as CSV**, in the right panel, downloads one row per item that reads or writes the selected object, with the columns *Storage*, *Schema*, *Table*, *Column*, *Item*, *Item type*, *Workspace*, *Operation* (**Read** or **Write**), *Confidence*, *Evidence*, *Evidence location*, *Dynamic*, and *Column usage*. The file carries no code or server addresses.
To see the complete diagram of an item (everything a notebook reads and writes, for example), open the item in [Data Lineage](/en/power-monitor/qualidade-de-dados/linhagem-de-dados.md#fabric-item-dependencies).
## Rules and behavior
* **It is not a new scan.** The tree is built from the connections and the Power Query code of the models already collected by the scans. Recent changes appear after the next collection cycle.
* **Per-table placement.** Each table of a model is placed under the server/database it actually reads from, identified in the table's own Power Query code (connectors such as SQL Server, PostgreSQL, MySQL, Db2, Redshift, and Analysis Services). That is why a model with several sources appears correctly under each of them.
* **When Power Query is not conclusive** (tables with more than one source, dynamically built queries, connectors without an explicit database), Power Monitor uses the model's registered connections and places the table under **all** the connections it can identify. Only a table from a model with no identifiable connection goes to the "couldn't be placed" notice.
* **Table gateway.** The gateway is identified by the server + database combination. If no registered gateway records that source, the table appears under **No Gateway**.
* **Objects with the same name are distinct.** The same server name under two gateways, or the same table in two databases, are different nodes.
* **Workspace scope.** You see only the models and reports of the workspaces you can view.
* **Fabric branch.** The **Lakehouse and Warehouse (Fabric)** branch does not come from the model scans: it comes from the [Notebook, pipeline and dataflow dependencies](/en/power-monitor/qualidade-de-dados/linhagem-de-dados.md#how-dependencies-are-collected) collector, which reads the item definitions once a day. The analysis is static and best effort, and tables built at run time appear marked as **dynamic**.
## Step by step: common scenarios
### How to assess the impact of server maintenance
{% stepper %}
{% step %}
### Find the server
Search for the server name or expand the corresponding gateway (or **No Gateway**).
{% endstep %}
{% step %}
### Click the server
The diagram shows all semantic models that read from this server and the reports of each one.
{% endstep %}
{% step %}
### Export the list
Use **Export › Export as CSV** to get the model × report list with the workspaces and share it with the owners.
{% endstep %}
{% endstepper %}
### How to check who uses a column before changing it
1. Search for the column name (or expand **Gateway › Server › Database › Table** down to it).
2. Check the full path in the result, to be sure it is the column of the right table and database.
3. Click the column and review the **Models using it** and **Reports accessing it** groups. To open the full lineage of one of the models, use [Data Lineage](/en/power-monitor/qualidade-de-dados/linhagem-de-dados.md).
### How to find out who reads or writes a Lakehouse table
{% stepper %}
{% step %}
### Open the Fabric branch
At the end of the **Objects** panel, click **Lakehouse and Warehouse (Fabric)** and expand the Lakehouse or Warehouse you want.
{% endstep %}
{% step %}
### Select the table
Click the table. The eye and pencil counters show, at a glance, how many items read and how many write.
{% endstep %}
{% step %}
### Read the lists
In the right panel, check **Read by** and **Written by**. Prefer the rows with **Exact** confidence; the **Inferred** ones were deduced (for example, by name).
{% endstep %}
{% step %}
### Export the list
Click **Export as CSV** to attach the result to your change request.
{% endstep %}
{% endstepper %}
## Frequently asked questions
"N table(s) couldn't be placed in the tree" appears. Is something wrong?
Not necessarily. These are tables whose source could not be determined: the Power Query code could not be parsed (for example, queries built with variables) **and** the model has no identifiable connection. The other tables of the same model remain placed normally.
My Lakehouse appears under "No Gateway". Is that correct?
Yes. Cloud sources and Fabric items accessed directly, without a data gateway, are grouped under **No Gateway**.
The search does not find a column that I know exists.
Confirm that the model containing the column is in a workspace you can view and that it has already been scanned. Columns of tables that could not be placed in the tree do not appear in the search.
The "Lakehouse and Warehouse (Fabric)" branch is empty or does not show my Lakehouse.
This branch only lists Lakehouses and Warehouses with tables read or written by Notebooks, Data Pipelines, Copy Jobs, or Dataflows that the dependency collector has already analyzed. Check that the **Notebook, pipeline and dataflow dependencies** scan is on in *Settings › Monitoring*, that the Service Principal has write permission on the workspaces of those items, and that a run has already happened (it runs once a day). See [How dependencies are collected](/en/power-monitor/qualidade-de-dados/linhagem-de-dados.md#how-dependencies-are-collected).
The search across all objects does not find tables from the Fabric branch.
Correct: the search covers the tree of gateways, servers, databases, tables, and columns of the semantic models, and the **Lakehouse and Warehouse (Fabric)** branch is hidden while you search. Clear the search and browse the branch, or look for the table in [Data Lineage](/en/power-monitor/qualidade-de-dados/linhagem-de-dados.md), where it appears as a **Fabric table**.
## Related pages
* [Data Lineage](/en/power-monitor/qualidade-de-dados/linhagem-de-dados.md): the full lineage of a specific model
* [Settings › Monitoring](/en/power-monitor/configuracoes/monitoramento.md#scans-and-collections): the **Notebook, pipeline and dataflow dependencies** scan
* [Governance › Infrastructure › Gateways](/en/power-monitor/governanca/infraestrutura/gateways.md) and [Connections](/en/power-monitor/governanca/infraestrutura/conexoes.md)
* [Model Cleanup](/en/power-monitor/performance/limpeza-de-modelo.md)
---
# Agent Instructions
This documentation is published with GitBook. GitBook is the documentation platform designed so that both humans and AI agents can read, navigate, and reason over technical content effectively. Learn more at gitbook.com.
## Querying This Documentation
If you need additional information that is not directly available in this page, you can query the documentation by asking a question.
Perform an HTTP GET request on the following URL with the `ask` and `goal` query parameters:
```
GET https://docs.powermonitor.com.br/en/power-monitor/qualidade-de-dados/dicionario-de-dados.md?ask=&goal=
```
`ask` is the immediate question: it should be specific, self-contained, and written in natural language.
`goal` is what the user is ultimately trying to achieve, the reason they need the answer. Sharing it helps GitBook give you a better, more relevant answer. A goal is most helpful when it describes the outcome the user wants rather than restating the question. For example, with `ask=how do I create an API token`, a goal like `automate deployments from our CI pipeline` lets GitBook tailor the answer to that use case.
The response will contain a direct answer to the question and relevant excerpts and sources from the documentation.
Use this mechanism when the answer is not explicitly present in the current page, you need clarification or additional context, or you want to retrieve related documentation sections.