> For the complete documentation index, see [llms.txt](https://docs.powermonitor.com.br/llms.txt). Markdown versions of documentation pages are available by appending `.md` to page URLs; this page is available as [Markdown](https://docs.powermonitor.com.br/en/power-monitor/qualidade-de-dados/exposicao-de-dados.md).

# Data Exposure

Find credentials written in semantic model code (tokens, passwords, keys, SAS) and, optionally, broader data leak risks, with snippets always masked.

**Data Exposure** scans the code of all semantic models in the tenant (the Power Query (M) queries of each table, the model's shared expressions and, when necessary, the full model definition) looking for **credentials written directly in the code** (*hard-coded*): authorization tokens, passwords in connection strings, API keys, SAS tokens, credentials embedded in URLs, and private keys. Optionally, it also points out **broader risks**, such as sending data to external endpoints, FTP destinations, local paths, and dynamically built connections.

**How to access:** *Data Quality › Data Exposure*. Available to all profiles (read-only).

<figure><picture><source srcset="/files/bIqH0hzvPXvB2x4nDgIh" media="(prefers-color-scheme: dark)"><img src="https://3938213054-files.gitbook.io/~/files/v0/b/gitbook-x-prod.appspot.com/o/spaces%2FH2bFRBmIfyK3kwVKbldl%2Fuploads%2Fgit-blob-32f26e5a658067ec3d5e78a7b318640def53a0cb%2Fpm-qualidade-exposicao-resumo-en.png?alt=media" alt="Data Exposure screen with the masking notice, the summary of affected models, and the findings per model"></picture><figcaption><p>Summary and findings per model, with masked snippets</p></figcaption></figure>

## What it is for

* **Security audit**: ensure that no published model carries a password, token, or key in clear text: anyone with edit permission on the model (or who downloads the file) could read them.
* **Compliance (LGPD, ISO 27001, SOC 2)**: provide evidence of periodic checks for secrets in code.
* **Leak prevention**: enable the broad risks to discover models that send data out (HTTP requests with a body, FTP) or that read from local paths and network shares.

## Features

### Filter risk types

**What it is:** the **Filter risk types** button, at the top of the screen, with the counter *N of 14 types* and a menu with two groups: **Hard-coded credentials** (selected by default) and **Broad risks (opt-in)** (not selected by default).

**What it is for:** choosing what the scan should point out: only secrets in code (default) or also leak risks, such as sending data out, FTP, and local paths.

<figure><picture><source srcset="/files/2ELW3orHgDLfYeh8vxqy" media="(prefers-color-scheme: dark)"><img src="https://3938213054-files.gitbook.io/~/files/v0/b/gitbook-x-prod.appspot.com/o/spaces%2FH2bFRBmIfyK3kwVKbldl%2Fuploads%2Fgit-blob-998ffdc390ff46b08bc759c9df2fd81ce59ce233%2Fpm-qualidade-exposicao-filtro-en.png?alt=media" alt="Filter risk types menu open with the credentials and broad risks groups"></picture><figcaption><p>Risk type filter with the two groups</p></figcaption></figure>

**How to use:**

1. Click **Filter risk types**.
2. Select or clear the checkboxes of the desired types. The summary and the list of models update immediately, without reloading the page.
3. Use the menu buttons: **Select all** (all 14 types), **Clear selection** (clears everything, so you can select only what you want), and **Reset to default (credentials only)**.

**How it works:** severity is indicated by the color of the type badge: **red** (high), **amber** (medium), **gray** (low), and **blue** (informational). The selection applies only while you are on the screen: when you leave and come back, the filter returns to the default (credentials only).

**Hard-coded credentials** (selected by default):

| Type                    | What is detected                                                                   | Severity |
| ----------------------- | ---------------------------------------------------------------------------------- | -------- |
| **Authorization token** | `Authorization` header with a Bearer/Basic token written in the code               | High     |
| **Connection password** | Password written in a connection string or in a connector parameter                | High     |
| **Private key**         | Private key block (PEM) in the code                                                | High     |
| **API key / token**     | API key, account key, access token, or *client secret* with a literal value        | Medium   |
| **SAS token**           | Azure Storage shared access signature (`sig=`, `SharedAccessSignature`)            | Medium   |
| **Credential in URL**   | User name and password embedded in the address (`protocol://user:password@server`) | Medium   |

**Broad risks (opt-in)** (not selected by default):

| Type                                        | What is detected                                                            | Severity      |
| ------------------------------------------- | --------------------------------------------------------------------------- | ------------- |
| **Data exfiltration**                       | Model data serialized and sent to a network destination                     | High          |
| **HTTP request body upload**                | `Web.Contents` call with a request body: data sent to an endpoint           | High          |
| **FTP/SFTP destination**                    | Transfer to an FTP/SFTP/FTPS server                                         | High          |
| **Local file**                              | Fixed local path (for example, `C:\...`)                                    | Medium        |
| **Network share**                           | Fixed UNC network path (`\\server\folder`)                                  | Medium        |
| **Dynamic connection (hidden destination)** | Connector whose address is built dynamically, hiding the actual destination | Medium        |
| **Native query (review dynamic SQL)**       | Use of `Value.NativeQuery`: review whether the SQL is built dynamically     | Low           |
| **External storage (SharePoint/OneDrive)**  | Access to SharePoint/OneDrive: informational, not a leak by itself          | Informational |

### Masking notice and summary

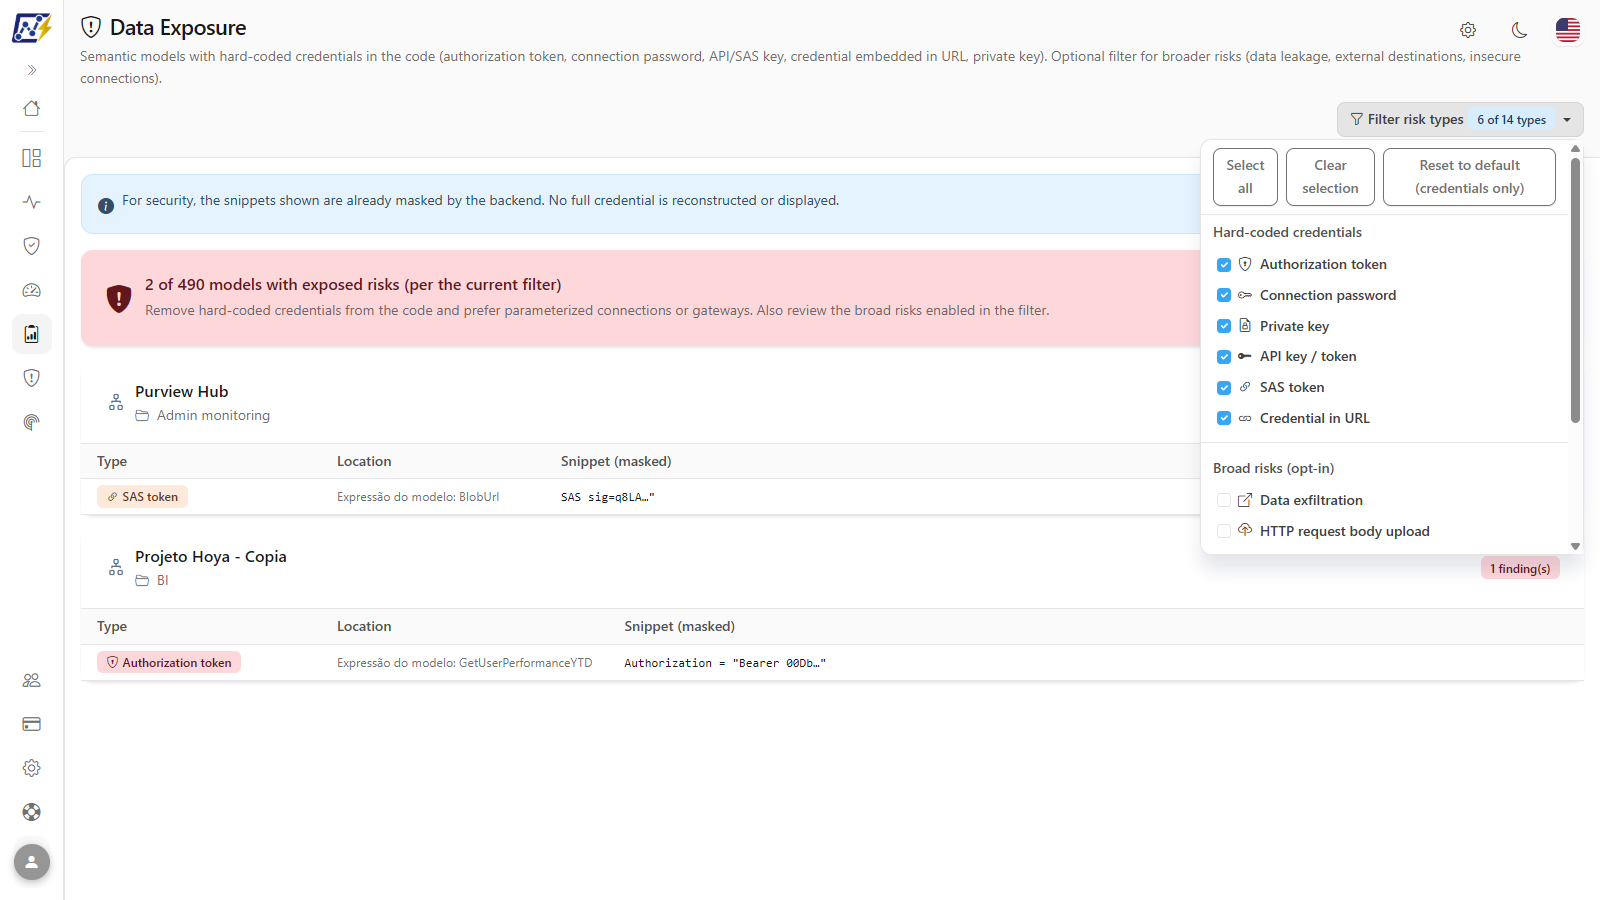
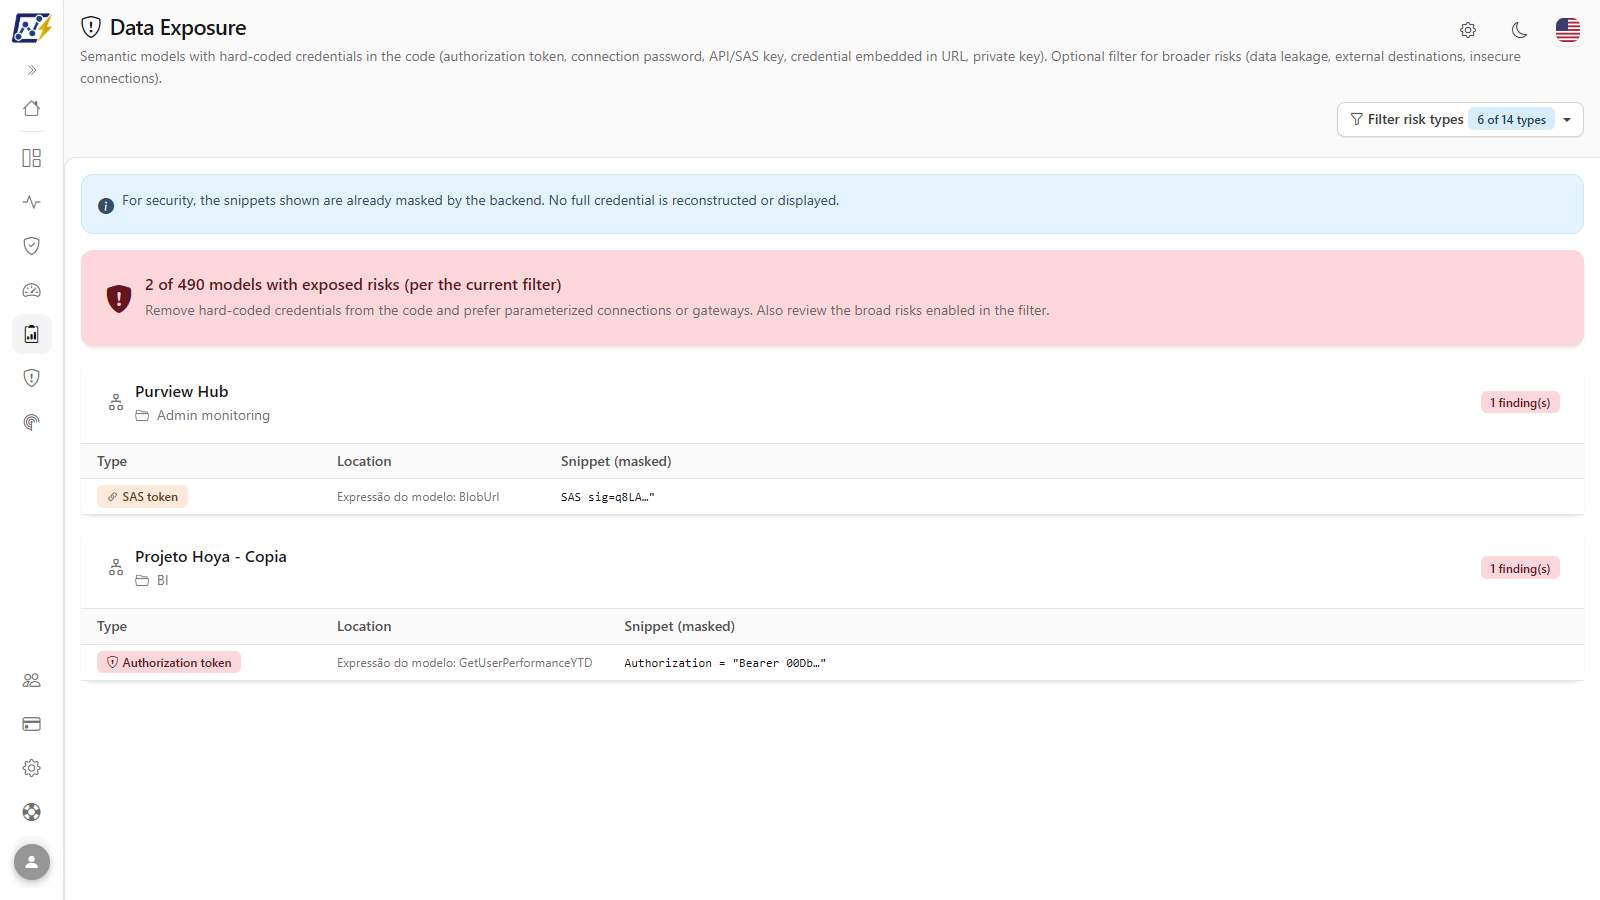
**What it is:** the blue strip *"For security, the snippets shown are already masked by the backend. No full credential is reconstructed or displayed."* and, below it, the summary card: red when there are findings and green when there are none.

**What it is for:** knowing immediately how many models have an exposed risk, according to the current filter.

<figure><picture><source srcset="/files/bIqH0hzvPXvB2x4nDgIh" media="(prefers-color-scheme: dark)"><img src="https://3938213054-files.gitbook.io/~/files/v0/b/gitbook-x-prod.appspot.com/o/spaces%2FH2bFRBmIfyK3kwVKbldl%2Fuploads%2Fgit-blob-32f26e5a658067ec3d5e78a7b318640def53a0cb%2Fpm-qualidade-exposicao-resumo-en.png?alt=media" alt="Masking notice and summary card with the number of models with exposed risks"></picture><figcaption><p>Masking notice and summary</p></figcaption></figure>

**How it works:**

* With findings: **"X of Y models with exposed risks (per the current filter)"**, with guidance to remove the credentials from the code and prefer parameterized connections or gateways. *Y* is the total number of scanned models and does not change with the filter.
* With no findings: *"No scanned model exposes a risk per the current filter."*
* While calculating, *Loading report...* appears. If the query fails, *Could not load the credential leak report.* appears with the **Try again** button.

### Findings per model

**What it is:** a block for each affected model, with the **name**, the **workspace**, and the total of *finding(s)*, followed by the findings table.

**What it is for:** knowing exactly where each problem is in order to fix it.

<figure><picture><source srcset="/files/dt8KryInYzkIowYFa83f" media="(prefers-color-scheme: dark)"><img src="https://3938213054-files.gitbook.io/~/files/v0/b/gitbook-x-prod.appspot.com/o/spaces%2FH2bFRBmIfyK3kwVKbldl%2Fuploads%2Fgit-blob-47a6238c5d9fb93144bb48b5000769a7cea39392%2Fpm-qualidade-exposicao-ocorrencias-en.png?alt=media" alt="A model&#x27;s block with the Type, Location, and masked Snippet columns"></picture><figcaption><p>Findings of a model, with the masked snippet</p></figcaption></figure>

| Column               | Content                                                                                                                                                     |
| -------------------- | ----------------------------------------------------------------------------------------------------------------------------------------------------------- |
| **Type**             | Risk type, with a color by severity                                                                                                                         |
| **Location**         | Where the problem is: *Table: {name}*, *Model expression: {name}* or, when it cannot be attributed to a table or expression, the model's general definition |
| **Snippet (masked)** | Code snippet with the secret reduced to its first characters                                                                                                |

**How to use:** scroll the screen to see the blocks; use the **Location** column to find out which table or expression of the model the code is in, and follow [How to handle an exposed credential](#how-to-handle-an-exposed-credential).

### Broad risks in the analysis

**What it is:** including the types of the **Broad risks (opt-in)** group in the filter.

**What it is for:** discovering models that send data out (HTTP requests with a body, FTP), that read from local paths and network shares, or that build connections dynamically.

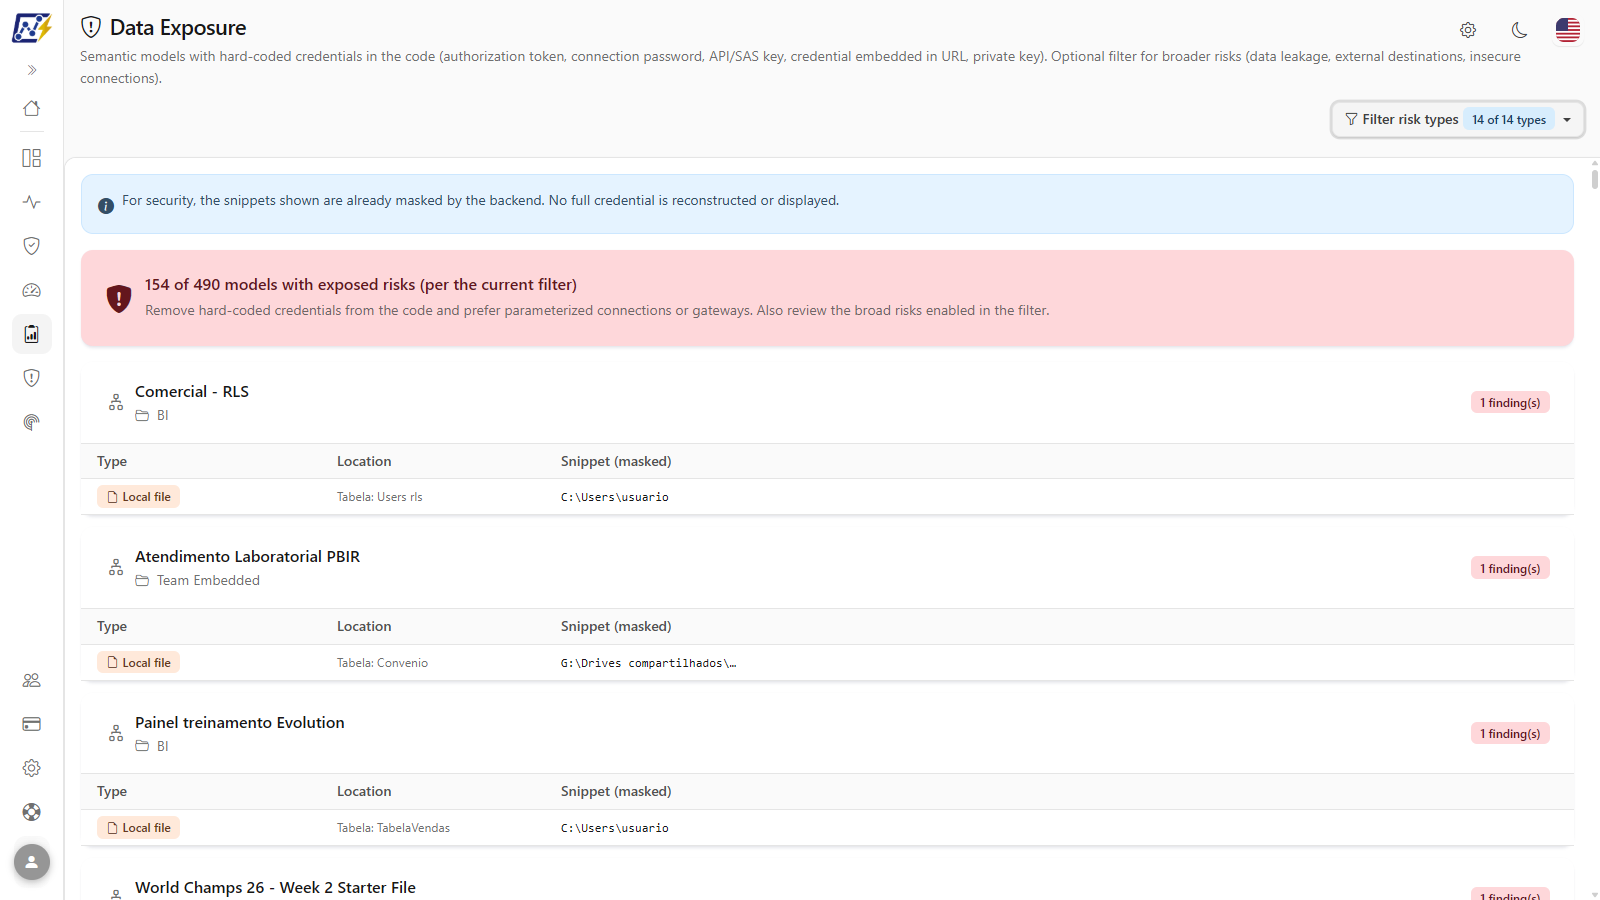
<figure><picture><source srcset="/files/cA17c2ictd8TbFTM9nBw" media="(prefers-color-scheme: dark)"><img src="https://3938213054-files.gitbook.io/~/files/v0/b/gitbook-x-prod.appspot.com/o/spaces%2FH2bFRBmIfyK3kwVKbldl%2Fuploads%2Fgit-blob-c7cf2f91604cfd1e422410e46f2f3cf6d6cc4ae7%2Fpm-qualidade-exposicao-riscos-amplos-en.png?alt=media" alt="Result with all 14 risk types selected"></picture><figcaption><p>Result with broad risks included</p></figcaption></figure>

**How to use:**

1. Click **Filter risk types**.
2. In the **Broad risks (opt-in)** group, select the desired types (for example, **Data exfiltration**, **HTTP request body upload**, and **FTP/SFTP destination**), or click **Select all**.
3. Check the updated summary and blocks. To go back, click **Reset to default (credentials only)**.

**How it works:** broad risks are searched for only in the Power Query code (table queries and model expressions), not in the general definition, to avoid false positives.

### Microsoft standard artifacts

**What it is:** the notice *N Microsoft standard artifacts ignored*, at the top of the screen. It appears whenever the analysis left out artifacts that Microsoft itself creates in the tenant: the Fabric Capacity Metrics app, the automatically generated usage metrics models, the Admin monitoring workspace and similar items. The information icon next to it explains the rule. The notice only appears when at least one artifact was ignored (singular: *1 Microsoft standard artifact ignored*).

**What it is for:** keeping items that are not part of your business from distorting totals and risk lists. The same notice appears on other analysis screens, such as the [Environment Inventory](/en/power-monitor/qualidade-de-dados/inventario-do-ambiente.md) and the [Efficiency Dashboard](/en/power-monitor/dashboards/dashboard-de-eficiencia.md).

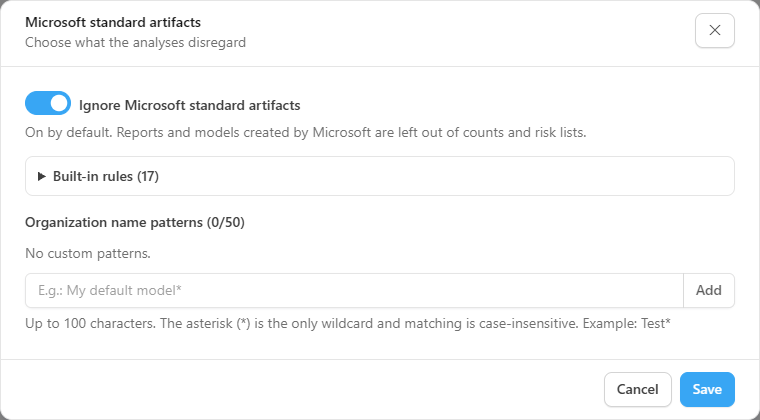
**Who can configure it:** only Administrators see the **Configure** button, which opens the **Microsoft standard artifacts** window.

<figure><picture><source srcset="/files/zXYauetDPo5qF20vw47W" media="(prefers-color-scheme: dark)"><img src="https://3938213054-files.gitbook.io/~/files/v0/b/gitbook-x-prod.appspot.com/o/spaces%2FH2bFRBmIfyK3kwVKbldl%2Fuploads%2Fgit-blob-b63de784d7cafbed3fb7e0f5ce8f4d85e35994c7%2Fpm-qualidade-artefatos-microsoft-modal-en.png?alt=media" alt="Microsoft standard artifacts window with the Ignore Microsoft standard artifacts switch, the built-in rules and the organization name patterns"></picture><figcaption><p>Microsoft standard artifacts configuration window</p></figcaption></figure>

| Window item                             | What it does                                                                                                                                                                                                                                                                                                                                                                                                                                 |
| --------------------------------------- | -------------------------------------------------------------------------------------------------------------------------------------------------------------------------------------------------------------------------------------------------------------------------------------------------------------------------------------------------------------------------------------------------------------------------------------------- |
| **Ignore Microsoft standard artifacts** | Switch that turns the rule on or off for the whole organization. It is **on by default**. With it off, Microsoft reports and models return to the counts and risk lists and are analyzed as if they belonged to your business (the window shows a warning).                                                                                                                                                                                  |
| **Built-in rules**                      | Read-only. Split into **Structural rules** (administration and personal workspaces; usage metrics models generated by Microsoft; reports linked to those models; the workspace and model configured as the organization Capacity Metrics source) and well-known **Name patterns** (for example, *Capacity Metrics*, *Usage Metrics Report*, *Admin monitoring*, *Feature Usage and Adoption*, *Purview Hub* and the dataflow staging items). |
| **Organization name patterns**          | Your own patterns, up to **50**, each with at most **100 characters**. The asterisk (`*`) is the only wildcard and matching is case-insensitive. Example: `Test*`. Type the pattern, click **Add** and, to undo, remove the pattern with the remove button next to it.                                                                                                                                                                       |

**How it works:**

* Structural rules come first (workspace type, model content type and the Capacity Metrics source, which is recognized by identifier and never by name); names are a complement. Unknown information never excludes an artifact.
* The built-in name patterns include *Capacity Metrics* as part of a name: a model of yours called, for example, "Capacity Metrics Review" is also ignored. If that gets in the way, turn the rule off.
* When you save, the screen reloads and the numbers reflect the new configuration.

## Rules and behavior

* **The secret is never displayed or stored.** Masking happens on the server; the screen receives only the first characters of the value. Local paths are also shortened so as not to reveal user names.
* **References are not flagged.** A Power Query parameter (for example, `Password = MyParameter`) is not considered a hard-coded credential; only literal values in quotes and Bearer/Basic tokens written in the code are.
* **No duplicates.** The same credential found in a table's query and in the model's general definition is counted only once, attributed to the table.
* **Broad risks only in Power Query code.** They are searched for in the table queries and in the model expressions, not in the general definition, to avoid false positives.
* **Coverage.** **Semantic models** are analyzed. Notebooks and other Fabric items are not covered yet.
* **Refresh.** The report is calculated every time you open the screen, on the code collected in the last scan of the models.
* **Workspace scope.** Only models of the workspaces you can view.
* **Deleted models.** A model that has already been deleted in Fabric is not listed: there is nowhere left to remove the credential.
* **Microsoft standard artifacts.** They are left out of the analysis by default; see [Microsoft standard artifacts](#microsoft-standard-artifacts).

{% hint style="warning" %}
Even when masked, the content of this screen is sensitive security information. Treat the fix as a priority: remove the credential from the code, **change (rotate) the exposed password or token** (it may already have been copied) and start using credentials stored in the connection, in the gateway, or in a secrets vault. When sharing screenshots or exports of this screen, take the same care you would with customer data.
{% endhint %}

## Step by step: common scenarios

### How to check whether there are exposed credentials

1. Go to *Data Quality › Data Exposure*. The report is calculated when the screen opens (*Loading report...* appears), already with the default filter: only the 6 **Hard-coded credentials** types.
2. Read the summary: **X of Y models with exposed risks (per the current filter)** or, if nothing was found, *No exposed risks found*.
3. Scroll the screen to see the block of each affected model, with the workspace, the number of findings, and the **Type**, **Location**, and **Snippet (masked)** table.

If *Could not load the credential leak report.* appears, click **Try again**.

### How to investigate a specific risk type

1. Open **Filter risk types** and click **Clear selection**.
2. Select only the type you want to investigate (for example, **Dynamic connection (hidden destination)**).
3. The list starts showing only the models with that type of finding; use the **Location** column to find out which table or expression of the model the code is in.

### How to handle an exposed credential

{% stepper %}
{% step %}

### Identify the location

Note the model, the workspace, and the **Location** (table or expression).
{% endstep %}

{% step %}

### Rotate the credential

Ask the owner of the source system to change the exposed password, token, or key.
{% endstep %}

{% step %}

### Fix the model

In Power BI Desktop or in the model editor, remove the value from the Power Query code and configure the credential in the connection/gateway (or use a parameter). Publish the model.
{% endstep %}

{% step %}

### Confirm

After the model's next scan, open the screen again and confirm that the finding has disappeared.
{% endstep %}
{% endstepper %}

## Frequently asked questions

<details>

<summary>I fixed the model, but the finding still appears.</summary>

The analysis uses the code collected in the model's last scan. Wait for the next collection cycle (or ask an administrator to run it in [Mapping](/en/power-monitor/mapeamento.md)) and open the screen again.

</details>

<details>

<summary>Is "External storage (SharePoint/OneDrive)" a problem?</summary>

Not necessarily. SharePoint and OneDrive are legitimate corporate destinations; the item is **informational**, useful for mapping which models depend on files in these locations.

</details>

<details>

<summary>Why doesn't the total number of models ("of Y") change when I change the filter?</summary>

*Y* is the number of scanned models. The filter only changes which risk types are considered when counting the affected models (*X*).

</details>

## Related pages

* [Environment Inventory](/en/power-monitor/qualidade-de-dados/inventario-do-ambiente.md): cross-reference the affected models with RLS and sensitivity labels
* [Permissions Audit](/en/power-monitor/auditoria/auditoria-de-permissoes.md): who has access to the affected models
* [Governance › Infrastructure › Connections](/en/power-monitor/governanca/infraestrutura/conexoes.md)


---

# Agent Instructions
This documentation is published with GitBook. GitBook is the documentation platform designed so that both humans and AI agents can read, navigate, and reason over technical content effectively. Learn more at gitbook.com.

## Querying This Documentation
If you need additional information that is not directly available in this page, you can query the documentation by asking a question.

Perform an HTTP GET request on the following URL with the `ask` and `goal` query parameters:

```
GET https://docs.powermonitor.com.br/en/power-monitor/qualidade-de-dados/exposicao-de-dados.md?ask=<question>&goal=<user_goal>
```

`ask` is the immediate question: it should be specific, self-contained, and written in natural language.
`goal` is what the user is ultimately trying to achieve, the reason they need the answer. Sharing it helps GitBook give you a better, more relevant answer. A goal is most helpful when it describes the outcome the user wants rather than restating the question. For example, with `ask=how do I create an API token`, a goal like `automate deployments from our CI pipeline` lets GitBook tailor the answer to that use case.

The response will contain a direct answer to the question and relevant excerpts and sources from the documentation.

Use this mechanism when the answer is not explicitly present in the current page, you need clarification or additional context, or you want to retrieve related documentation sections.