> For the complete documentation index, see [llms.txt](https://docs.powermonitor.com.br/llms.txt). Markdown versions of documentation pages are available by appending `.md` to page URLs; this page is available as [Markdown](https://docs.powermonitor.com.br/en/power-monitor/qualidade-de-dados/inventario-do-ambiente.md).
# Environment Inventory
One row per semantic model in the tenant with structure, RLS, sensitivity label, refreshes, usage, efficiency, and the AI and best practices scores.
The **Environment Inventory** consolidates, in a single table, the health and governance of **all semantic models** in the tenant: structure size, relationships, documentation, security (RLS and sensitivity label), linked reports and apps, refreshes, usage over the last 30 days, efficiency classification, and the AI and best practices scores. It is the starting point for finding, among hundreds of models, the ones that deserve attention.
**How to access:** *Data Quality › Environment Inventory*. Available to all profiles (read-only).
{% hint style="info" %}
For an overall diagnosis of the environment's problems, with a score and findings by severity, see the [Environment X-Ray](/en/power-monitor/qualidade-de-dados/raio-x-do-ambiente.md) (Administrators only).
{% endhint %}
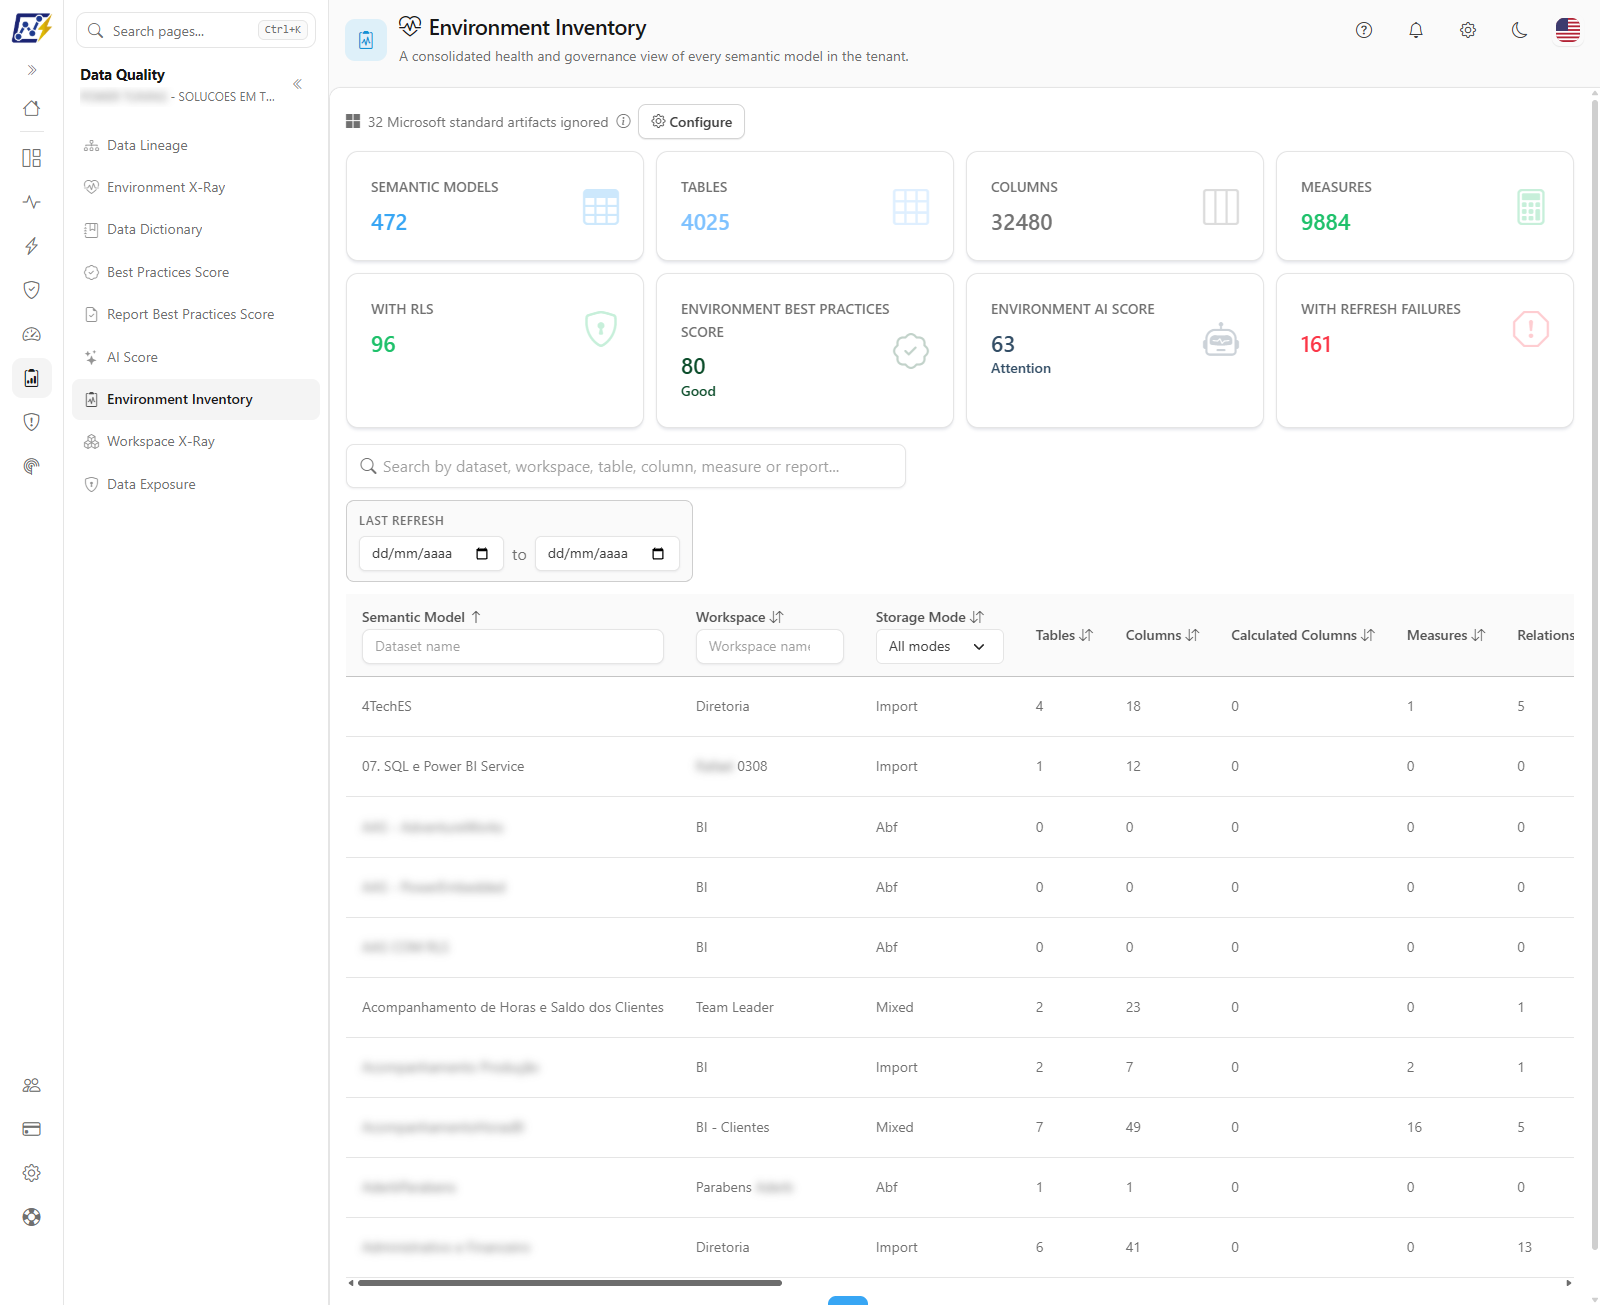
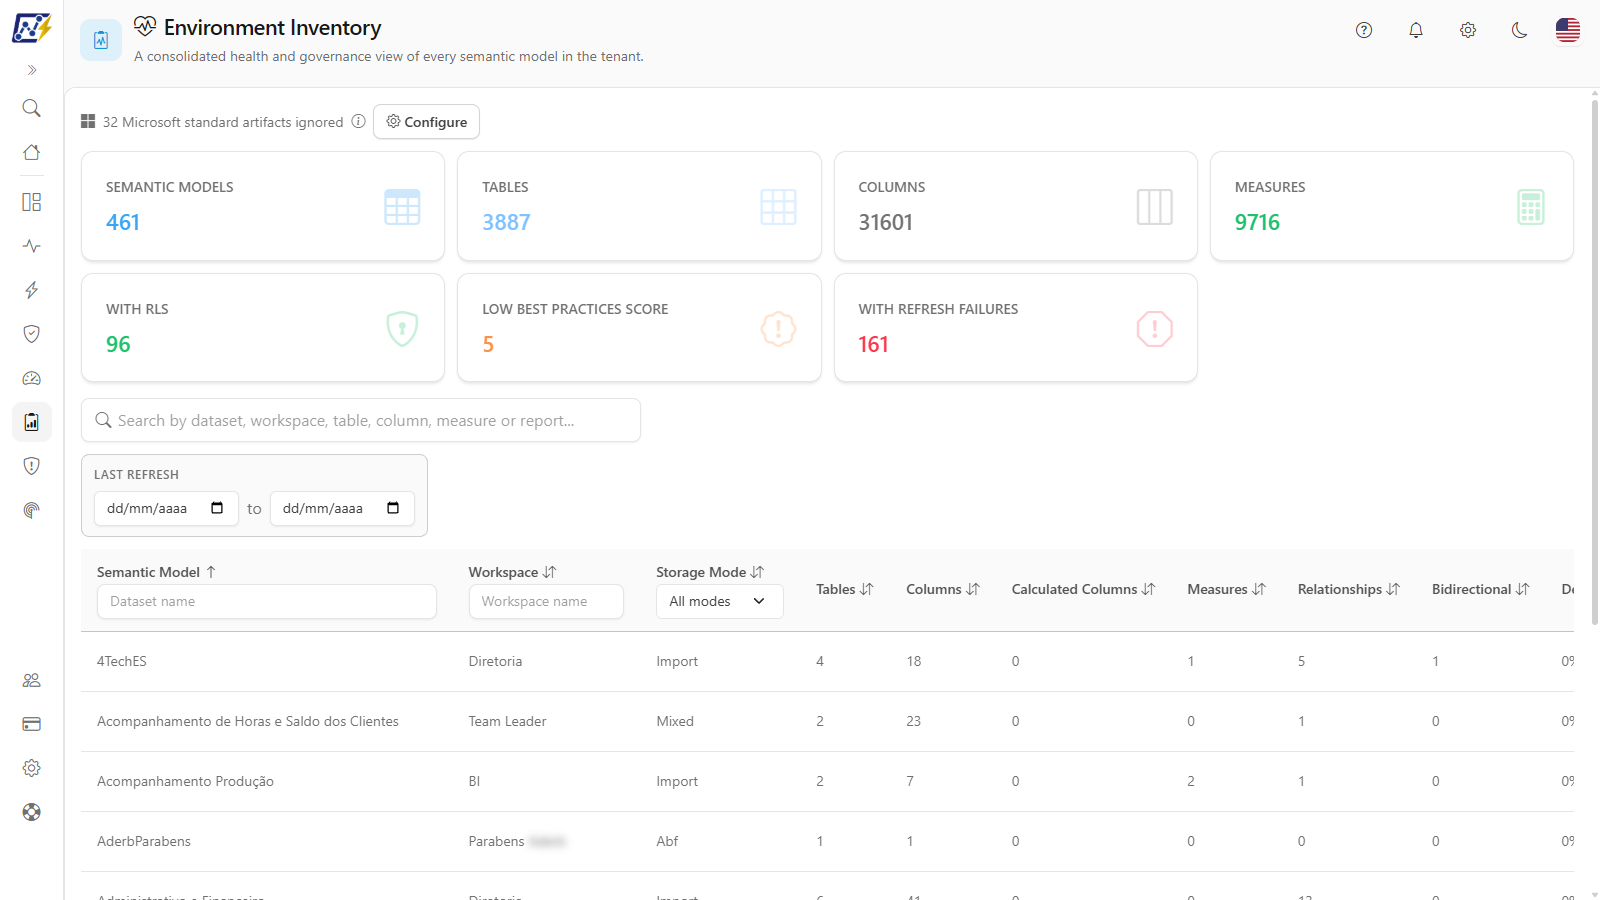
Environment KPIs and table with one row per semantic model
## What it is for
* **Technical inventory of models**: how many tables, columns, calculated columns, measures, and relationships each model has.
* **Prioritize reviews**: sort by *Best Practices Score* or *AI Score* to find the worst models.
* **Security**: find models without RLS or without a sensitivity label.
* **Cost and usage**: find models that consume Capacity Units but have no views (dead artifacts and phantom refreshes).
* **Stability**: see which models failed to refresh in the last 7 days and the average refresh duration.
## Features
### KPI cards
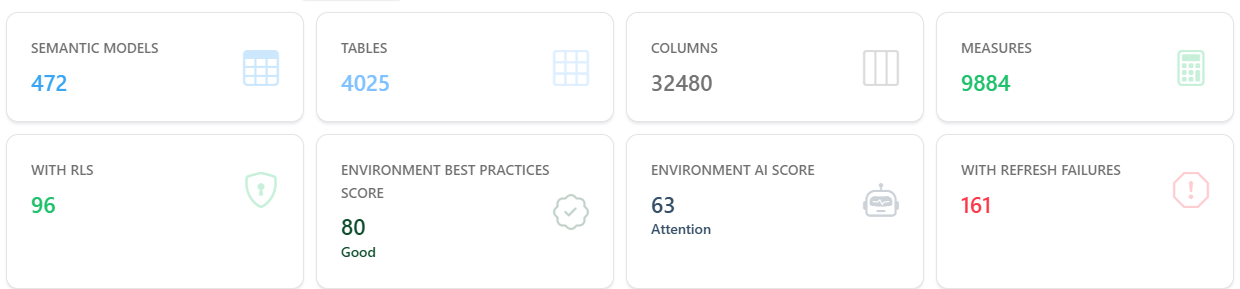
**What it is:** the cards at the top with the environment totals: **Semantic Models**, **Tables**, **Columns**, **Measures**, **With RLS**, **Environment Best Practices Score**, **Environment AI Score** and **With Refresh Failures**.
**What it is for:** sizing the environment, seeing the overall quality of the models in a single score and the main risks (models with failures, with RLS) before drilling down into the table.
Environment KPIs
| KPI | Meaning |
| ------------------------------------ | ------------------------------------------------------------------------------------------------------------------------------------------------------------------------------------------------------------------------------------------------------------------------------------------------------------------- |
| **Semantic Models** | Total semantic models in the tenant (visible to you) |
| **Tables** | Sum of the tables of all models |
| **Columns** | Sum of the columns of all models |
| **Measures** | Sum of the measures of all models |
| **With RLS** | Models that require an effective identity, that is, that have row-level security (RLS) |
| **Environment Best Practices Score** | Simple average, rounded, of the [Best Practices Score](/en/power-monitor/qualidade-de-dados/score-de-boas-praticas-bpa.md) of all models, with the color and status of the per-model score: **Good** (80 or more), **Attention** (60 to 79) or **Needs attention** (below 60). Shows **—** when there are no models |
| **Environment AI Score** | Simple average, rounded, of the [AI Score](/en/power-monitor/qualidade-de-dados/score-de-ia.md) of all models, with the same bands and colors. Shows **—** when there are no models |
| **With Refresh Failures** | Models with at least one refresh failure recorded in the collected history |
**How it works:** the KPIs consider all models of the workspaces in your scope and are not clickable. The two environment scores replaced the former **Low Best Practices Score** card, which counted the models below 60: to find those models, sort the table by the score column.
### General search
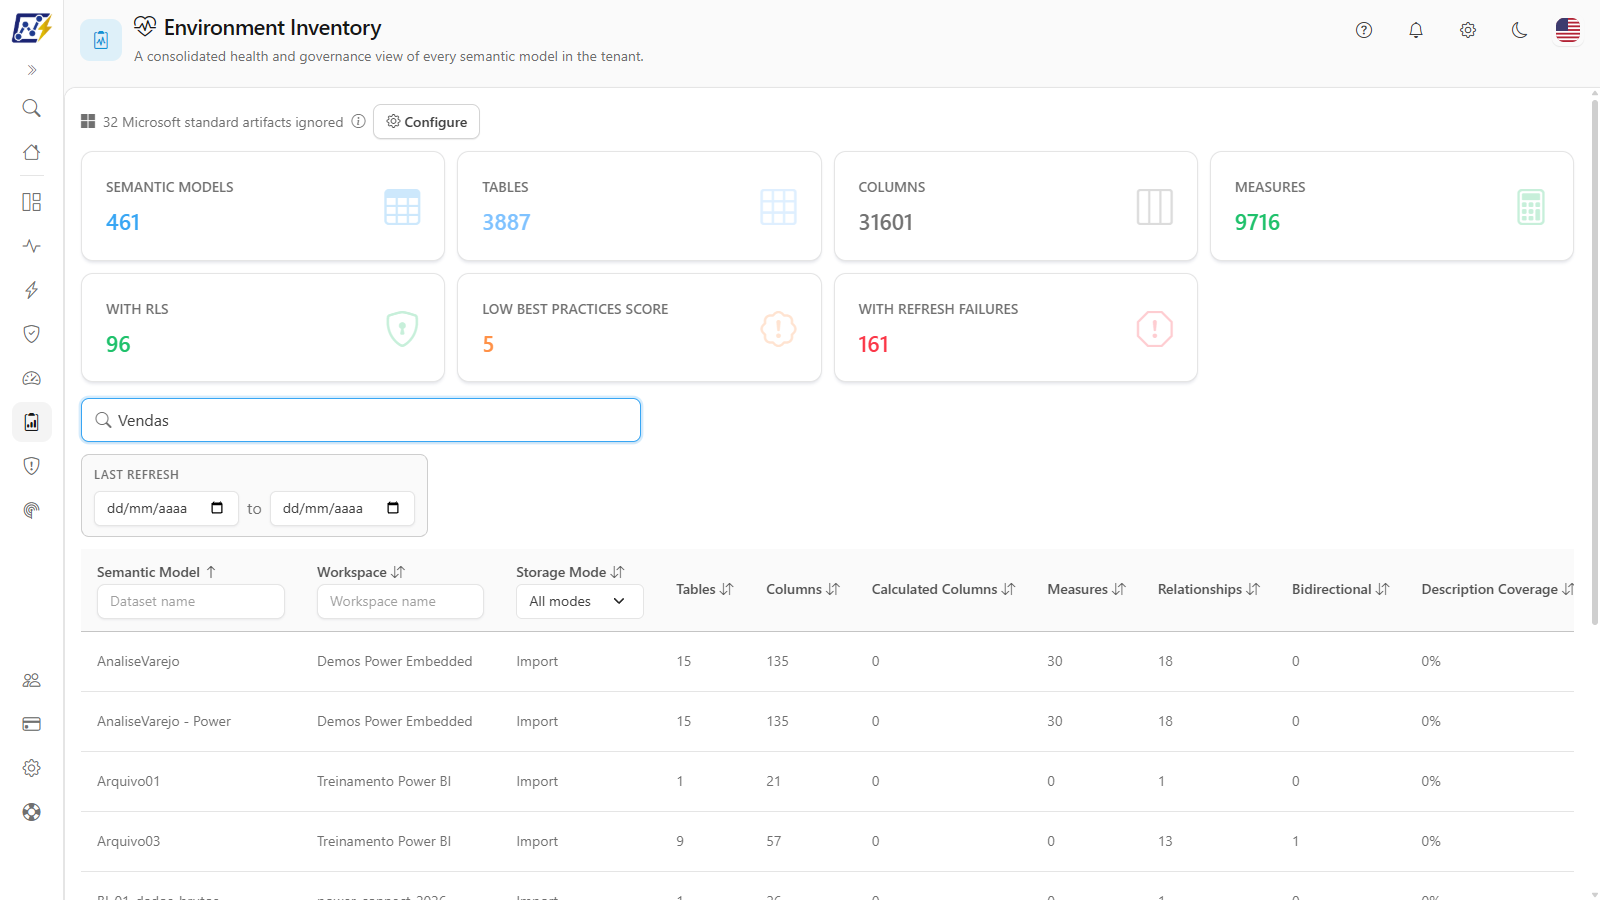
**What it is:** the *Search by dataset, workspace, table, column, measure or report...* field, above the table.
**What it is for:** finding a model by name, or just by the name of a table, column, measure, or report it contains.
General search applied to the table
**How to use:**
1. Type part of the name you are looking for.
2. The table is filtered immediately and returns to the first page.
3. To undo, clear the search text.
### Header filters
**What it is:** the filters right below the column titles: **Semantic Model** (*Dataset name*) and **Workspace** (*Workspace name*) by text; **Storage Mode**, **RLS**, and **Sensitivity Label** by list; and **Last Refresh** by date range (this one is right above the table).
**What it is for:** building slices such as "models without RLS and without a label" or "DirectQuery models of a workspace".
Table filtered by the RLS header
**How to use:**
1. Type in the **Dataset name** or **Workspace name** field. The comparison is case-insensitive and accepts part of the name.
2. Choose a value in **Storage Mode** (**All modes**, *Import*, *DirectQuery*, *DirectLake*, *Dual*, *Mixed*…), **RLS** (**All**, *Yes*, *No*), or **Sensitivity Label** (**All**, the labels existing in the tenant, and *None*).
3. In the **Last Refresh** filter, above the table, enter the start and/or end date.
4. To return to the full list, clear the texts, set the lists back to **All**/**All modes**, and clear the dates.
**How it works:** the filters add up with the general search (all conditions must be met). The lists only offer values that exist in the loaded models. Dates are interpreted in your time zone.
### Semantic models table
**What it is:** one row per semantic model, paginated (the **Items per page** selector offers 10, 25, 50 or 100), with structure, security, usage, refreshes, and scores.
**What it is for:** technical inventory, prioritizing reviews, and hunting down dead artifacts and phantom refreshes.
| Column | Content |
| ---------------------------------------------------- | ----------------------------------------------------------------------------------------------------------------------------------------------------------------- |
| **Semantic Model** | Model name |
| **Workspace** | The model's workspace |
| **Storage Mode** | Import, DirectQuery, DirectLake, Dual, **Mixed** (tables with different modes), or the mode reported by the service when the tables do not carry this information |
| **Tables / Columns / Calculated Columns / Measures** | Counts of the model structure |
| **Relationships** | Total relationships |
| **Bidirectional** | Relationships with cross-filtering in both directions |
| **Description Coverage** | Percentage of tables, columns, and measures that have a description |
| **RLS** | Yes/No |
| **Sensitivity Label** | Microsoft Purview sensitivity label(s) applied to the model, or *None* |
| **Reports / Apps** | Number of reports built on the model and of distinct apps that publish them |
| **Last Refresh** | Date and time of the last recorded refresh |
| **Avg. Refresh Duration** | Average duration of the recorded refreshes |
| **Refresh Failures (7d)** | Refresh failures in the last 7 days (in red when greater than zero) |
| **AI Score** | The model's [AI Score](/en/power-monitor/qualidade-de-dados/score-de-ia.md), with a color by range and the status in the tooltip |
| **Best Practices Score** | The model's [Best Practices Score](/en/power-monitor/qualidade-de-dados/score-de-boas-praticas-bpa.md), with a color by range and the status in the tooltip |
| **Usage Efficiency** | Classification for the last 30 days: *Dead artifact*, *Phantom refresh*, *Over-refreshing*, or *Healthy* |
| **Views (Period)** | Views of the model's reports in the last 30 days |
| **Capacity Units (Period)** | Capacity Units consumption (interactive + background) of the model in the last 30 days |
**Score colors:** **green** (80 or more, *Good*), **blue** (60 to 79, *Attention*), and **red** (below 60, *Needs attention*).
### Sorting and pagination
**What it is:** sorting by the column titles and the pagination below the table.
**What it is for:** bringing to the top the worst scores, the most failures, or the highest consumption.
**How to use:**
1. Click the column title (for example, **Best Practices Score**, **AI Score**, **Refresh Failures (7d)**, **Capacity Units (Period)**, or **Bidirectional**). The first click sorts from highest to lowest; the second reverses it (the arrow next to the title indicates the direction).
2. Use the pagination below the table to navigate and the **Items per page** selector (10, 25, 50 or 100; the default is 10) to see more rows at once.
**How it works:** the **Sensitivity Label** and **Usage Efficiency** columns are not sortable. Search, filters, and sorting are applied in the browser, instantly.
### Model detail
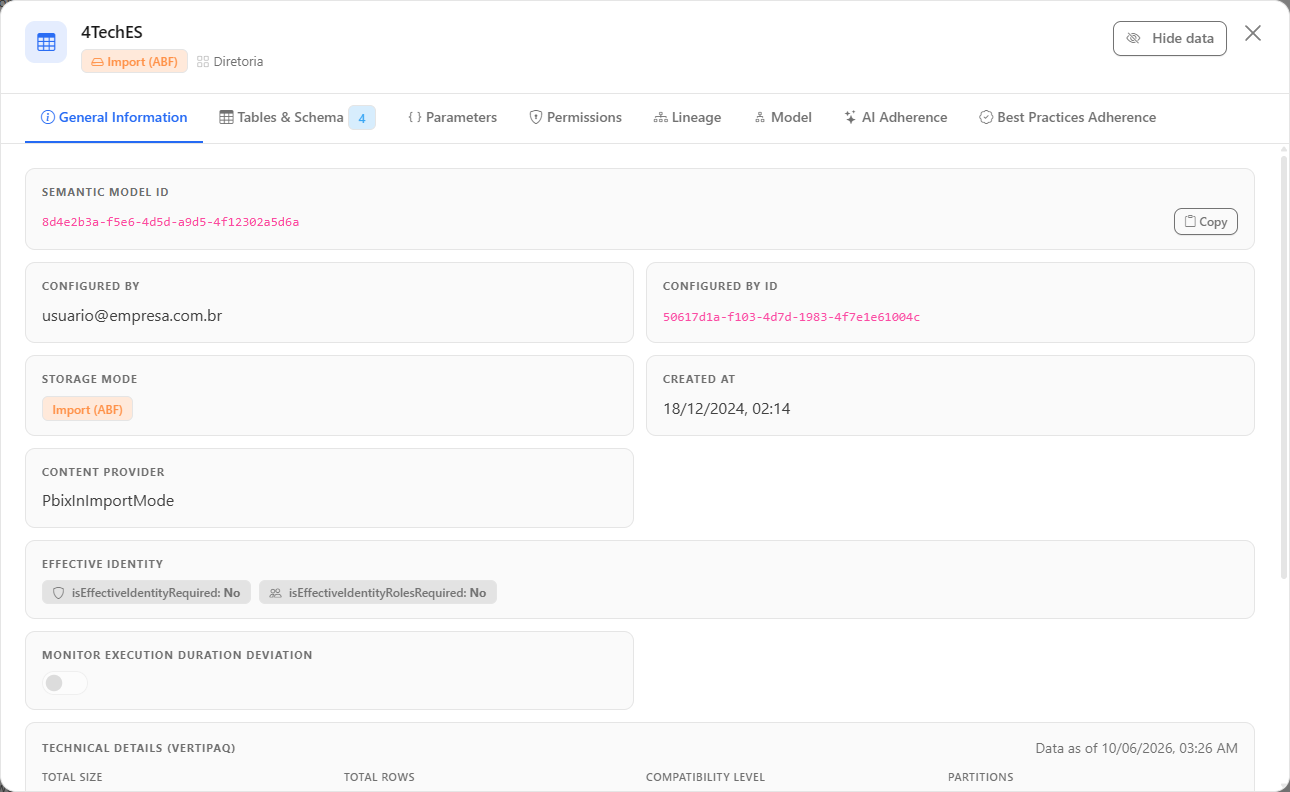
**What it is:** the semantic model detail window (the same as in [Governance › Semantic Models](/en/power-monitor/governanca/modelos-semanticos.md)), opened when you click a row or the eye icon button at the end of it.
**What it is for:** analyzing a model in depth (tables, parameters, users, lineage, diagram, AI and best practices adherence, schedules) without leaving the Inventory.
Semantic model detail
**How to use:**
1. Click anywhere on the model's row or on the eye icon button.
2. Wait for it to load (the button shows a progress indicator). The detail opens in a window over the screen.
3. Close the window to return to the Inventory with the search, filters, and sorting preserved.
**How it works:** if *Could not find details for this semantic model.* appears, the model was probably deleted or left the inventory since the last collection.
## Rules and behavior
* **Usage window.** *Usage Efficiency*, *Views (Period)*, and *Capacity Units (Period)* consider the **last 30 days**, with the same criteria as the [Efficiency Dashboard](/en/power-monitor/dashboards/dashboard-de-eficiencia.md). Report views are attributed to the model they use.
| Classification | Criterion |
| ------------------- | ----------------------------------------------------------------------------- |
| **Dead artifact** | 0 accesses and 0 Capacity Units consumed in the period |
| **Phantom refresh** | Has refreshes and/or Capacity Units consumption, but 0 accesses in the period |
| **Over-refreshing** | Number of refreshes ≥ 2× the period in days, with at most 2 accesses |
| **Healthy** | Normal usage, without the patterns above |
* **Refresh failures.** A refresh counts as a failure when it ended with an error or a failure status. The *With Refresh Failures* KPI considers the entire collected history; the *Refresh Failures (7d)* column, only the last 7 days.
* **Scores.** Calculated with exactly the same formula as the [AI Score](/en/power-monitor/qualidade-de-dados/score-de-ia.md) and [Best Practices Score](/en/power-monitor/qualidade-de-dados/score-de-boas-praticas-bpa.md) screens.
* **Loading.** The screen loads all models at once; search, filters, and sorting are instantaneous in the browser. In very large tenants, the initial load can take a few seconds.
* **Data source.** Metadata from the last inventory scan, refresh history, and consumption metrics collected by Power Monitor. Items deleted in Power BI do not appear.
* **Workspace scope.** The table and the KPIs consider only the workspaces you can view.
* **Microsoft standard artifacts.** The artifacts that Microsoft itself creates in the tenant (Fabric Capacity Metrics, usage metrics models, the Admin monitoring workspace and similar) are left out of the table and the KPIs. When there are any, the notice *N Microsoft standard artifacts ignored* appears at the top of the screen, above the KPIs; see [Microsoft standard artifacts](/en/power-monitor/qualidade-de-dados/exposicao-de-dados.md#microsoft-standard-artifacts) to learn how to configure it (Administrators only).
## Environment checklist by email
If you prefer to receive an environment summary without opening the platform, Power Monitor sends two checklists by email to the organization's **administrators**, configurable in *Settings › Notifications* (reports group):
| Checklist | When | Content |
| -------------------- | ---------------------------------------------------------------------------- | ----------------------------------------------------------------------------------------------------------------------------------------------------------------------------------------------------------------------------------------------- |
| **Daily Checklist** | Once a day, around 8:00 AM (Brasília time, UTC-3), covering the previous day | The day's consumption compared with the previous one, capacities and Capacity Units usage, items and workspaces with the most failures, offline gateways, alerts, and consumption anomalies. **It is sent even when there are no occurrences.** |
| **Hourly Checklist** | Every hour (at 10 minutes past), covering the last full hour | Refresh failures, saturated capacity, offline gateway, and consumption anomalies. **It is only sent when there is something to report.** |
Both are already enabled for all administrators; in *Settings › Notifications* you can turn off sending for each recipient. The checklists always cover the entire environment (they are not filtered by workspace scope). See [Settings › Notifications](/en/power-monitor/configuracoes/notificacoes.md).
## Step by step: common scenarios
### How to prioritize the models that deserve attention
1. Click the title of the column you want to use as the criterion: for example, **Best Practices Score**, **AI Score**, **Refresh Failures (7d)**, **Capacity Units (Period)**, or **Bidirectional**. The first click sorts from highest to lowest; the second reverses the order (the arrow next to the title indicates the direction).
2. To find the worst scores, leave the arrow pointing up (from lowest to highest) on the score columns.
3. Combine with the filters: for example, **RLS** = *No* and **Sensitivity Label** = *None* lists the models with no protection at all; sorting by **Views (Period)** ascending and looking at the **Usage Efficiency** column helps find *Dead artifacts* and *Phantom refreshes*.
{% hint style="info" %}
The **Sensitivity Label** and **Usage Efficiency** columns are not sortable. The table shows 10 models per page by default; use the **Items per page** selector and the pagination below it to navigate.
{% endhint %}
## Frequently asked questions
The storage mode appears as "Mixed". What does it mean?
The model has tables with different storage modes (for example, some in Import and others in DirectQuery), typical of composite models.
A model that I know is used appears as "Dead artifact".
The classification considers the last 30 days of views and consumption. Check whether the collection of audit events is enabled (views come from Power BI activity events: see [Events Overview](/en/power-monitor/auditoria/geral-de-eventos.md)) and whether the model actually had accesses in the period.
Can I export this table?
No. The screen has no export button; use the search, the filters, and the sorting to build the list you need. The issues of a specific model can be exported to CSV on the [AI Score](/en/power-monitor/qualidade-de-dados/score-de-ia.md) and [Best Practices Score](/en/power-monitor/qualidade-de-dados/score-de-boas-praticas-bpa.md) screens.
## Related pages
* [Environment X-Ray](/en/power-monitor/qualidade-de-dados/raio-x-do-ambiente.md): overall diagnosis with a score and findings by severity
* [Workspace X-Ray](/en/power-monitor/qualidade-de-dados/raio-x-de-workspace.md)
* [AI Score](/en/power-monitor/qualidade-de-dados/score-de-ia.md) and [Best Practices Score](/en/power-monitor/qualidade-de-dados/score-de-boas-praticas-bpa.md)
* [Efficiency Dashboard](/en/power-monitor/dashboards/dashboard-de-eficiencia.md)
* [Monitoring › Semantic Models](/en/power-monitor/monitoramento/modelos-semanticos.md)
---
# Agent Instructions
This documentation is published with GitBook. GitBook is the documentation platform designed so that both humans and AI agents can read, navigate, and reason over technical content effectively. Learn more at gitbook.com.
## Querying This Documentation
If you need additional information that is not directly available in this page, you can query the documentation by asking a question.
Perform an HTTP GET request on the following URL with the `ask` and `goal` query parameters:
```
GET https://docs.powermonitor.com.br/en/power-monitor/qualidade-de-dados/inventario-do-ambiente.md?ask=&goal=
```
`ask` is the immediate question: it should be specific, self-contained, and written in natural language.
`goal` is what the user is ultimately trying to achieve, the reason they need the answer. Sharing it helps GitBook give you a better, more relevant answer. A goal is most helpful when it describes the outcome the user wants rather than restating the question. For example, with `ask=how do I create an API token`, a goal like `automate deployments from our CI pipeline` lets GitBook tailor the answer to that use case.
The response will contain a direct answer to the question and relevant excerpts and sources from the documentation.
Use this mechanism when the answer is not explicitly present in the current page, you need clarification or additional context, or you want to retrieve related documentation sections.