> For the complete documentation index, see [llms.txt](https://docs.powermonitor.com.br/llms.txt). Markdown versions of documentation pages are available by appending `.md` to page URLs; this page is available as [Markdown](https://docs.powermonitor.com.br/en/power-monitor/qualidade-de-dados/linhagem-de-dados.md).

# Data Lineage

See where a semantic model's data comes from and who consumes it, and what Fabric notebooks, pipelines, Copy Jobs, and dataflows read and write, with sources, gateways, reports, apps, composite models

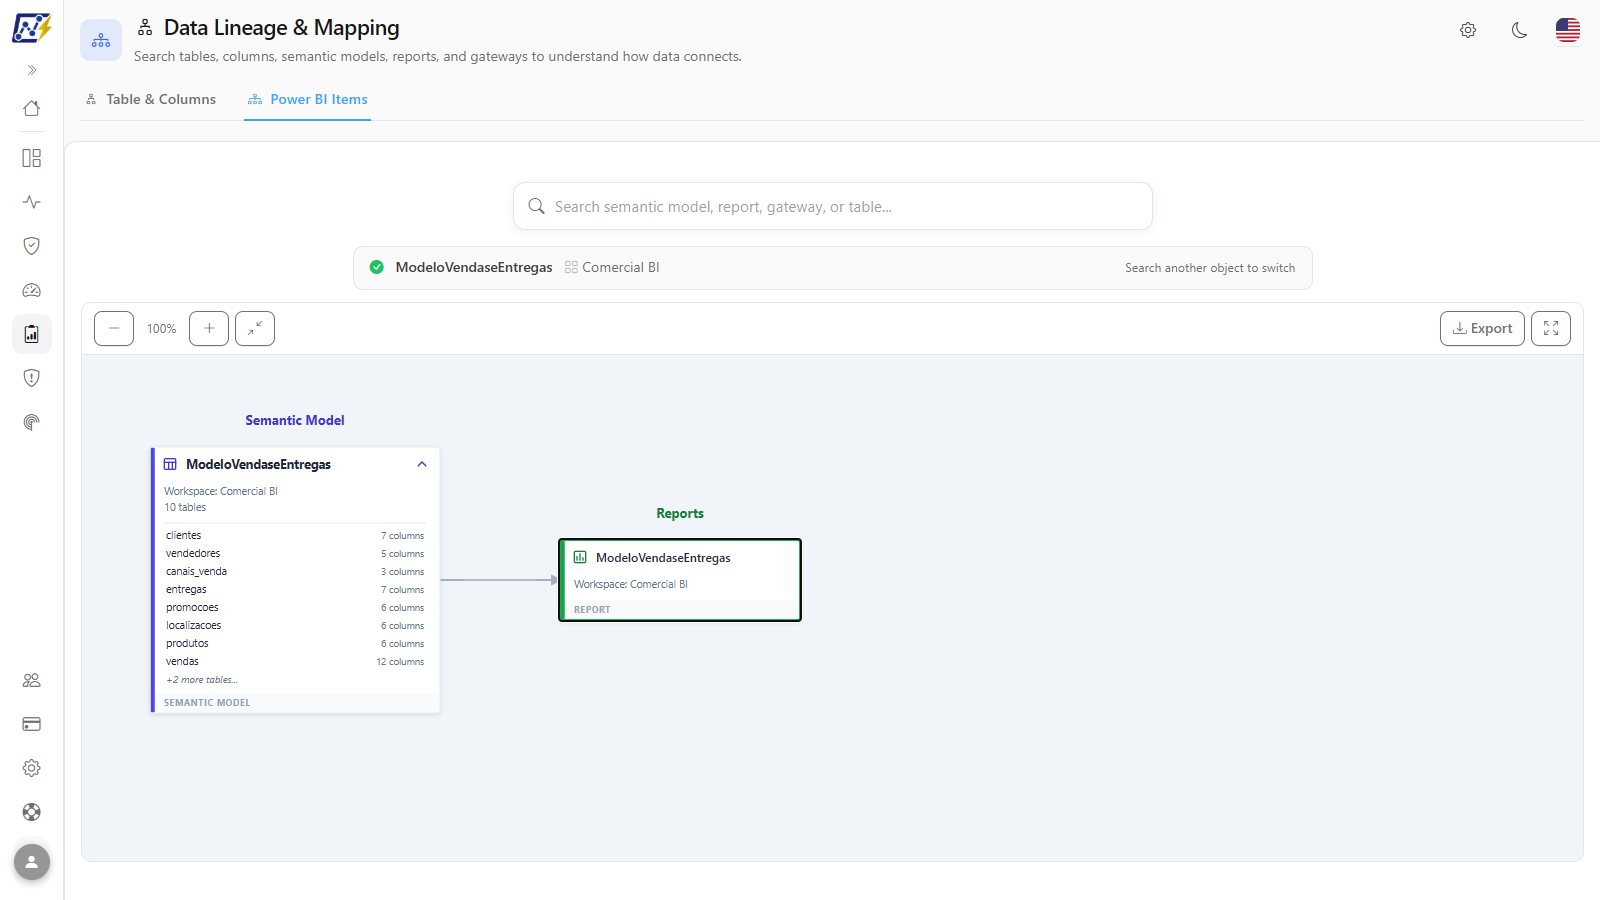
**Data Lineage** shows, in an interactive diagram, the complete data path of a semantic model: the **data sources** and **gateways** it reads from, the **source models** it consumes (composite models), the **reports** and **apps** that use it, and the **dependent models** built on top of it. On the same screen you can also search for a **table or column** and find out in which semantic models, in any workspace, it exists. The screen also shows what Fabric **notebooks, Data Pipelines, Copy Jobs, and Dataflows (Gen1 and Gen2)** **read, write, and orchestrate**, down to the level of Lakehouse and Warehouse tables and columns.

**How to access:** *Data Quality › Data Lineage*. Available to all profiles (read-only). The page title is **Data Lineage & Mapping**.

<figure><picture><source srcset="/files/QZvaQtkkcRbUBzsGwQmS" media="(prefers-color-scheme: dark)"><img src="https://3938213054-files.gitbook.io/~/files/v0/b/gitbook-x-prod.appspot.com/o/spaces%2FH2bFRBmIfyK3kwVKbldl%2Fuploads%2Fgit-blob-76859807aeb5ffae580370cc8ce129b3ed658de4%2Fpm-qualidade-linhagem-de-dados-en.png?alt=media" alt="Power BI Items tab with the lineage diagram of a semantic model"></picture><figcaption><p>Power BI Items tab: sources, model, reports, dependent model, and its reports</p></figcaption></figure>

## What it is for

* **Impact analysis before a change.** Going to change the type of a column in the database, rename a table, or migrate a server? See which models use that table and which reports and apps will be affected.
* **Understand an inherited model.** Quickly find out which databases, Lakehouses, or files a model reads from and through which gateway.
* **Map composite models.** Identify models that consume other models (DirectQuery for semantic models): a change in the source model also affects the dependent models and their reports.
* **Find duplication.** Search for a table name (for example, `dim_customer`) and see in how many different models it is loaded.
* **Impact on Fabric items.** Going to rename a Lakehouse table or replace a Warehouse? See which notebooks, pipelines, Copy Jobs, and dataflows read or write to it before you touch it.
* **Understand what a notebook or pipeline does.** Find out which tables it reads from, where it writes, and which other items it triggers.

## Features

### Table & Columns and Power BI Items tabs

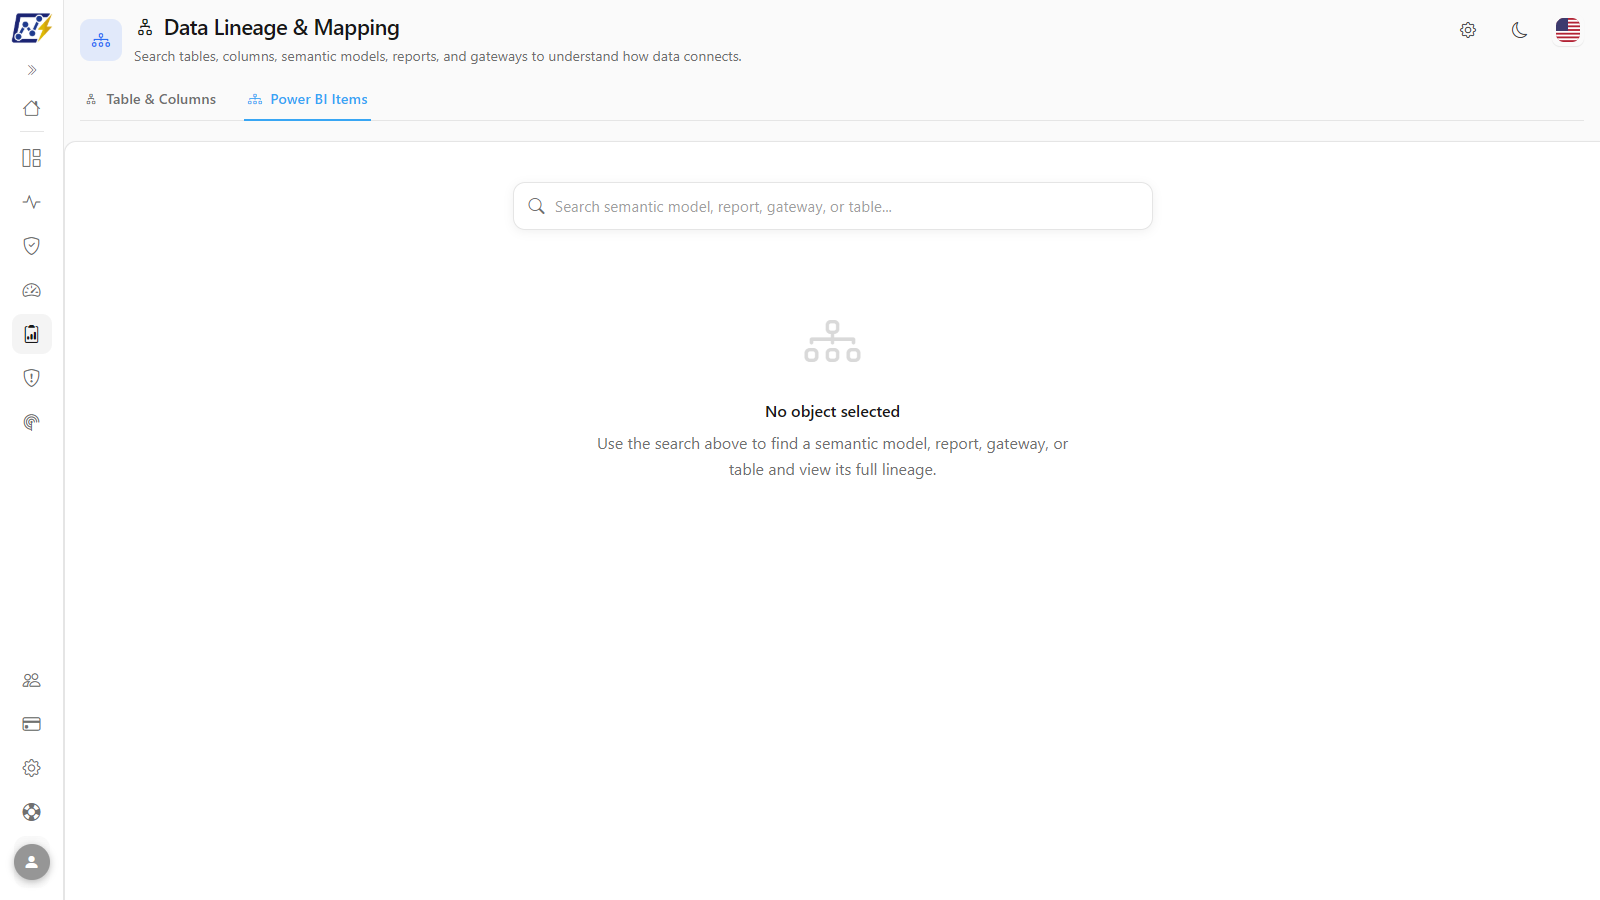
**What it is:** the two tabs of the screen. **Table & Columns** starts from a table or column name; **Power BI Items** starts from an item (semantic model, report, gateway, table, notebook, pipeline, Copy Job, or dataflow).

**What it is for:** choosing the starting point of the investigation: "where does this column exist?" or "where does this model's data come from and who uses it?".

<figure><picture><source srcset="/files/Ll3Q8KlNbdxdnNONBXSx" media="(prefers-color-scheme: dark)"><img src="https://3938213054-files.gitbook.io/~/files/v0/b/gitbook-x-prod.appspot.com/o/spaces%2FH2bFRBmIfyK3kwVKbldl%2Fuploads%2Fgit-blob-32b9c8aab3c42406068fcb0dbe2b7130b88c0a52%2Fpm-qualidade-linhagem-itens-en.png?alt=media" alt="Power BI Items tab with the search field and the No object selected message"></picture><figcaption><p>The two tabs of the screen; here, the Power BI Items tab before the search</p></figcaption></figure>

**How to use:**

1. Click the **Table & Columns** or **Power BI Items** tab.
2. To share the screen already on the right tab, copy the page address: it ends in `?tab=columns` (**Table & Columns**) or `?tab=items` (**Power BI Items**).

**How it works:** the selected tab is recorded in the address; the search is not part of the link. Each tab keeps its own search while you switch between them.

{% hint style="info" %}
The former **Data Mapping** screen was incorporated into this page as the **Table & Columns** tab. Old links to it automatically open this tab.
{% endhint %}

### Table or column search

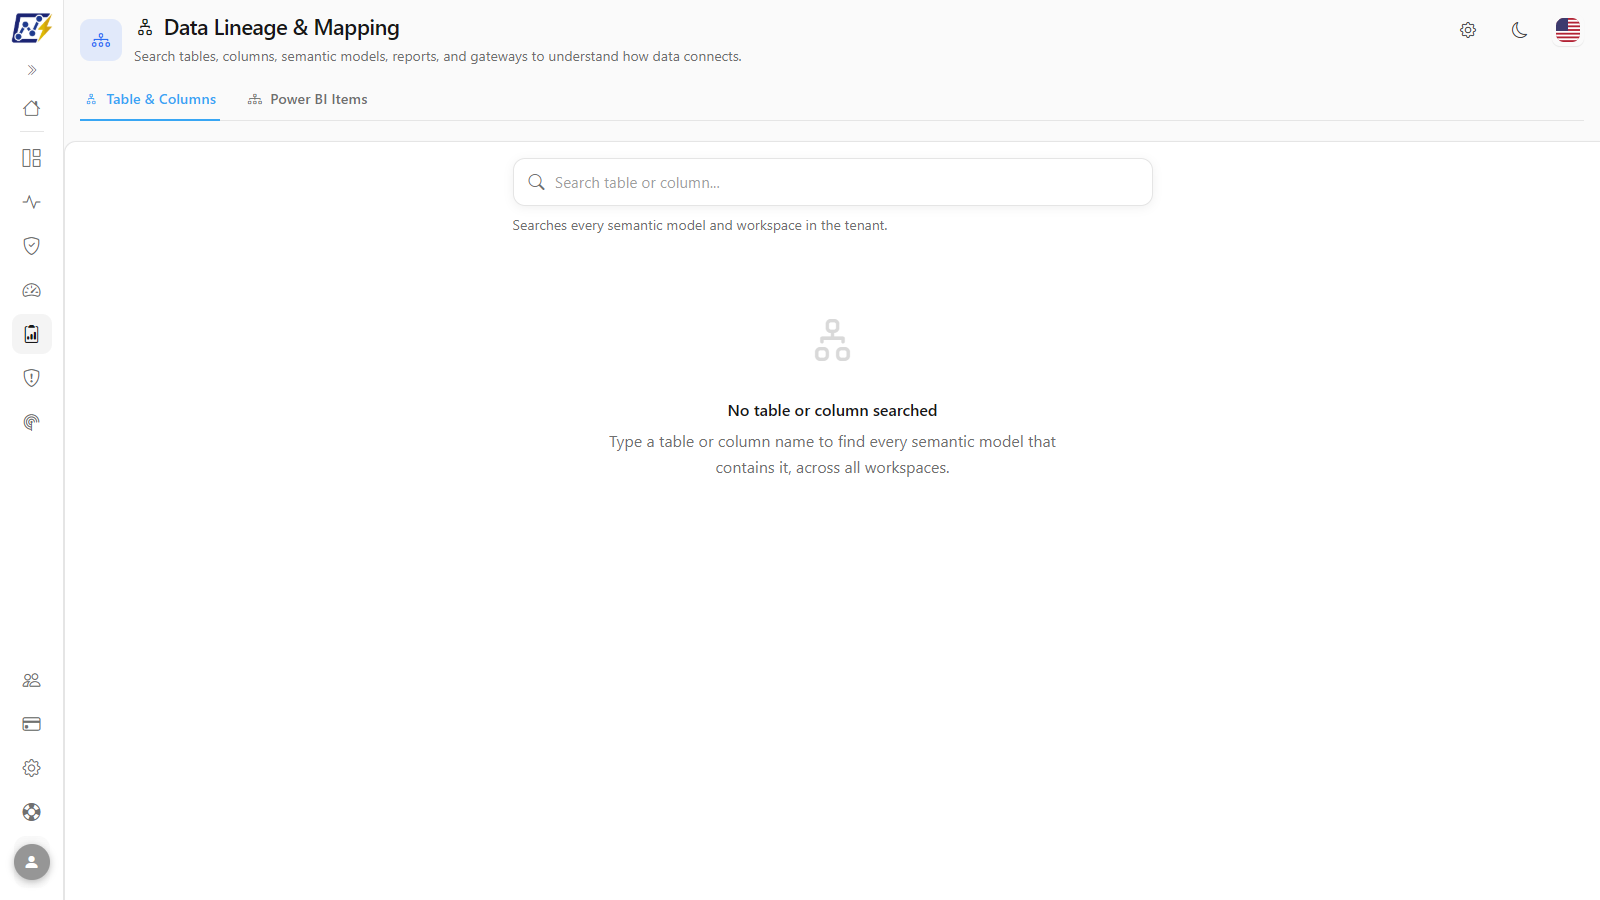
**What it is:** the *Search table or column...* field of the **Table & Columns** tab, which looks for the name in all semantic models and workspaces you can see.

**What it is for:** impact analysis before changing a column in the database and identifying tables duplicated across several models (for example, `dim_customer`).

<figure><picture><source srcset="/files/QZvaQtkkcRbUBzsGwQmS" media="(prefers-color-scheme: dark)"><img src="https://3938213054-files.gitbook.io/~/files/v0/b/gitbook-x-prod.appspot.com/o/spaces%2FH2bFRBmIfyK3kwVKbldl%2Fuploads%2Fgit-blob-76859807aeb5ffae580370cc8ce129b3ed658de4%2Fpm-qualidade-linhagem-de-dados-en.png?alt=media" alt="Table &#x26; Columns tab with search results and a diagram with the table highlighted"></picture><figcaption><p>Table &#x26; Columns tab: matches on the left, model lineage with the table highlighted on the right</p></figcaption></figure>

**How to use:**

1. In the **Table & Columns** tab, type at least **2 characters** in the search field (for example, `CustomerKey`). While nothing has been searched, the screen shows *No table or column searched*.
2. Read the *N matches found* list: each row shows `Table · Column` (or just the table), the **Model**, and the **workspace**; the icon distinguishes a table from a column.
3. The first match comes already selected. Click the others to switch the diagram displayed on the right.
4. For a new search, click the field's **X** (**Clear**).

**How it works:**

* When you select a match, the lineage diagram of the corresponding model appears with the **table highlighted** at the top of the table list in the model card.
* When you searched for a column, the highlighted row also shows the column at the source (`column ← column_at_source`) and the physical table (`schema.table`), when Power Monitor can identify them in Power Query. Otherwise, *origin not identified* appears: a limit of the analysis, not an error in the model.
* With no results, *No table or column found with that name* appears.

### Power BI item search

**What it is:** the *Search model, report, gateway, table, notebook, pipeline or dataflow\...* field of the **Power BI Items** tab, with suggestions as you type.

**What it is for:** opening the complete lineage of a known item: for example, understanding where an inherited model reads its data from or what a notebook writes.

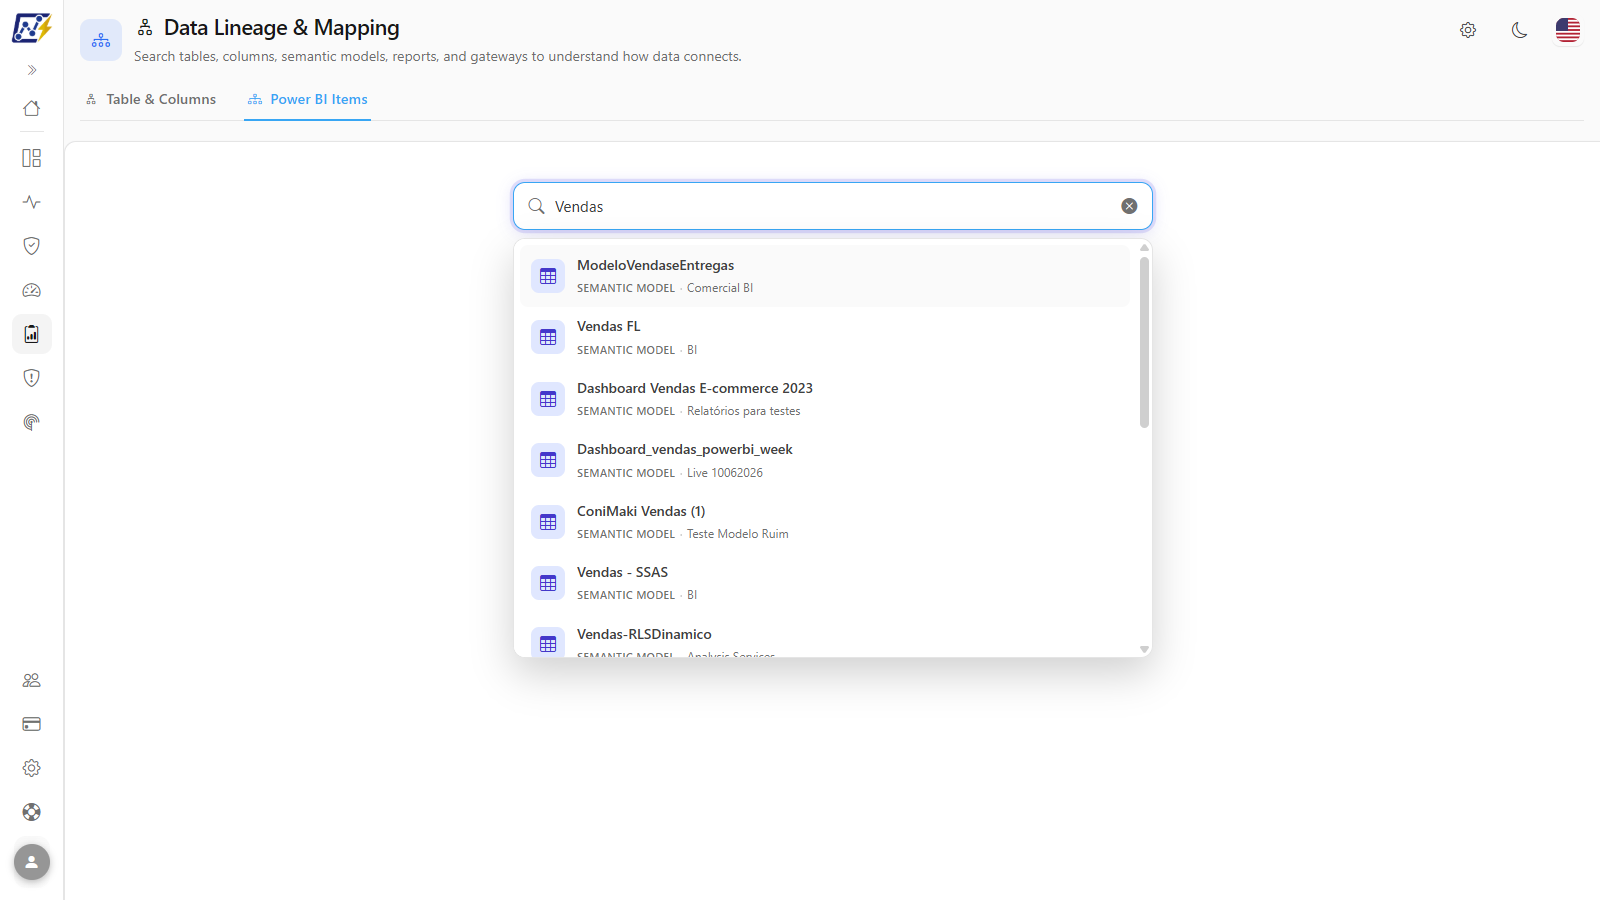
<figure><picture><source srcset="/files/SFpnAMU86pr0XANYfGhk" media="(prefers-color-scheme: dark)"><img src="https://3938213054-files.gitbook.io/~/files/v0/b/gitbook-x-prod.appspot.com/o/spaces%2FH2bFRBmIfyK3kwVKbldl%2Fuploads%2Fgit-blob-e2fbe168176dcd53dd41f2a69a44348b4191c0d7%2Fpm-qualidade-linhagem-itens-pesquisa-en.png?alt=media" alt="Search field of the Power BI Items tab with the suggestions list open"></picture><figcaption><p>Suggestions with the item type and the workspace</p></figcaption></figure>

**How to use:**

1. Type at least 2 characters. Suggestions appear after a brief pause and show the item type, the workspace and, for reports, gateways, and tables, the **Model** the result leads to. For notebooks, pipelines, Copy Jobs, dataflows, and Fabric tables, they show the type and the workspace.
2. Click the suggestion, or use **↑**/**↓** and **Enter**. **Esc** closes the list.
3. Check the strip above the diagram: it shows the **semantic model** and the **workspace** displayed, with the hint *Search another object to switch*.

**How it works:** model, report, gateway, and model table results lead to the diagram of a semantic model: a report leads to the model it uses; a gateway or a table, to a model that uses them. Notebook, pipeline, Copy Job, dataflow, and Fabric table results lead to the [Fabric item dependencies](#fabric-item-dependencies) view. With nothing selected, the screen shows *No object selected*.

### Fabric item dependencies

**What it is:** the view that opens when, in the **Power BI Items** tab, you choose a **Notebook**, a **Data Pipeline**, a **Copy Job**, a **Dataflow** (Gen1 or Gen2), or a **Fabric table** (a Lakehouse or Warehouse table). Instead of the semantic model diagram, the screen shows a two-column diagram with what the item **reads**, **writes**, and **orchestrates**, and who depends on it.

**What it is for:** answering "where does this notebook read from and where does it write?", "which items write to this table?", and "what will be affected if I change this table?", without opening the code of each item.

**How to use:**

1. In the **Power BI Items** tab, type at least 2 characters of the name of a notebook, pipeline, Copy Job, dataflow, or a Lakehouse or Warehouse table, and choose the result.
2. Read the diagram (see [How to read the dependency diagram](#how-to-read-the-dependency-diagram)).
3. Click a card to see, below the diagram, the columns, the confidence, and the evidence of each dependency. To open the view of another item (for example, a notebook that reads the table), click **View dependencies of this item**. The **Back** button, in the strip above the diagram, returns to the previous item.
4. If needed, use the filters and export the result (see the topics below).

**How it works:** the view uses the dependencies read by the daily collector (see [How dependencies are collected](#how-dependencies-are-collected)). When the collector has not read the item yet or could not read it, a notice appears above the diagram.

#### How to read the dependency diagram

The chosen item sits in the center. On the left is the **Inputs (sources and orchestrators)** column and, on the right, **Outputs (targets and consumers)**. Each arrow has the color of its direction:

| Arrow  | Direction         | What it means                                                                                                                  |
| ------ | ----------------- | ------------------------------------------------------------------------------------------------------------------------------ |
| Blue   | **Read**          | The item reads data from that target. The arrow enters the item from the left.                                                 |
| Orange | **Write**         | The item writes data to that target. The arrow leaves the item to the right.                                                   |
| Violet | **Orchestration** | The item triggers or runs another item (for example, a pipeline that runs a notebook). The arrow leaves the item to the right. |

When you choose a **Fabric table**, the direction is reversed: whoever **writes** to the table appears on the left (input) and whoever **reads** it appears on the right (output).

Each card shows the type of what was found: **Notebook**, **Data Pipeline**, **Copy Job**, **Dataflow**, **Fabric table** (with schema and table), **External source** (a database, a storage path, or another source outside Fabric), and **Item without access**. The **Legend**, next to the zoom buttons, summarizes the colors and markers. The diagram has zoom (**−**/**+**), **Fit to screen**, and background dragging, like the other diagrams.

#### Confidence: exact or inferred

Reading the code is a static analysis, not an execution. That is why each dependency has a **Confidence**:

| Confidence   | When it happens                                                                                                                                                              | How it appears                                                                                      |
| ------------ | ---------------------------------------------------------------------------------------------------------------------------------------------------------------------------- | --------------------------------------------------------------------------------------------------- |
| **Exact**    | The item was identified by its identifier (ID) and the table or path is written literally.                                                                                   | Solid arrow and a green badge in the details.                                                       |
| **Inferred** | Any deduction: the item was cited only by name, it is the notebook's default Lakehouse, the value comes from a variable, or the table comes from a freely written SQL query. | **Dashed** arrow (when all the evidence of the card is inferred) and a yellow badge in the details. |

If the same name matches more than one item, Power Monitor does not choose: it keeps the dependency as **Inferred**, without linking it to any item.

#### Dynamic marker

The **dynamic** marker (lightning icon, in the middle of the arrow and on the card) indicates that the target is built only at run time, for example, a table whose name comes from a parameter or a variable. Power Monitor shows what it could identify (the item, the Lakehouse) and warns that the exact table may vary.

#### Card details

When you click a card, the area below the diagram lists each of its dependencies, with:

* the **Depends on** or **Used by** badges, the direction (**Read**, **Write**, or **Orchestration**), the **Confidence** (**Exact** or **Inferred**), and **dynamic**, when applicable;
* the **Table** (schema and table) and the **Path**, when there is one;
* the **Columns**, each with its usage: **Select**, **Filter**, **Join**, **Write**, **Mapping**, or **All columns**;
* the **Evidence**: the kind of excerpt that originated the dependency and its location (for example, the notebook cell or the pipeline activity), always as short text. The code itself is never shown;
* the **Parameters** used (names only) and **Last seen**.

Cards with many dependencies show 25 at a time; use **Show more** to see the rest. When you click the central card, the details area shows only a usage hint.

#### Items without access

If a dependency points to an item in a workspace you cannot view (because of your workspace scope), the diagram does not show its name, workspace, table, or columns. Instead, a single **Item without access** card appears, with the count (*N dependency(ies) on items without access*), on the corresponding side. That way you know the dependency exists without seeing what you are not allowed to see. This card does not have the **View dependencies of this item** button. If you try to open an item outside your scope, the screen shows *Item not found or outside your workspace scope.*

#### Filters

Above the diagram there are three filters: **Item type** (**All types**, **Notebook**, **Data Pipeline**, **Copy Job**, **Dataflow**, **Fabric table**, or **External source**), **Direction** (**All directions**, **Read**, **Write**, or **Orchestration**), and the **Hide inferred** box, which hides the dependencies with **Inferred** confidence and leaves only the exact ones. The summary shows *N of M dependencies* and **Clear filters** returns to the initial state. The chosen item never leaves the diagram. If nothing matches the filters, *No dependencies match the current filters.* appears.

#### Capture notice

When the collector has not read the item yet, or the last read failed, a notice appears above the diagram:

| Notice                                            | What it means                                                                                                                                                                          |
| ------------------------------------------------- | -------------------------------------------------------------------------------------------------------------------------------------------------------------------------------------- |
| **Dependencies not collected yet**                | Power Monitor has not read the item's definition yet. The collection runs once a day: come back later.                                                                                 |
| **The definition of this item could not be read** | The last attempt failed. The notice explains the reason in plain language (table below) and shows the date of the last successful read; the dependencies displayed are from that read. |

| Reason shown                                                                              | Explanation and what to do                                                                                                                                                                                     |
| ----------------------------------------------------------------------------------------- | -------------------------------------------------------------------------------------------------------------------------------------------------------------------------------------------------------------- |
| The Service Principal must be a member of the workspace with write permission on the item | Fabric requires write access to read the definition and answers as if the item did not exist when the permission is missing. Give the Service Principal the **Contributor** role (or higher) in the workspace. |
| This item does not allow reading its definition                                           | For example, older Dataflows Gen2 without Git/CI-CD support. No permission fixes this.                                                                                                                         |
| The item has a sensitivity label with encryption                                          | Fabric blocks reading the definition in that case.                                                                                                                                                             |
| Fabric temporarily limited the calls                                                      | Transient: the item will be read again in the next collection.                                                                                                                                                 |
| The definition was read, but its format could not be interpreted                          | The item will be evaluated again when Power Monitor is updated.                                                                                                                                                |
| The item definition had no recognizable content                                           | Nothing was extracted; the read will be tried again later.                                                                                                                                                     |
| The read worked, but the result could not be saved                                        | It will be tried again in the next collection.                                                                                                                                                                 |
| Unclassified reason                                                                       | The read will be tried again; the error code appears in the notice to help support.                                                                                                                            |

Failures are re-evaluated in the following collections: transient ones within a few hours; permission failures or unsupported items, within up to 7 days or when the item changes.

#### Export

* **Export PNG**, in the diagram toolbar, downloads the diagram as an image.
* **Export CSV**, next to the filters, downloads **one row per visible dependency**: the file respects the applied filters. The columns are *Item*, *Item type*, *Relation*, *Operation*, *Related type*, *Related*, *Related workspace*, *Schema*, *Table*, *Path*, *Columns*, *Confidence*, *Evidence*, *Evidence location*, *Dynamic*, *Parameters*, and *Last seen*. Dependencies on items without access carry no names.

With the **Hide data** button on, e-mails that appear inside names or paths (for example, in SharePoint) are masked in the details and in the CSV.

#### Screen limits

* Each column of the diagram draws up to 60 cards. The excess is not drawn and the screen warns you (*N item(s) were not drawn (limit of 60 per column). Use the filters to narrow the list.*).
* When the volume of dependencies is very large, the list is limited and the notice *The server limited the list* appears. Use the filters or the CSV to analyze what was returned.

### Lineage diagram

**What it is:** the diagram organized in columns, from left (source) to right (consumption). Columns with no items do not appear.

**What it is for:** seeing at once the sources, gateways, source models, reports, apps, and dependent models: the direct and indirect impact of a change.

| Column                          | What it shows                                                                                                                                                                                                                                    |
| ------------------------------- | ------------------------------------------------------------------------------------------------------------------------------------------------------------------------------------------------------------------------------------------------ |
| **Data Sources**                | Databases, files, services, and Fabric items the model reads from. Each source type has its own icon (SQL Server, Azure SQL, Oracle, PostgreSQL, Snowflake, Databricks, SharePoint, Excel, Web, OData, Fabric Lakehouse, Fabric Warehouse, etc.) |
| **Source models**               | Other Power BI semantic models that this model consumes (composite model)                                                                                                                                                                        |
| **Gateways**                    | Gateways through which the sources are accessed                                                                                                                                                                                                  |
| **Semantic Model**              | The analyzed model, with workspace, number of tables, and the table list (up to 8 visible, with *+N more tables...* for the rest) and columns per table                                                                                          |
| **Reports**                     | Reports built on the model, with the workspace of each one                                                                                                                                                                                       |
| **Dependent models**            | Composite models that consume this model                                                                                                                                                                                                         |
| **Apps**                        | Power BI apps that publish the model's reports                                                                                                                                                                                                   |
| **Reports of dependent models** | Reports built on the dependent models: the indirect impact of a change in this model                                                                                                                                                             |

### Card details and highlighting

**What it is:** the interaction with each card in the diagram: hovering shows the details; clicking highlights the connections.

**What it is for:** checking the server, database, and gateway of a source, or visually isolating the path of a report in a large diagram.

<figure><picture><source srcset="/files/XEXxu4HFoonnaT26li1z" media="(prefers-color-scheme: dark)"><img src="https://3938213054-files.gitbook.io/~/files/v0/b/gitbook-x-prod.appspot.com/o/spaces%2FH2bFRBmIfyK3kwVKbldl%2Fuploads%2Fgit-blob-4068395c23cff8cb111ae9dc971b0e62e21307d5%2Fpm-qualidade-linhagem-diagrama-destaque-en.png?alt=media" alt="Diagram with a highlighted card and the rest dimmed"></picture><figcaption><p>Highlighted card with its connections</p></figcaption></figure>

**How to use:**

1. **Hover** over a card to see the details: type, workspace, server, database, privacy level, and ID (sources); type and machine (gateways); report type (reports); published by and number of reports (apps).
2. **Click** a card to highlight its connections and dim the rest. Click again to undo.
3. **Click the semantic model card** to collapse or expand the table list.

### Navigation, zoom, and fullscreen

**What it is:** the controls to move and zoom the diagram: dragging the background, the mouse wheel, and the **−**/**+** buttons (with the percentage), **Fit to screen**, and **Fullscreen** in the toolbar.

**What it is for:** working with large diagrams, with many reports and sources.

**How to use:**

1. **Drag** the background to move the diagram.
2. Use the **mouse wheel** or the **−**/**+** buttons to zoom.
3. Click **Fit to screen** to frame the entire diagram.
4. Click **Fullscreen** to have the diagram fill the whole screen; click again (**Exit fullscreen**) to go back.

### Export the diagram

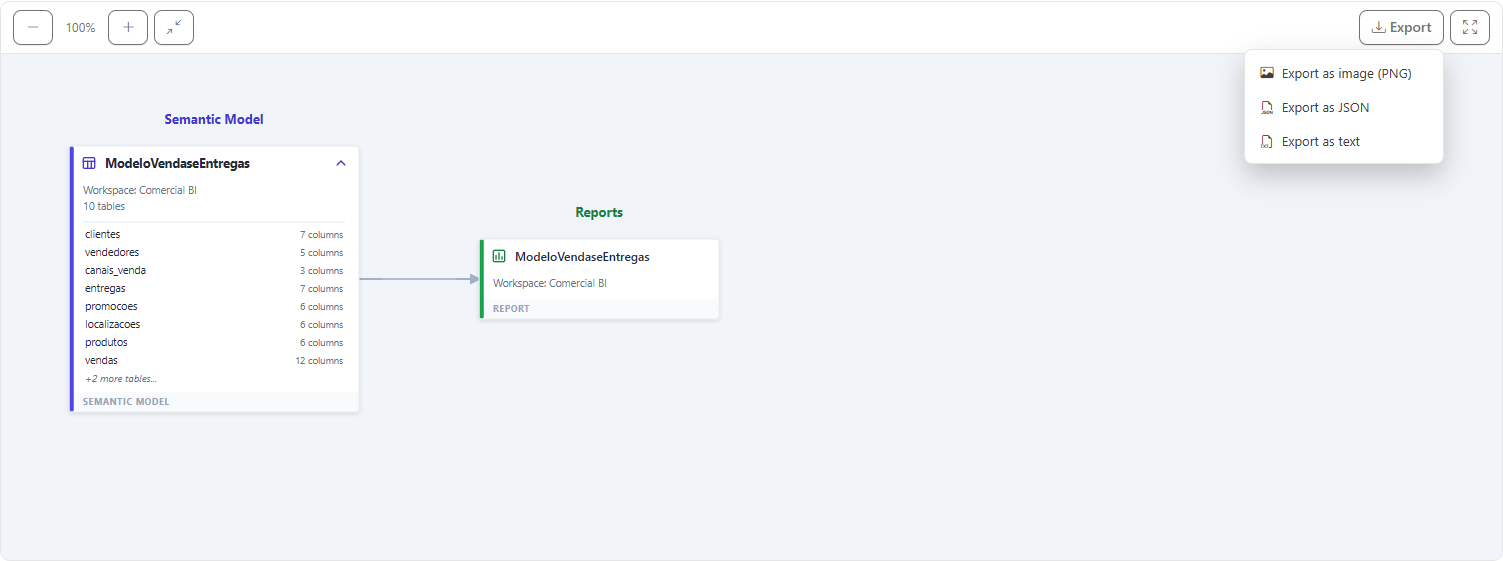
**What it is:** the **Export** button in the toolbar, with **Export as image (PNG)**, **Export as JSON**, and **Export as text**.

**What it is for:** attaching the lineage to a change request or to the model's documentation.

<figure><picture><source srcset="/files/PdlLBSK88kD9Gtbwfd8W" media="(prefers-color-scheme: dark)"><img src="https://3938213054-files.gitbook.io/~/files/v0/b/gitbook-x-prod.appspot.com/o/spaces%2FH2bFRBmIfyK3kwVKbldl%2Fuploads%2Fgit-blob-759a539bc123aec53a315fe4000f74db92534207%2Fpm-qualidade-linhagem-exportar-en.png?alt=media" alt="Diagram Export menu with the PNG, JSON, and text options"></picture><figcaption><p>Diagram export options</p></figcaption></figure>

**How to use:**

1. With the diagram displayed, click **Export**.
2. Choose **Export as image (PNG)**, **Export as JSON**, or **Export as text**.
3. The file is downloaded by the browser.

## Rules and behavior

* **Where the data comes from.** The lineage is built from the metadata collected by Power Monitor scans (tenant inventory, model connections, and Power Query expressions). There is no real-time query to Power BI: a recently published report or model appears after the next scan.
* **Fabric sources by name.** When the model connects to a Lakehouse or Warehouse through the SQL endpoint, Power Monitor identifies the item and shows the **Lakehouse/Warehouse name** and its **workspace**, instead of the server's technical address. If the same endpoint can correspond to more than one item, the source is displayed without this identification.
* **Composite models.** A model is recognized as a *Source model* when the connection or the Power Query expression points to another Power BI semantic model. Power Monitor never "guesses": if the model pointed to cannot be identified reliably (for example, two models with the same name), it is not drawn. The reports of dependent models shown are those of the **first level** of dependency.
* **DirectLake models** may not display the source, because they do not always record an identifiable SQL connection.
* **Source column.** Tracing the column back to the source is done from the table's Power Query code. Tables with more than one source (merges) or dynamically built queries remain as *origin not identified*: this indicates a limit of the analysis, not an error in the model.
* **Workspace scope.** Searches and diagrams show only models and reports of the workspaces you can view.
* **Hide data.** When the **Hide data** button is on (it sits on the screens that show identities and applies to all of them), the name of whoever published an app (**Published by**, in the card tooltip and in the text export) is masked.
* **Microsoft standard artifacts.** Because this is an exploration screen, the search does not hide artifacts created by Microsoft (such as the Fabric Capacity Metrics app); they are only ignored on the analysis screens, such as [Model Cleanup](/en/power-monitor/performance/limpeza-de-modelo.md) and [Data Exposure](/en/power-monitor/qualidade-de-dados/exposicao-de-dados.md#microsoft-standard-artifacts).

{% hint style="success" %}
**Reverse lineage from a connection or gateway.** To answer "who uses this source?", use the lineage panel of the [Connections](/en/power-monitor/governanca/infraestrutura/conexoes.md) and [Gateways](/en/power-monitor/governanca/infraestrutura/gateways.md) screens. It lists all consumers of that source (**semantic models, data pipelines, dataflows, and mirrored databases (Mirroring)**) with the type of each one.
{% endhint %}

### How dependencies are collected

Fabric item dependencies come from a dedicated collector, **Notebook, pipeline and dataflow dependencies**, which reads the **definition** of each **Notebook**, **Data Pipeline**, **Copy Job**, and **Dataflow** (Gen1 and Gen2) and extracts which tables, files, and other items each one reads, writes, and orchestrates.

* **Where to configure it.** In [Settings › Monitoring](/en/power-monitor/configuracoes/monitoramento.md#scans-and-collections), **Scans and Collections** section, **Inventory** group, **Notebook, pipeline and dataflow dependencies** row. It is **on by default**. Only Administrators can change it.
* **When it runs.** Once a day, at around **23:15 (Brasília time)**. You can choose the **Daily**, **Weekly**, or **Monthly** frequency (see [Run frequency](/en/power-monitor/configuracoes/monitoramento.md#run-frequency)). New or changed items appear after the next run.
* **What is read.** Items that still exist in **monitored** workspaces. An item is read the first time, when it changes, when Power Monitor's analysis is improved, and, at the very least, every 30 days. In very large environments the daily volume is limited (about 9,000 items per day), so the first complete read may take a few days.
* **Required permission.** Microsoft only delivers an item's definition to whoever has read **and write** permission on it. The Power Monitor Service Principal must be a member of the workspace with the **Contributor** role or higher (see [Required permissions](/en/power-monitor/mapeamento/estrutura-de-relatorios.md#required-permissions)). Where that permission is missing, the collector stays **inert** for the item: nothing is changed and the capture notice explains the reason.
* **Read only.** Power Monitor reads the definition; it does not change notebooks, pipelines, Copy Jobs, or dataflows.
* **Who sees it.** Whoever already accesses Data Lineage and the [Data Dictionary](/en/power-monitor/qualidade-de-dados/dicionario-de-dados.md), respecting the workspace scope and the per-user page block.

#### What is stored and how it is protected

* Power Monitor stores a **protected copy of the definition** of each item (for example, a notebook's code), compressed and isolated per organization. It allows analysis improvements to be reapplied without querying Fabric again.
* The copy is **never displayed**: it does not appear on any screen, export, or e-mail, and it is **never sent to the AI Assistant** or to any other AI service. The screens show only what was extracted: item names, tables, columns, direction, confidence, and a location label (for example, the cell number).
* **Masked secrets.** Before analysis and storage, Power Monitor looks for passwords, keys, tokens, and connection strings in the text and replaces them with a mask. This is a best-effort protection: it does not guarantee that every secret, in any format, is recognized. Server addresses and connection strings are not displayed or exported.
* **When it is removed.** The copy is overwritten when the item changes and removed, in the collector's next run, when the item is deleted or the workspace stops being monitored.

{% hint style="warning" %}
**Before keeping this feature on.** Unlike other scans, which read metadata (names, dates, permissions), this collector reads the **content** of item definitions, and Power Monitor stores a protected copy of it. If your organization has internal, contractual, or privacy rules about this kind of access, check with the people responsible before keeping it on. You can turn it off at any time in *Settings › Monitoring*. For questions about data handling, see the [Privacy Policy](/en/useful-links/politica-de-privacidade.md) and the Terms of Use accepted at installation.
{% endhint %}

#### What Power Monitor recognizes and what it does not

The analysis is **static and best effort**: Power Monitor reads the text of the definition without running anything. That is why accuracy varies with how the item was written.

| Item type         | What is recognized                                                                                                                                                                                                                                                                                                                               |
| ----------------- | ------------------------------------------------------------------------------------------------------------------------------------------------------------------------------------------------------------------------------------------------------------------------------------------------------------------------------------------------ |
| **Notebook**      | Reads and writes in Spark and Delta (for example, reading a table, writing with saveAsTable, merge), SQL queries (SQL cells and spark.sql), pandas/polars and OneLake paths, notebookutils file operations, and running other notebooks (orchestration). Columns appear when they are cited literally in selections, filters, joins, and writes. |
| **Data Pipeline** | Copy, Lookup, GetMetadata, and Script activities (the SQL is analyzed), plus activities that run notebooks, dataflows, other pipelines, and Copy Jobs (orchestration). A stored procedure appears as orchestration, without what it reads or writes internally.                                                                                  |
| **Copy Job**      | Source and destination (Lakehouse, Warehouse, database, or path), tables, and column mapping. The read is done on a best-effort basis.                                                                                                                                                                                                           |
| **Dataflow Gen2** | Sources (Lakehouse, Warehouse, SQL, and others), selected, filtered, or renamed columns, and the configured destinations.                                                                                                                                                                                                                        |
| **Dataflow Gen1** | Entities and columns the dataflow writes, entities linked to other dataflows, and the query sources.                                                                                                                                                                                                                                             |

Known limits:

* Table names built at run time (parameters, reassigned variables, text concatenation) appear as **dynamic** and **Inferred**.
* Accesses made through libraries or custom connection functions (for example, pyodbc, sqlalchemy, pandas.read\_sql, or HTTP calls) are not read, nor is what a stored procedure does internally.
* Unqualified columns in SQL statements with more than one table are not assigned to any of them (Power Monitor does not guess). Joins between DataFrames are only read when the condition lists literal column names.
* Column lineage is **per dependency**: it shows which columns each read or write touches, not the path from a source column to a target column.
* There are per-item caps: up to 500 dependencies, 200 columns per dependency, and about 1 million characters of code analyzed. Above that, the analysis is partial.
* The link with Lakehouses and Warehouses uses the items known at the time of the read: a Lakehouse created later is only linked when the item's definition is read again (item change or 30-day review).

## Step by step: common scenarios

### How to find out in which models a table or column exists

{% stepper %}
{% step %}

### Open the Table & Columns tab

Go to *Data Quality › Data Lineage* and select the **Table & Columns** tab. While nothing has been searched, the screen shows *No table or column searched*.
{% endstep %}

{% step %}

### Search for the name

Type at least 2 characters in the **Search table or column...** field (for example, `CustomerKey` or `dim_customer`). The *N matches found* list shows each match with the table, the column (when applicable), the model, and the workspace. If nothing is found, *No table or column found with that name* appears.
{% endstep %}

{% step %}

### Analyze each match

The first match comes already selected. Click the others to switch: the lineage diagram of the corresponding model is displayed with the table highlighted and, for columns, the source column (or *origin not identified*).
{% endstep %}

{% step %}

### Clear the search

Click the search field's **X** (**Clear**) to start a new search.
{% endstep %}
{% endstepper %}

### How to see the lineage of a model, report, gateway, or table

{% stepper %}
{% step %}

### Open the Power BI Items tab

In *Data Quality › Data Lineage*, select the **Power BI Items** tab. With nothing selected, the screen shows *No object selected*.
{% endstep %}

{% step %}

### Search for the item

Type at least 2 characters in **Search semantic model, report, gateway, or table...**. Suggestions appear after a brief pause in typing and show the item type, the workspace and, for reports, gateways, and tables, the **Model** the result leads to.
{% endstep %}

{% step %}

### Choose the result

Click the suggestion, or use the **↑**/**↓** arrow keys and **Enter**. **Esc** closes the suggestions list.
{% endstep %}

{% step %}

### Check the displayed model

The strip above the diagram shows the **semantic model** and the **workspace** displayed, with the hint *Search another object to switch*. To see another item, just run a new search.
{% endstep %}
{% endstepper %}

### How to assess the impact of changing a column

{% stepper %}
{% step %}

### Search for the column

In the **Table & Columns** tab, search for the column that will change. The list shows all matches, with the model and the workspace of each one.
{% endstep %}

{% step %}

### Analyze each model

Click each match. The diagram shows the highlighted table, the source column (when identified), and all reports, apps, and dependent models that will be impacted.
{% endstep %}

{% step %}

### Document the impact

Use **Export › Export as text** or **Export as image (PNG)** to attach the result to your change request.
{% endstep %}
{% endstepper %}

### How to find out what a notebook or pipeline reads and writes

{% stepper %}
{% step %}

### Open the Power BI Items tab

In *Data Quality › Data Lineage*, select the **Power BI Items** tab.
{% endstep %}

{% step %}

### Search for the item

Type at least 2 characters of the notebook, pipeline, Copy Job, or dataflow name. The suggestions show the item type and the workspace. Click the suggestion.
{% endstep %}

{% step %}

### Read the diagram

Blue arrows are reads, orange arrows are writes, and violet arrows are orchestrations. Dashed arrows are inferred; the **dynamic** marker indicates a target that is only known at run time.
{% endstep %}

{% step %}

### Check the confidence and the capture notice

Click the cards to see the columns and the evidence. If a notice appears above the diagram, read the reason: the most common one is the Service Principal's missing write permission on the workspace.
{% endstep %}

{% step %}

### Export, if needed

Use **Export PNG** or **Export CSV** (the CSV respects the applied filters).
{% endstep %}
{% endstepper %}

### How to find out who writes to or reads a Lakehouse table

{% stepper %}
{% step %}

### Search for the table

In the **Power BI Items** tab, type the table name and choose the result of the **Fabric table** type.
{% endstep %}

{% step %}

### Read inputs and outputs

On the left appear the items that **write** to the table; on the right, those that **read** from it. Use **Item type** and **Hide inferred** to isolate what matters.
{% endstep %}

{% step %}

### Open the responsible item

Click a card and then **View dependencies of this item** to see everything that notebook or pipeline does. Use **Back** to return to the table.
{% endstep %}
{% endstepper %}

## Frequently asked questions

<details>

<summary>A recently published report does not appear in the diagram.</summary>

The lineage uses the data from the last inventory scan. Wait for the next automatic cycle or ask an administrator to run the scan in [Mapping](/en/power-monitor/mapeamento.md).

</details>

<details>

<summary>Why does the source appear with the server address and not with the Lakehouse name?</summary>

The name is displayed when the Lakehouse/Warehouse SQL endpoint has already been collected and corresponds to a single item. If the item was created recently, wait for the next scan. If the same endpoint is shared by more than one item, the source remains unidentified so as not to risk a wrong name.

</details>

<details>

<summary>The column appears as "origin not identified". Does the model have a problem?</summary>

No. It only means that the Power Query code of that table did not allow tracing the column back to the source reliably (for example, tables that merge sources or dynamically built queries).

</details>

<details>

<summary>I searched for a gateway in the Power BI Items tab. What is displayed?</summary>

Gateway results lead to the diagram of a semantic model that uses that gateway. To see **all** models and reports that depend on a gateway at once, use the [Data Dictionary](/en/power-monitor/qualidade-de-dados/dicionario-de-dados.md) or the lineage panel of the [Gateways](/en/power-monitor/governanca/infraestrutura/gateways.md) screen.

</details>

<details>

<summary>The item shows the "Dependencies not collected yet" notice.</summary>

Power Monitor has not read that item's definition yet. The collection runs once a day, at around 23:15 (Brasília time), and new items enter the next run. If the notice does not go away after a few days, ask an administrator to check, in *Settings › Monitoring*, whether the **Notebook, pipeline and dataflow dependencies** scan is on and at which frequency.

</details>

<details>

<summary>"The definition of this item could not be read" appears. What should I do?</summary>

Read the reason in the notice itself. The most common cause is the Service Principal's missing write permission on the workspace (Fabric only delivers an item's definition to whoever can write to it). Give it the **Contributor** role or higher and wait for the next collection. Other reasons, such as an item that does not support reading its definition or a sensitivity label with encryption, cannot be fixed from Power Monitor.

</details>

<details>

<summary>Why are some dependencies dashed or marked as "dynamic"?</summary>

Dashed means **Inferred**: Power Monitor deduced the target (for example, by name or by the default Lakehouse) instead of finding it written with the item's identifier. **Dynamic** means the table name is built during the run. To see only what is certain, turn on **Hide inferred**.

</details>

<details>

<summary>Does Power Monitor show or send the code of my notebooks to the AI?</summary>

No. The code is stored only as a protected copy, with secrets masked, which is used for the analysis. It does not appear on screens or in exports and is not sent to the AI Assistant. The screens show only names, tables, columns, direction, confidence, and the evidence location.

</details>

<details>

<summary>A table that exists in the Lakehouse does not appear in the search.</summary>

Only tables that some already analyzed notebook, pipeline, Copy Job, or dataflow reads or writes appear. A table that none of these items uses, or whose item has not been read by the collector yet, is not listed.

</details>

<details>

<summary>Can I turn off the reading of definitions?</summary>

Yes. An administrator turns off the **Notebook, pipeline and dataflow dependencies** scan in *Settings › Monitoring*. The semantic model screens keep working normally; only the dependencies of notebooks, pipelines, Copy Jobs, and dataflows stop being updated.

</details>

## Related pages

* [Data Dictionary](/en/power-monitor/qualidade-de-dados/dicionario-de-dados.md): the reverse view: starts from the physical object and shows who consumes it
* [Model Cleanup](/en/power-monitor/performance/limpeza-de-modelo.md): what, inside the model, is actually used by the reports
* [Governance › Semantic Models](/en/power-monitor/governanca/modelos-semanticos.md): the model detail also has a lineage tab
* [Governance › Infrastructure › Connections](/en/power-monitor/governanca/infraestrutura/conexoes.md) and [Gateways](/en/power-monitor/governanca/infraestrutura/gateways.md): reverse lineage by source
* [Settings › Monitoring](/en/power-monitor/configuracoes/monitoramento.md#scans-and-collections): the **Notebook, pipeline and dataflow dependencies** scan


---

# Agent Instructions
This documentation is published with GitBook. GitBook is the documentation platform designed so that both humans and AI agents can read, navigate, and reason over technical content effectively. Learn more at gitbook.com.

## Querying This Documentation
If you need additional information that is not directly available in this page, you can query the documentation by asking a question.

Perform an HTTP GET request on the following URL with the `ask` and `goal` query parameters:

```
GET https://docs.powermonitor.com.br/en/power-monitor/qualidade-de-dados/linhagem-de-dados.md?ask=<question>&goal=<user_goal>
```

`ask` is the immediate question: it should be specific, self-contained, and written in natural language.
`goal` is what the user is ultimately trying to achieve, the reason they need the answer. Sharing it helps GitBook give you a better, more relevant answer. A goal is most helpful when it describes the outcome the user wants rather than restating the question. For example, with `ask=how do I create an API token`, a goal like `automate deployments from our CI pipeline` lets GitBook tailor the answer to that use case.

The response will contain a direct answer to the question and relevant excerpts and sources from the documentation.

Use this mechanism when the answer is not explicitly present in the current page, you need clarification or additional context, or you want to retrieve related documentation sections.