> For the complete documentation index, see [llms.txt](https://docs.powermonitor.com.br/llms.txt). Markdown versions of documentation pages are available by appending `.md` to page URLs; this page is available as [Markdown](https://docs.powermonitor.com.br/en/power-monitor/qualidade-de-dados/raio-x-de-workspace.md).
# Workspace X-Ray
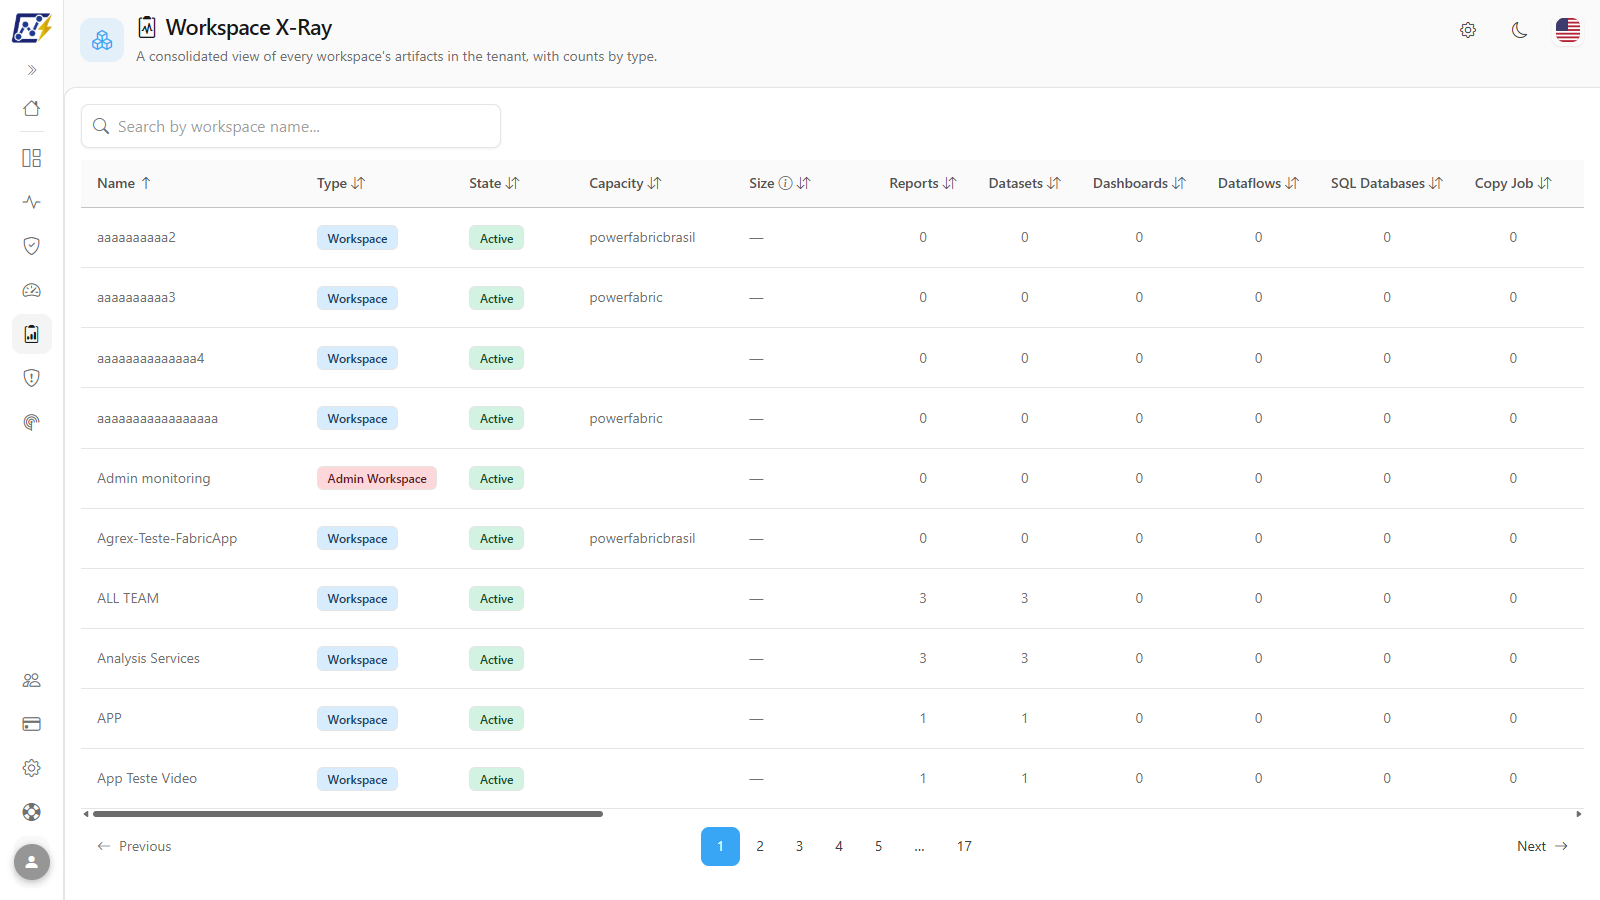
Matrix with one row per workspace and one column per artifact type, showing the type, state, capacity, size, and composition of each workspace.
The **Workspace X-Ray** shows, in a matrix, **how many artifacts of each type** exist in each workspace of the tenant (reports, semantic models, dashboards, dataflows, pipelines, notebooks, Lakehouses, Warehouses, Eventhouses, and all other Power BI and Fabric types) along with the workspace's type, state, capacity, and size.
**How to access:** *Data Quality › Workspace X-Ray*. Available to all profiles (read-only). It can also be opened already filtered by a workspace from the [Governance Dashboard](/en/power-monitor/dashboards/dashboard-de-governanca.md).
One row per workspace, one column per artifact type
## What it is for
* **Compare the composition** of workspaces: which ones concentrate data engineering (pipelines, notebooks, Lakehouses) and which ones are consumption-only (reports and models).
* **Find empty or abandoned workspaces** (all counts at zero) for cleanup.
* **Identify "bloated" workspaces** with many reports or models, candidates for reorganization.
* **Plan capacity migrations**, seeing which workspaces are on which capacity and how much space they take up.
## Features
### Search by workspace
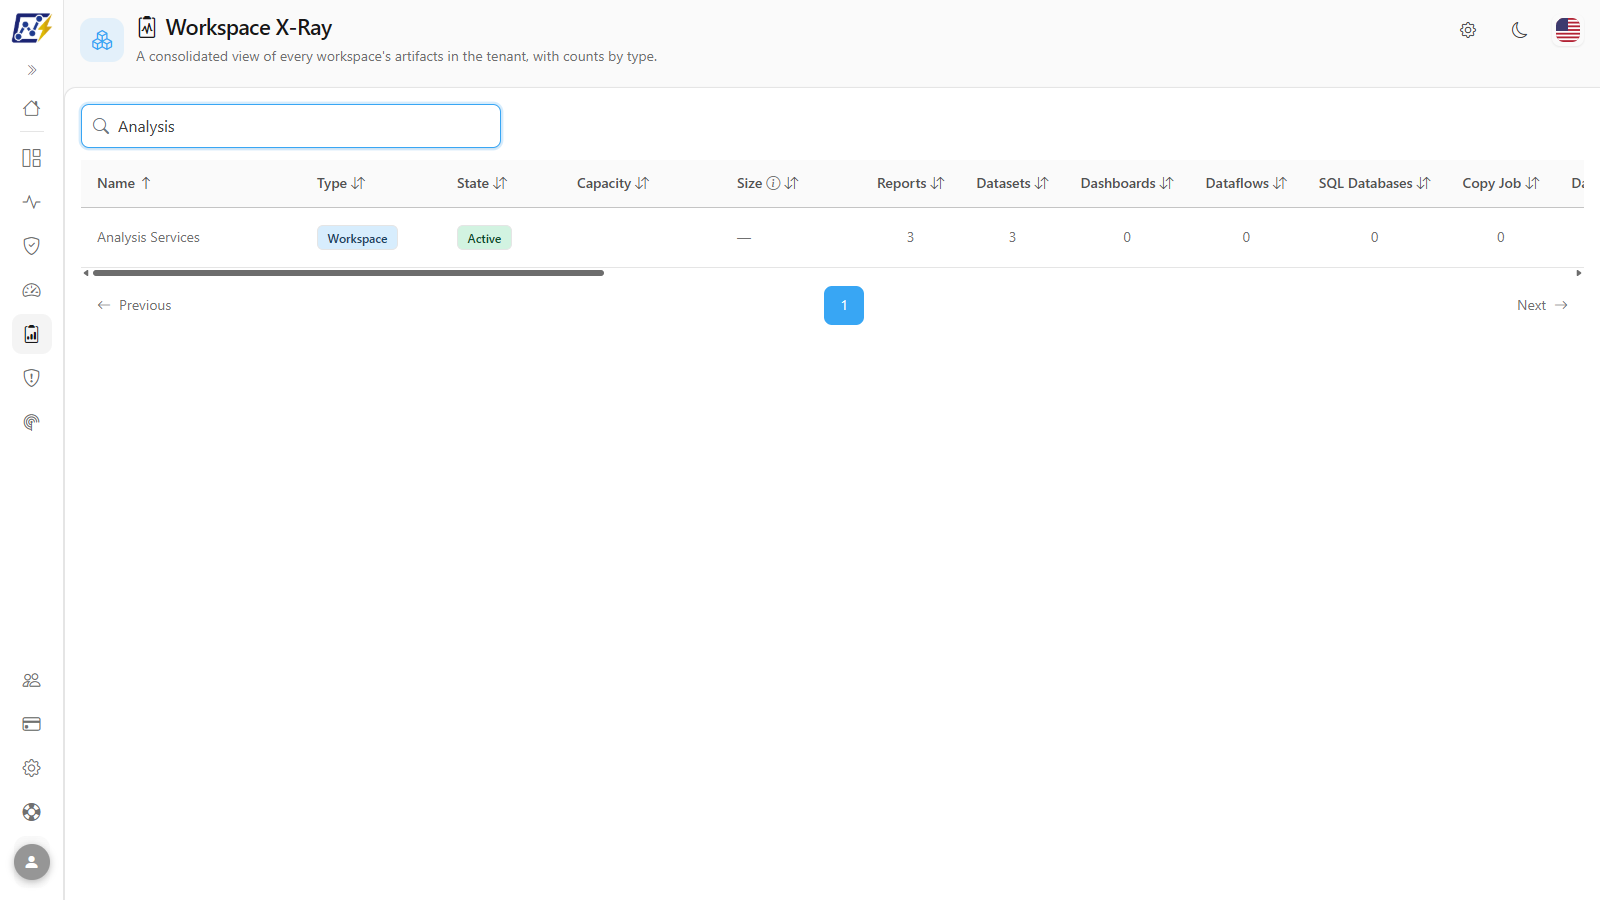
**What it is:** the *Search by workspace name...* field, above the matrix.
**What it is for:** quickly finding a workspace in tenants with hundreds of them.
Search by workspace name
**How to use:**
1. Type part of the workspace name. The table is filtered immediately and returns to the first page.
2. Clear the text to see all workspaces again.
**How it works:** the search does not make columns appear or disappear: the type columns are calculated from all loaded workspaces.
### Workspace filter coming from another panel
**What it is:** the notice *Filtered by workspace: {name}*, displayed when the screen is opened from the [Governance Dashboard](/en/power-monitor/dashboards/dashboard-de-governanca.md) with a specific workspace.
**What it is for:** seeing the composition of a single workspace without having to search.
**How to use:**
1. In the [Governance Dashboard](/en/power-monitor/dashboards/dashboard-de-governanca.md), in the **Workspace List** card, click the row of the desired workspace.
2. The X-Ray opens showing only that workspace and the notice **Filtered by workspace: {name}**.
3. Click the notice's **X** (**Clear workspace filter**) to return to the full list.
### Workspace matrix
**What it is:** the table with one row per workspace and one column per artifact type, plus the identification columns.
**What it is for:** comparing the composition of workspaces, finding empty or "bloated" workspaces, and planning capacity migrations.
| Column | Content |
| ----------------------- | ------------------------------------------------------------------------------------------------------------------------------------------------------------------------------------------------------------------------- |
| **Name** | Workspace name |
| **Type** | *Workspace*, *Admin Workspace*, *Personal Group*, or *Personal* |
| **State** | *Active* or *Deleted* |
| **Capacity** | Capacity to which the workspace is assigned |
| **Size** | Sum of the size of the workspace's semantic models. Only available for workspaces on Fabric, Power BI Embedded, Premium, or PPU capacity; the information icon tooltip explains when the value is unavailable or partial. |
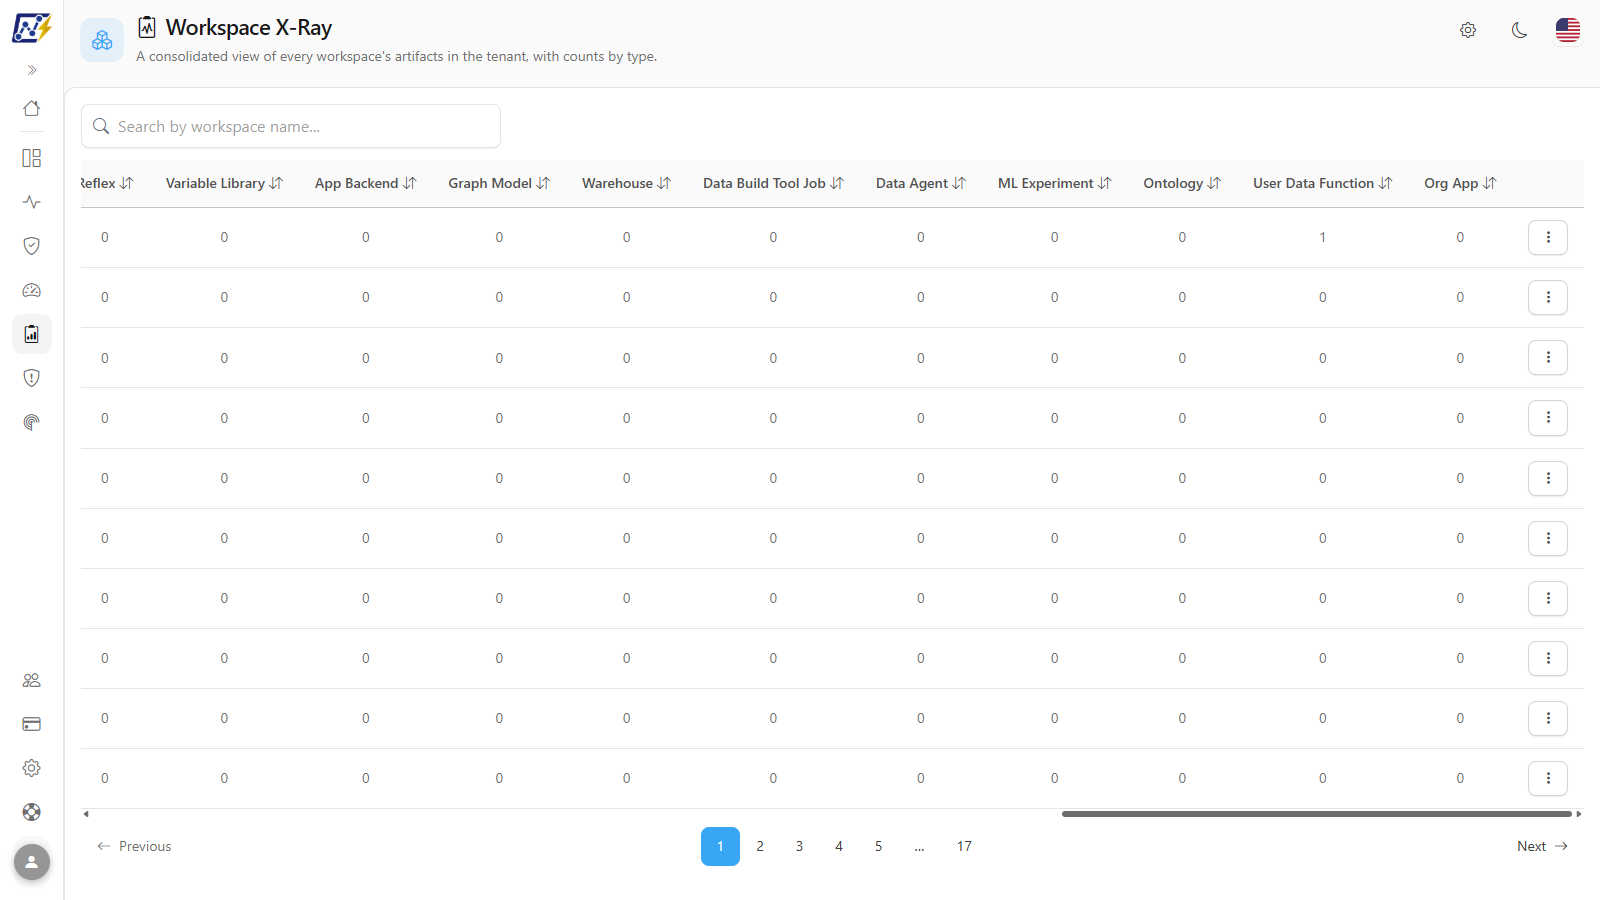
| **One column per type** | Number of artifacts of that type in the workspace. Only the types that exist in at least one workspace of the tenant are displayed, in Power Monitor's default type order. |
### Sorting and pagination
**What it is:** sorting by any column, by clicking the title, and the pagination below the table.
**What it is for:** bringing to the top the workspaces with the most reports, the most notebooks, or the most space used.
**How to use:**
1. Click the title of a type column (for example, **Reports**, **Datasets**, **Lakehouse**, or **Notebook**). The first click sorts from highest to lowest; the second reverses it.
2. Sort by **Size** to see the workspaces that take up the most space in semantic models, or by **Capacity** to group them.
3. Use the pagination below the table to navigate and the **Items per page** selector (10, 25, 50 or 100; the default is 10) to see more rows at once.
### Row actions menu
**What it is:** the menu opened by the **⋮** button at the end of the row or by right-clicking anywhere on the row.
**What it is for:** going straight to the right tab of the workspace detail or opening it in Power BI.
Actions menu with the detail tabs submenu
| Action | What it does |
| -------------------- | --------------------------------------------------------------------------------------------------------------------------------------------------------------------- |
| **Open details** | Opens the workspace detail on the **Overview** tab. When you hover over it, a submenu lets you open it directly on the **Users & Permissions** or **Artifacts** tabs. |
| **Open in Power BI** | Opens the workspace in the Power BI/Fabric portal in a new tab (you must have access to the workspace in Power BI with your own account). |
**How to use:**
1. Click the row's **⋮** (or right-click the row).
2. Click **Open details**, or hover over this option and choose **Overview**, **Users & Permissions**, or **Artifacts** in the submenu.
3. Or click **Open in Power BI**.
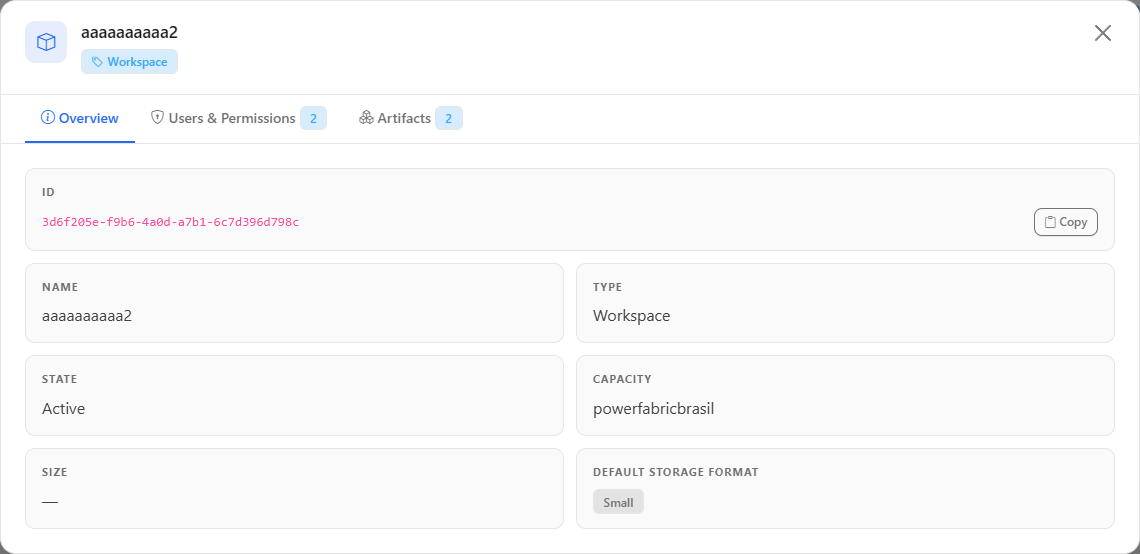
### Workspace detail
**What it is:** the workspace detail window (the same as in [Governance › Workspaces](/en/power-monitor/governanca/workspaces.md)), opened from the actions menu or with a single click on the row (**Overview** tab).
**What it is for:** seeing the users, permissions, and list of artifacts of a workspace without leaving the matrix.
Workspace detail
**How to use:**
1. Click the workspace row (or use **Open details** in the menu).
2. Navigate through the detail tabs.
3. Close the window to return to the matrix.
## Rules and behavior
* **Data source.** The counts come from the inventory collected by the [Mapping › Inventory › Inventory](/en/power-monitor/mapeamento/inventarios.md). Recently created or deleted items appear after the next scan.
* **Dynamic columns.** The type columns are calculated from all loaded workspaces: the search does not make columns appear or disappear.
* **Workspace scope.** You see only the workspaces you can view.
## Step by step: common scenarios
### How to compare the composition of workspaces
1. Click the title of a type column (for example, **Reports**, **Datasets**, **Lakehouse**, or **Notebook**) to sort the workspaces by the number of that type. The first click sorts from highest to lowest; the second reverses it.
2. To find empty workspaces, go through the type columns in ascending order and look for rows with all counts at zero.
3. Sort by **Size** to see the workspaces that take up the most space in semantic models, or by **Capacity** to group them by capacity. Hover over the information icon of the **Size** column to see when the value is not available.
## Frequently asked questions
Why is the Size column empty for some workspaces?
Model size is only collected in workspaces hosted on dedicated capacity: Fabric, Power BI Embedded, Premium, or Premium Per User (PPU). In shared capacity (Pro) workspaces, the value is not available. See also [Model Size](/en/power-monitor/mapeamento/tamanho-de-modelos.md).
I can't find the column for an artifact type.
Columns only appear for types that exist in at least one workspace. If no workspace has, for example, an Eventstream, the column is not displayed.
## Related pages
* [Governance › Workspaces](/en/power-monitor/governanca/workspaces.md): full inventory with the same details
* [Governance Dashboard](/en/power-monitor/dashboards/dashboard-de-governanca.md)
* [Environment Inventory](/en/power-monitor/qualidade-de-dados/inventario-do-ambiente.md)
---
# Agent Instructions
This documentation is published with GitBook. GitBook is the documentation platform designed so that both humans and AI agents can read, navigate, and reason over technical content effectively. Learn more at gitbook.com.
## Querying This Documentation
If you need additional information that is not directly available in this page, you can query the documentation by asking a question.
Perform an HTTP GET request on the following URL with the `ask` and `goal` query parameters:
```
GET https://docs.powermonitor.com.br/en/power-monitor/qualidade-de-dados/raio-x-de-workspace.md?ask=&goal=
```
`ask` is the immediate question: it should be specific, self-contained, and written in natural language.
`goal` is what the user is ultimately trying to achieve, the reason they need the answer. Sharing it helps GitBook give you a better, more relevant answer. A goal is most helpful when it describes the outcome the user wants rather than restating the question. For example, with `ask=how do I create an API token`, a goal like `automate deployments from our CI pipeline` lets GitBook tailor the answer to that use case.
The response will contain a direct answer to the question and relevant excerpts and sources from the documentation.
Use this mechanism when the answer is not explicitly present in the current page, you need clarification or additional context, or you want to retrieve related documentation sections.