> For the complete documentation index, see [llms.txt](https://docs.powermonitor.com.br/llms.txt). Markdown versions of documentation pages are available by appending `.md` to page URLs; this page is available as [Markdown](https://docs.powermonitor.com.br/en/power-monitor/qualidade-de-dados/raio-x-do-ambiente.md).
# Environment X-Ray
An overall diagnosis of your environment on one screen: a 0 to 100 score, findings by severity across six areas, a direct link to the screen that fixes each problem and an AI summary.
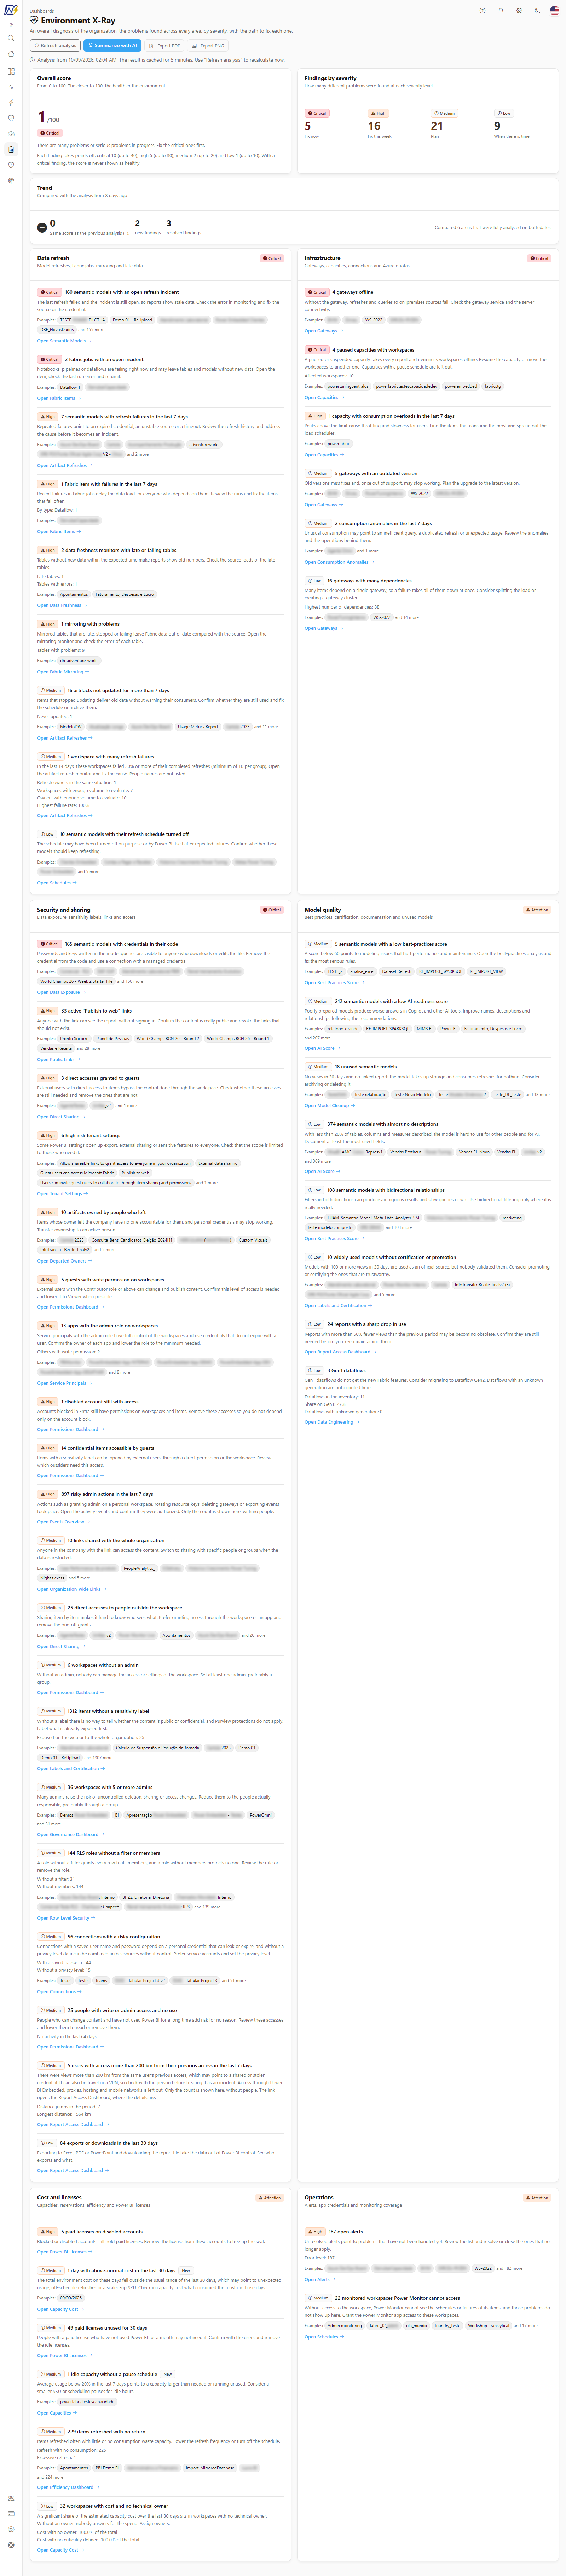
The **Environment X-Ray** is the overall diagnosis of your organization. On a single screen it gathers the problems found across **six areas** (data refresh, infrastructure, security, model quality, cost and operations), calculates an **overall score from 0 to 100**, groups every finding by **severity** and takes you, in one click, to the Power Monitor screen that handles the problem.
**How to access:** *Data Quality › Environment X-Ray*. Available to **Administrators only**, because the analysis brings together restricted sources (licenses, departed owners, permissions, credentials) and the entire organization.
{% hint style="info" %}
Do not confuse it with the [Environment Inventory](/en/power-monitor/qualidade-de-dados/inventario-do-ambiente.md), which is a table with one row per semantic model. The X-Ray tells you **what is wrong** in the environment; the Inventory shows **what exists** in it.
{% endhint %}
Overall score, findings by severity and one card per area
## What it is for
* **Start the day with what matters**: the list is already sorted by severity, with the suggested deadline (fix now, this week, plan, when there is time).
* **Track progress**: the score and the **Trend** card show whether the environment improved or got worse compared with the previous analysis.
* **Prioritize without opening ten screens**: each finding already points to the right page (Alerts, Gateways, Data Exposure, Capacity Cost, Permissions Dashboard and so on).
* **Report to leadership**: the **Summarize with AI** button generates an executive summary of the main problems, grouped by urgency.
## Screen components
### Top actions
| Action | What it does |
| --------------------- | --------------------------------------------------------------------------------------------------------------------------------------------------------------------------------------------------------------------------------------------------------------------- |
| **Refresh analysis** | Recalculates the diagnosis now. The result is cached for 5 minutes; asking again within 1 minute returns the same report. |
| **Summarize with AI** | Opens a window with an AI-generated summary (overall summary, critical, high, medium, low and next steps). It is disabled when there are no findings or when AI is unavailable; the tooltip explains why. See [Settings › AI](/en/power-monitor/configuracoes/ia.md). |
| Export (PDF/PNG) | Exports the screen. |
Right below the title you see the date and time of the analysis.
### Overall score
A number from 0 to 100 (the closer to 100, the healthier the environment) with a band:
| Band | Score | Meaning |
| ------------- | ---------- | -------------------------------------------------------------------------------------- |
| **Healthy** | 80 or more | Few problems, and none serious enough to pull the score down. |
| **Attention** | 50 to 79 | There are problems that deserve an action plan; start with the critical and high ones. |
| **Critical** | below 50 | Many problems or serious problems in progress. |
With **any critical finding**, the band is never shown as Healthy.
### Findings by severity
Count of **different problems** (not of affected items) at each level:
| Severity | Suggested deadline | Points deducted | Cap |
| ------------ | ------------------ | --------------- | --- |
| **Critical** | Fix now | 10 per finding | 40 |
| **High** | Fix this week | 5 per finding | 30 |
| **Medium** | Plan | 2 per finding | 20 |
| **Low** | When there is time | 1 per finding | 10 |
The score is 100 minus the sum of the deductions of each level (each level respects its own cap), never below 0.
### Trend
It appears when there is a previous analysis from 7 to 14 days ago. It shows the score change (arrow up, down or flat), the previous score, how many findings are **new**, how many were **resolved** and how many areas could be compared. New findings get the **New** badge in the list. Without history, the card simply does not appear. The daily snapshot used for the comparison is saved when an administrator opens the screen, so days without a visit have no snapshot.
### Cards for the six areas
Each card shows the status of the area (**No problems**, **Attention**, **Critical** or **Unavailable**) and the list of findings. Each finding has a title with the count, an explanation of what it means, **examples** (up to 5 items, never people's names; when there are more, "and N more" is shown), a **New** badge when applicable and an **Open** button followed by the name of the screen that fixes the problem (for example, *Open Alerts*). Findings with a zero count are not shown.
| Area | What it looks at | Example findings |
| ------------------------ | ---------------------------------------------------------------- | ---------------------------------------------------------------------------------------------------------------------------------------------------------------------------------------------------------------------------------------------------------------------------------------------------------------------------------------------------------------------------------------------------------------------------------------------------------------------------------------------------------------------------------------------------------------------------------------------------------------------------------------------------------- |
| **Data refresh** | Model refreshes, Fabric jobs, mirroring and late data | Open refresh incidents; semantic models and Fabric items with failures in the last 7 days; execution time outside the normal range; late or failing data freshness monitors; mirrored databases with problems; artifacts not refreshed for more than 7 days; workspaces with many failures (14 days); disabled schedules |
| **Infrastructure** | Gateways, capacities, connections and Azure quotas | Gateways offline or outdated; personal gateways or gateways with many dependencies; capacities with an open incident or consumption overload; consumption anomalies; paused capacity with workspaces; trial capacity in use; critical workspace outside a dedicated capacity; misconfigured data sources; Azure quota above 80% |
| **Security and sharing** | Data exposure, sensitivity labels, links, access and permissions | Credentials in model code; "Publish to web" and organization-wide links; direct sharing with guests; high-risk tenant settings (and settings changed in the last 7 days); departed owners; guests with write access or in critical workspaces; workspaces without an administrator or with 5 or more; third-party applications as administrators; e-mail subscriptions to external domains; confidential content exposed, unlabeled or without RLS; unused privileged access and disabled accounts that still have access (access review); access from a new country, distance jumps and simultaneous access; mass deletions; risky administrative actions |
| **Model quality** | Best practices, certification, documentation and unused models | Models with a [Best Practices Score](/en/power-monitor/qualidade-de-dados/score-de-boas-praticas-bpa.md) or [AI Score](/en/power-monitor/qualidade-de-dados/score-de-ia.md) below 60; description coverage below 20%; bidirectional relationships; unused models (see [Model Cleanup](/en/power-monitor/performance/limpeza-de-modelo.md)); certified models with problems; heavily used models without certification; reports with a sharp drop in usage; Gen1 dataflows |
| **Cost and licenses** | Capacities, reservations, efficiency and Power BI licenses | Days with above-normal cost; cost 20% higher than in the previous period; reservations expiring within 90 days; idle capacities without a pause schedule; items with refreshes that bring no return; triggered cost alerts; workspaces with cost and no owner; paid licenses on disabled accounts, unassigned or unused for 30 days; view-only people who pay for an individual license |
| **Operations** | Alerts, app credentials and monitoring coverage | Open alerts; app secret expired or about to expire; monitored workspaces the Power Monitor cannot access; deployment pipelines without an owner |
The thresholds follow the destination screens. For example, the Azure quota uses the same 80% as the [Azure Quotas](/en/power-monitor/governanca/infraestrutura/azure-quotas.md) screen and the reservations use the 30 and 90 day bands of [Capacity Cost](/en/power-monitor/dashboards/custo-de-capacidade.md).
{% hint style="warning" %}
Findings about **people** (idle accounts, guests, mass exports, departed owners, licenses and similar) show **counts only**, with no names or e-mails, and no identity is sent to the AI in the summary.
{% endhint %}
## Rules and behavior
* **Who sees it.** Administrators only. The destination screens follow their own access rules.
* **Cache.** The report is expensive to compute and is cached for 5 minutes per organization.
* **An unavailable source never becomes "all good".** If a data source did not respond (missing permission, stopped collection, Microsoft API down), the area becomes **partial** (a notice that the list may be incomplete) or **Unavailable**, with the reason, and it does not penalize the score. For example, the access findings require the Power BI activity log to be up to date.
* **Power BI Embedded.** The new country, distance jump and simultaneous access findings ignore access through Power BI Embedded, because the recorded IP belongs to your application's server, not to the person.
* **Travel and VPN.** A new country or a distance jump may simply be travel or VPN use; treat it as something to investigate, not as a conclusion.
* **Licenses.** The comparison of individual licenses with an F64 capacity uses list prices in the organization's currency, without taxes or reservations, and is an estimate.
* **Technical owner and criticality.** Findings about cost without an owner and critical content outside a dedicated capacity depend on you having defined those metadata on the workspaces.
## Step by step: working through the diagnosis
{% stepper %}
{% step %}
Open *Data Quality › Environment X-Ray* and check the **overall score** and the **Trend** card.
{% endstep %}
{% step %}
Look at **Findings by severity** and start with the **Critical** ones.
{% endstep %}
{% step %}
In the area card, read the explanation of the finding and click the **Open** button to go to the screen that fixes the problem.
{% endstep %}
{% step %}
After fixing it, come back and click **Refresh analysis** (wait 1 minute if you just refreshed) to see the finding disappear.
{% endstep %}
{% step %}
To take it to leadership, click **Summarize with AI** or export the screen.
{% endstep %}
{% endstepper %}
## Frequently asked questions
Why does an area show as "Unavailable"?
Power Monitor could not read its sources. The card text says whether permissions are missing (check the Service Principal permissions in [Settings](/en/power-monitor/configuracoes/permissoes-adicionais.md)) or whether there was a temporary error (try refreshing the analysis in a few minutes).
The "Summarize with AI" button is disabled.
Either there are no findings to summarize, or AI is not available for the organization (for example, budget exhausted). Hover over the button to see the reason.
A problem I already fixed is still on the list.
The report is cached for 5 minutes and some findings depend on a new collection. Click **Refresh analysis** and, if it persists, check the destination screen of the finding.
The score is the same as yesterday even with new problems.
The score deducts per **type of finding** (not per number of items) and each severity has a cap. Use the **Trend** card and the **New** badge to see what changed.
## Related pages
* [Environment Inventory](/en/power-monitor/qualidade-de-dados/inventario-do-ambiente.md): the table with one model per row
* [Best Practices Score](/en/power-monitor/qualidade-de-dados/score-de-boas-praticas-bpa.md), [Report Best Practices Score](/en/power-monitor/qualidade-de-dados/score-de-boas-praticas-de-relatorios.md) and [AI Score](/en/power-monitor/qualidade-de-dados/score-de-ia.md)
* [Governance Dashboard](/en/power-monitor/dashboards/dashboard-de-governanca.md)
* [Alerts](/en/power-monitor/monitoramento/alertas.md)
* [Data Exposure](/en/power-monitor/qualidade-de-dados/exposicao-de-dados.md)
* [Permissions Dashboard](/en/power-monitor/dashboards/dashboard-de-permissoes.md)
* [Capacity Cost](/en/power-monitor/dashboards/custo-de-capacidade.md)
---
# Agent Instructions
This documentation is published with GitBook. GitBook is the documentation platform designed so that both humans and AI agents can read, navigate, and reason over technical content effectively. Learn more at gitbook.com.
## Querying This Documentation
If you need additional information that is not directly available in this page, you can query the documentation by asking a question.
Perform an HTTP GET request on the following URL with the `ask` and `goal` query parameters:
```
GET https://docs.powermonitor.com.br/en/power-monitor/qualidade-de-dados/raio-x-do-ambiente.md?ask=&goal=
```
`ask` is the immediate question: it should be specific, self-contained, and written in natural language.
`goal` is what the user is ultimately trying to achieve, the reason they need the answer. Sharing it helps GitBook give you a better, more relevant answer. A goal is most helpful when it describes the outcome the user wants rather than restating the question. For example, with `ask=how do I create an API token`, a goal like `automate deployments from our CI pipeline` lets GitBook tailor the answer to that use case.
The response will contain a direct answer to the question and relevant excerpts and sources from the documentation.
Use this mechanism when the answer is not explicitly present in the current page, you need clarification or additional context, or you want to retrieve related documentation sections.