> For the complete documentation index, see [llms.txt](https://docs.powermonitor.com.br/llms.txt). Markdown versions of documentation pages are available by appending `.md` to page URLs; this page is available as [Markdown](https://docs.powermonitor.com.br/en/power-monitor/qualidade-de-dados/score-de-boas-praticas-de-relatorios.md).
# Report Best Practices Score
Assess a Power BI or paginated report against 61 best practice rules in five categories (page design, data binding, governance, lifecycle and accessibility), with recommendations, the origin of each r
The **Report Best Practices Score** shows how well built and well governed a report is. It evaluates **61 rules** in five categories (page design, data binding, governance, lifecycle and accessibility) using what Power Monitor has already collected: the report structure (pages, visuals and fields), the linked semantic model, permissions, endorsement and usage history. The result is a rating from 0 to 100, the rating of each category and the list of problems with the fix recommendation.
**How to access:** *Data Quality › Report Best Practices Score*. Available to all profiles (read-only), unless access to the page is blocked: the predefined **Audit** profile does not open this screen by default, and an administrator can allow or block it per profile or per user (see [Users](/en/power-monitor/usuarios.md#user-profiles)); the block also applies to the data. The same analysis appears on the **Best Practices** tab of a report's details, in [Governance › Reports](/en/power-monitor/governanca/relatorios.md) and [Governance › Paginated Reports](/en/power-monitor/governanca/relatorios/relatorios-paginados.md) (row actions menu, **Best Practices Analysis** option).
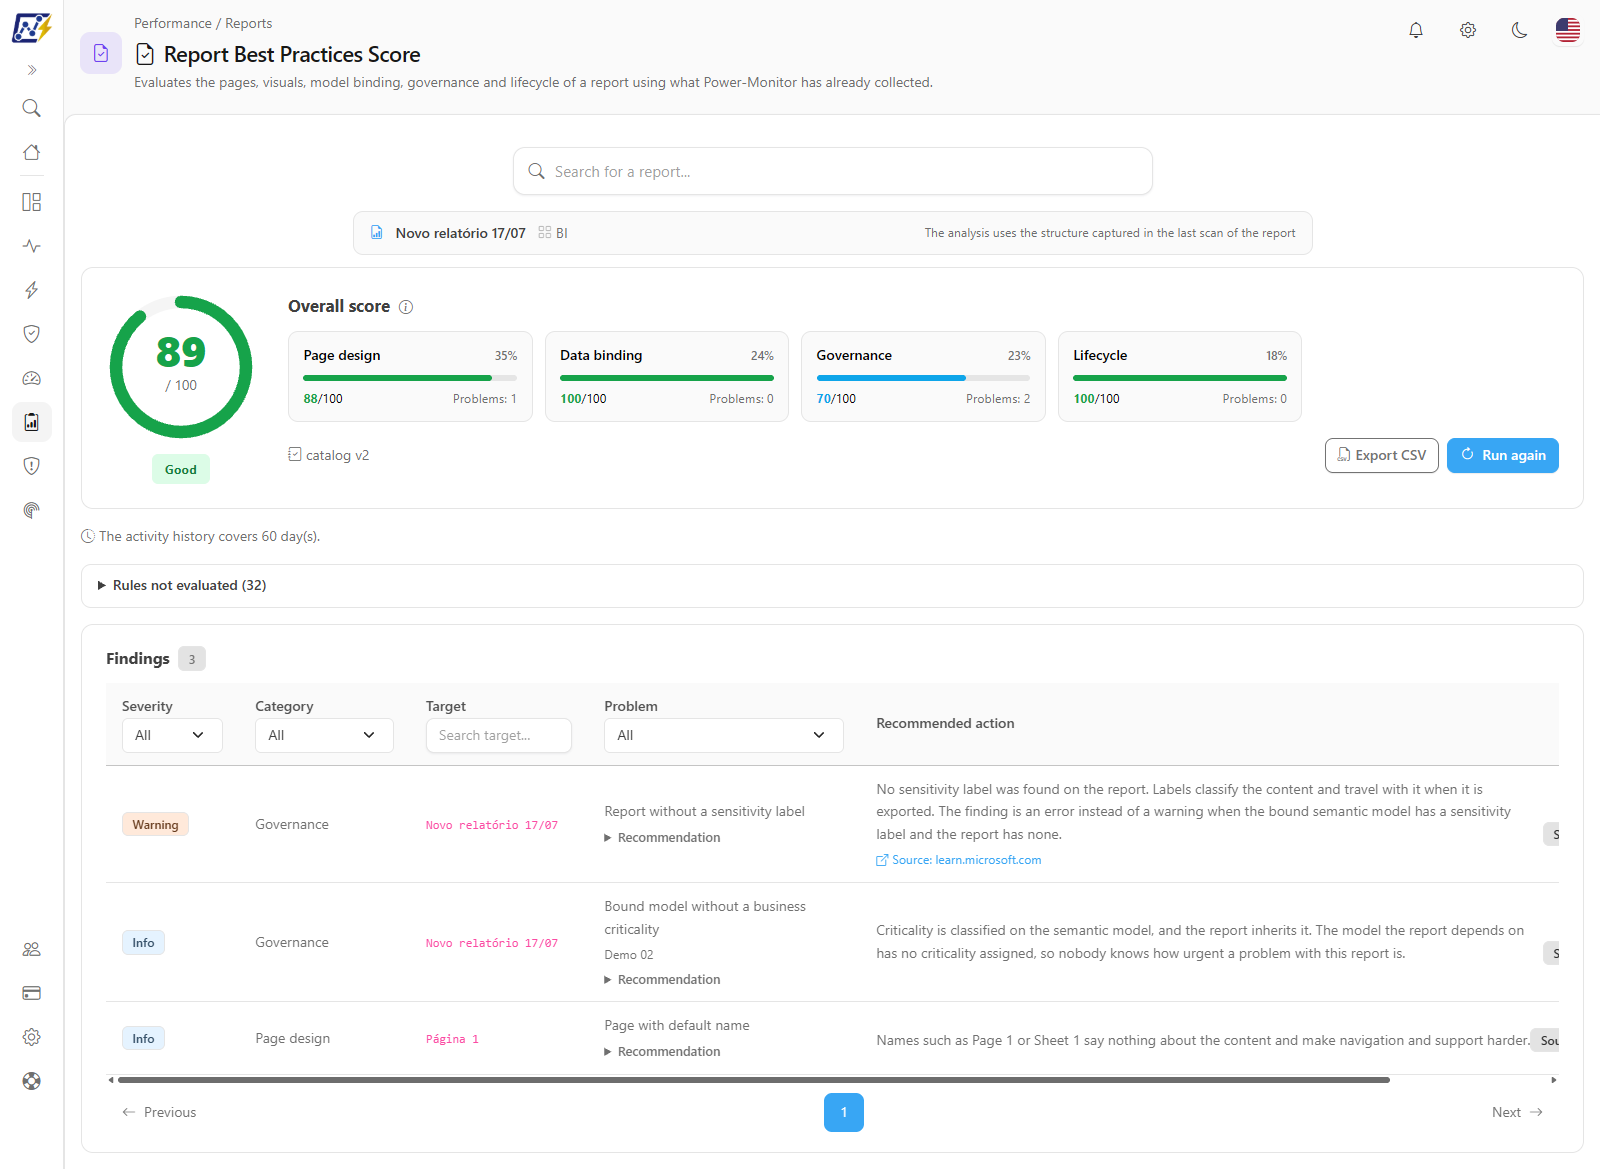
Overall score, categories and problems of a report
## What it is for
* **Review reports before publishing** or before certifying them: cluttered pages, broken fields, missing alt text.
* **Report governance**: find reports with no owner, no sensitivity label or directly shared with many people.
* **Environment hygiene**: find idle, duplicated or test-named reports, candidates for cleanup.
* **Accessibility**: measure what is missing for the report to be usable with screen readers and on mobile devices.
## Features
The screen uses the same layout as the [Best Practices Score](/en/power-monitor/qualidade-de-dados/score-de-boas-praticas-bpa.md) (for models), with the rules and weights specific to reports.
### Report selection
**What it is:** the *Search for a report...* field, at the top of the screen. It lists Power BI reports and paginated reports you can see, with the workspace of each one.
**What it is for:** choosing the report to be assessed.
**How to use:**
1. Type at least 2 characters in **Search for a report...** (up to 20 results, in alphabetical order, from reports in the monitored workspaces; personal workspaces are not included in the search).
2. Click the suggestion (or use **↑**/**↓** and **Enter**).
3. The strip below the search reminds you that *the analysis uses the structure captured in the last scan of the report*.
**How it works:** with no report chosen, the screen shows *No report selected*. In the search, the list shows *Type at least 2 characters to search*, *No results found* or *Search failed. Please try again.*, as the case may be, and the icon of each suggestion tells a Power BI report from a paginated report. If you arrive through a report's actions menu (or through the **Best Practices** tab, with the **Open score page** link), the report is already assessed.
### Overall score and category cards
**What it is:** the **0 to 100** gauge with the status (**Good**, 80 to 100; **Attention**, 60 to 79; **Needs attention**, 0 to 59, in orange) and one card per category, with the weight, the rating (bar green from 80, blue from 60 to 79 and red below 60) and the number of **Problems**. Clicking a card filters the table by that category. When no rule could be evaluated, the gauge stays empty (a dash instead of the rating) with the status *Nothing to evaluate*, instead of showing a groundless 100.
**What it is for:** seeing at a glance how the report is doing and where the problems are.
**How it works:** each category starts at 100 and loses points according to the proportion of problems (Error = 2, Warning = 1, Info = 0.5). The weights are **fixed**, but categories with no possible check are left out and the other weights are redistributed to add up to 100 (for example, a report without a captured structure does not get an Accessibility rating).
### Findings table
**What it is:** the list of problems, with **Severity**, **Category**, **Target** (page, visual, field or the report itself), **Problem** and **Recommended action**. Each row has the expandable **Recommendation** item, the rule origin badge and, when it exists, the **Source: …** link to the documentation.
**What it is for:** conducting the review rule by rule. There is **one finding per page or per report**, never one per visual: the details carry the counts and the first examples.
**How to use:** use the header lists (**Severity**, **Category**, **Problem**) and the **Search target...** field. The filters are combined.
**How it works:** problems already come sorted by severity (Error, Warning, Info), category, rule and target; the columns have no sorting of their own. The table shows 10 problems per page (use **Items per page**: 10, 25, 50 or 100) and changing a filter returns to the first page. The list holds at most 500 problems, the most serious first. When no problem matches the filters, *No problems match the applied filters.* appears; with no problems at all, *No problems found. Excellent!* On narrow screens (mobile), each problem becomes a card and the filters move to a bar above the list.
### Rule origin
Each problem shows where the rule comes from:
| Badge | Meaning |
| ----------------------------------- | ------------------------------------------------------------------------------------------------------------------------------------------------------------------------------------------------------------------------------------------------------ |
| **Source: Microsoft** | The criterion is in Microsoft's official documentation (Microsoft Learn), cited in the link. Microsoft does not publish numbers for the amount of visuals, pages or slicers: when there is a number, it is Power Monitor's and the description says so |
| **Source: Community tool** | The rule or limit comes from open community tools (such as PBI Inspector and Semantic Link Labs) or community checklists. It is never presented as Microsoft guidance |
| **Source: Power Monitor heuristic** | Power Monitor's own judgment; any number is a Power Monitor limit and may not suit your case |
### Rules not evaluated and coverage
**What it is:** the expandable **Rules not evaluated (N)** item, a warning banner and the *catalog vN* badge next to the **Export CSV** and **Run again** buttons.
**What it is for:** knowing what the score did **not** look at. A rule without enough data never becomes "passed": it is left out of the calculation, with the reason.
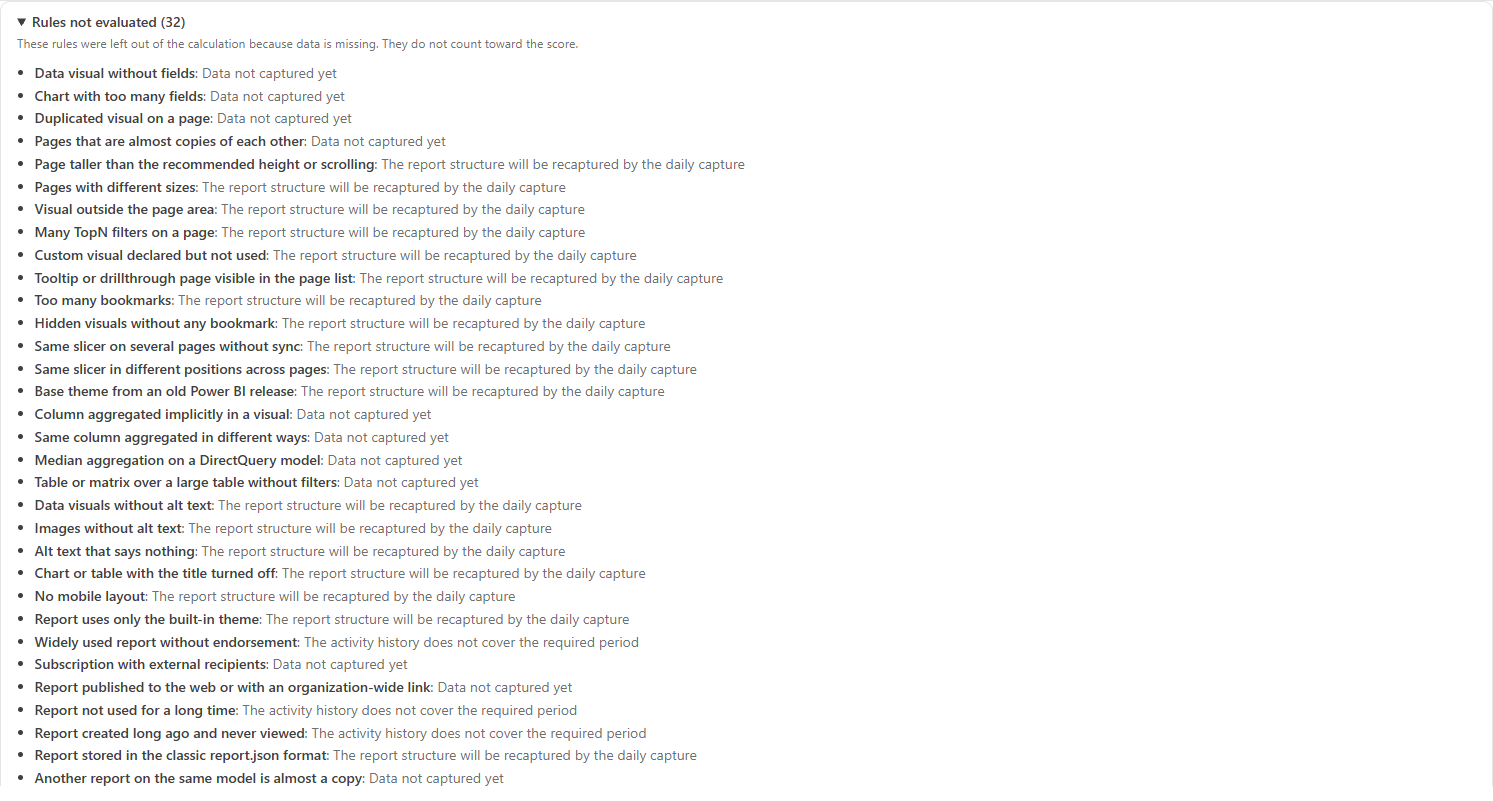
Rules not evaluated and the reason for each one
| Reason shown | When it happens |
| --------------------------------------------------------------------------------------------------- | -------------------------------------------------------------------------------------------------------------------------------------------------------------------------------------------------------------------------------------------------------------------------- |
| Report structure not captured yet | The structure has not been read yet; page and visual rules are not evaluated and the warning banner appears (Administrators see the **Open structure capture** link, which leads to [Mapping › Report Structure](/en/power-monitor/mapeamento/estrutura-de-relatorios.md)) |
| This report's captured structure is an older version and will be updated by the daily capture | The structure was read by an earlier version of the structure reader and the banner *structure captured at version X (current: Y)* appears (see [Outdated structure and reapplying without querying Fabric](#outdated-structure-and-reapplying-without-querying-fabric)) |
| The report is stored in the classic report.json format: layout and accessibility rules are not read | Layout and accessibility rules only read the PBIR format |
| No bound semantic model | Rules that depend on the model (fields, measures, DirectQuery, refresh) do not apply |
| The activity history does not cover the required period | Usage rules (unused, never viewed, heavily used without endorsement) need 90 or 180 days of log; the screen shows how many days the history covers, in a discreet line below the gauge (*The activity history covers N day(s).*) |
| Does not apply to paginated reports | Page and visual rules do not apply to paginated reports (governance and lifecycle rules do) |
| This data is not collected by Power Monitor yet | The data the rule needs is not part of Power Monitor's collection yet (for example, the public link rule is not evaluated yet). It does not depend on the structure being old: no capture fixes it |
The *catalog vN* badge indicates the rule set version. Since the score changes when the set changes, compare ratings only between analyses of the same version (version 2 expanded the catalog, created the Accessibility category and fixed density and aggregation rules, so its ratings are not comparable with those of version 1).
### Outdated structure and reapplying without querying Fabric
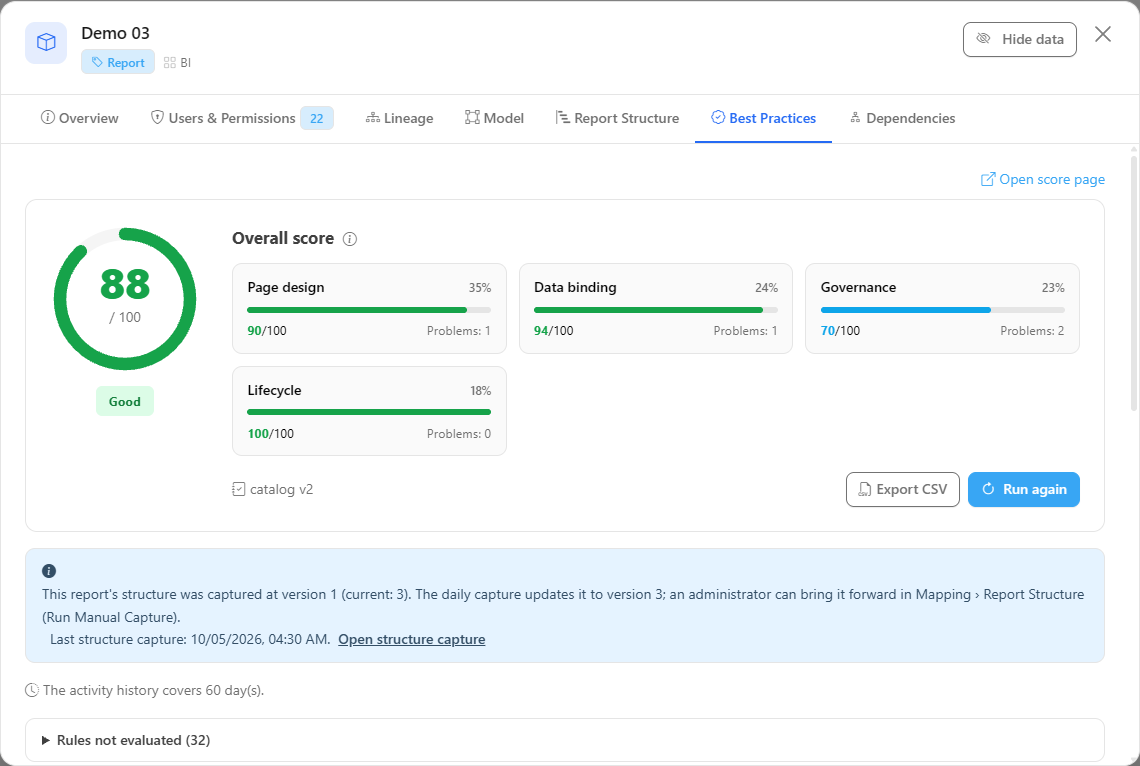
**What it is:** an informational blue banner, above the rules, that appears when the stored structure of the report was read by an earlier version of Power Monitor's structure reader. It says *This report's structure was captured at version X (current: Y). The daily capture updates it to version Y; an administrator can bring it forward in Mapping › Report Structure (Run Manual Capture).* and, when the date is known, *Last structure capture: {date}*. Administrators also see the **Open structure capture** link.
**What it is for:** explaining why some layout and accessibility rules stay in **Rules not evaluated** with the reason *This report's captured structure is an older version and will be updated by the daily capture* and why the rating may change after the structure is updated.
**How to use:**
1. If you can wait, do nothing: the daily capture (by default at 22:50, Brasília time) updates the structure to the current version.
2. If it is urgent and you are an administrator, open [Mapping › Report Structure](/en/power-monitor/mapeamento/estrutura-de-relatorios.md) and click **Run Now** (the banner calls this button *Run Manual Capture*).
3. After the update, return to the score and click **Run again**.
**How it works:**
* **Three different situations.** *Report structure not captured yet* (warning banner): the report never had its structure read. *Outdated structure* (informational banner): the structure exists but was read by an earlier version, and the rules that depend on newer data are left out. *This data is not collected by Power Monitor yet*: the data the rule needs is not part of the collection, and no capture fixes it; only a product evolution does.
* **Reapplying without calling Fabric.** Power Monitor stores a protected copy of each report's definition (compressed, with secrets masked, never displayed or sent to AI). When the structure reading is improved, the capture, daily or manual, reapplies the new rules from that copy, without querying Fabric again, and only then reads from Fabric what is still missing. That is why the structure usually gets up to date in the first run after a Power Monitor update.
* **The capture date.** *Last structure capture* is the date of the last real read of the report definition. If the report has not changed since then, that date does not change when the structure is reapplied from the protected copy.
### Export CSV and Run again
**Export CSV** downloads **all** the report's problems (the screen filters do not apply; the file is named `reportBestPractices--.csv`), with the columns Severity, Category, Target, Problem, Recommended action, Recommendation and Source (URL). **Run again** redoes the analysis with the latest collected data; use it after publishing the fixes and waiting for the next capture.
## Best Practices tab in the report details
In the [Reports](/en/power-monitor/governanca/relatorios.md) and [Paginated Reports](/en/power-monitor/governanca/relatorios/relatorios-paginados.md) lists, open the row actions menu and choose **Best Practices Analysis**: it opens this page already loaded with the report. If this page is blocked for your user, the item opens the **Best Practices** tab of the details. You can also open the report details and use the **Best Practices** tab. The tab shows the same score, the category cards and the report's problems, with the **Open score page** link to see the analysis full screen. The tab works even if the score screen is blocked for your user, as long as the Reports screen is allowed.
Best Practices tab in the report details
## Categories and weights
There are five categories, with fixed weights. The displayed percentage is redistributed when a category could not be evaluated.
| Category | Base weight | Focus |
| ----------------- | ----------- | -------------------------------------------------------------------------------------------- |
| **Page design** | 30 | Number and organization of pages and visuals, repeated filters, slicers, bookmarks and theme |
| **Data binding** | 20 | Binding to the semantic model, missing fields, aggregations, report measures and DirectQuery |
| **Governance** | 20 | Label, endorsement, owner, criticality and sharing |
| **Lifecycle** | 15 | Unused, duplicated, test-named or old-format reports |
| **Accessibility** | 15 | Alt text, visual titles, mobile layout and custom theme |
## The 61 rules assessed
Names appear in the interface language. The **What it checks** column summarizes the criterion; the full text and the recommendation appear on the screen, on each problem.
### Page design (25)
| Rule | Default severity | Origin | What it checks |
| ----------------------------------------------------- | ---------------- | ----------------------- | --------------------------------------------------------------------------------------------------------------------------------------------------------------------------------------- |
| Page with too many visuals | Warning | Community tool | A page with more than 20 data visuals loads slowly and is hard to read; more than 30 is reported as an error. |
| Report with many pages | Info | Power Monitor heuristic | A report with more than 15 navigable pages is hard to navigate and usually mixes several audiences. |
| Empty page | Info | Power Monitor heuristic | The page has no visuals, so it only adds navigation noise and delivers nothing to the audience. |
| Page with default name | Info | Power Monitor heuristic | Names such as Page 1 or Sheet 1 say nothing about the content and make navigation and support harder. |
| Table or matrix with too many fields | Warning | Power Monitor heuristic | Tables and matrices with more than 12 fields are heavy to render, hard to read and often replace an export. |
| Page with too many slicers | Info | Power Monitor heuristic | More than 6 slicers on a page crowd the layout and make the combination of filters hard to understand. |
| Data visual without fields | Warning | Power Monitor heuristic | The visual has no field bound and shows nothing to the user. |
| Same filter repeated across visuals | Info | Power Monitor heuristic | The same field is filtered in three or more visuals of the page, which is hard to maintain and easy to leave inconsistent. |
| Same filter repeated on every page | Info | Power Monitor heuristic | The same filter is configured on every page, when it could be defined once. |
| Chart with too many fields | Info | Community tool | A chart with more than 6 fields (sort-by and tooltip fields are not counted) is hard to read and costly to query. |
| Custom visuals in use | Info | Microsoft | The report uses visuals that are not built into Power BI (AppSource or organizational custom visuals). |
| Duplicated visual on a page | Info | Power Monitor heuristic | Two or more visuals of the same type show exactly the same fields on one page, which doubles the queries for no new information. |
| Pages that are almost copies of each other | Info | Power Monitor heuristic | Two pages share at least 90% of their visuals (same type and same fields); the 90% is a Power-Monitor threshold. |
| Many tables or matrices on one page | Info | Power Monitor heuristic | A page with 3 or more table or matrix visuals tends to be a data dump, and each one sends a heavy query. |
| Page taller than the recommended height or scrolling | Info | Community tool | The page is taller than 720 px, or its content goes beyond the bottom of the page while the page is shown as Actual size or Fit to width, so users have to scroll. |
| Pages with different sizes | Info | Power Monitor heuristic | The navigable pages of the report do not all have the same width and height (tooltip, drillthrough and hidden pages are not compared), which makes the report jump when users navigate. |
| Visual outside the page area | Info | Power Monitor heuristic | A visible visual extends beyond the page canvas (by more than 4 px, a Power-Monitor threshold). |
| Many TopN filters on a page | Info | Community tool | A page with 4 or more TopN filters (page and visual level) is hard to reason about, and every filter adds queries. |
| Custom visual declared but not used | Warning | Power Monitor heuristic | The report lists a custom visual (AppSource or organizational) that no visual of the report uses any more. |
| Tooltip or drillthrough page visible in the page list | Info | Power Monitor heuristic | A tooltip or drillthrough page is shown in the page tabs, so users can open a page that was designed to be reached only from another visual. |
| Too many bookmarks | Info | Power Monitor heuristic | The report has more than 20 bookmarks, which is hard to maintain and usually hides a navigation that should be redesigned. |
| Hidden visuals without any bookmark | Info | Power Monitor heuristic | The report has hidden visuals but no bookmark, so they can only be shown through the selection pane. |
| Same slicer on several pages without sync | Info | Power Monitor heuristic | A slicer on the same field appears on 2 or more pages, but they do not all belong to one sync group, so users have to repeat the selection on each page. |
| Same slicer in different positions across pages | Info | Microsoft | Microsoft accessibility guidance recommends keeping slicers in the same position on every page. |
| Base theme from an old Power BI release | Info | Power Monitor heuristic | The base theme name of the report (for example CY24SU10) encodes the Power BI Desktop release that created it. |
### Data binding (16)
| Rule | Default severity | Origin | What it checks |
| ---------------------------------------------------------- | ---------------- | ----------------------- | ---------------------------------------------------------------------------------------------------------------------------------------------------------- |
| Visual references a field that does not exist in the model | Error | Power Monitor heuristic | A visual points to a table, column or measure that is not in the bound semantic model, so it shows an error or stays empty. |
| Visual uses a hidden field (informational) | Info | Power Monitor heuristic | A visual projects a column or measure that the model hides from report authors. |
| Report defines its own measures | Info | Community tool | The report carries report-level measures. |
| Report not linked to a semantic model in the inventory | Info | Power Monitor heuristic | The report has no semantic model binding, or its model is not part of the monitored inventory. |
| Bound semantic model was deleted | Error | Power Monitor heuristic | The report points to a semantic model that no longer exists, so it cannot load data. |
| Bound semantic model has a low BPA score | Warning | Power Monitor heuristic | The model that feeds this report has a low Best Practices score, which tends to cause slow visuals and wrong numbers. |
| Endorsed report on a model without endorsement | Warning | Power Monitor heuristic | The report is endorsed (promoted or certified), but the semantic model behind it is not, so the endorsement promises more trust than the data source has. |
| Many visuals on a page over a DirectQuery model | Warning | Power Monitor heuristic | On a model with DirectQuery tables, every visual of a page sends queries to the source when the page opens. |
| Column aggregated implicitly in a visual | Warning | Power Monitor heuristic | A visual aggregates a model column on the fly (Sum, Count...) instead of using a measure. |
| Filter applied on a measure | Info | Microsoft | A visual, page or report filter is applied on a measure. |
| Median aggregation on a DirectQuery model | Warning | Microsoft | A visual aggregates a column with Median over a DirectQuery model. |
| Same column aggregated in different ways | Info | Power Monitor heuristic | The same column is aggregated with more than one function (for example Sum in one visual and Average in another). |
| Report-level measure that nothing uses | Info | Power Monitor heuristic | A report-level measure is not used by any visual, filter, formatting rule or other report-level measure. |
| Report-level measure duplicates a model measure | Warning | Power Monitor heuristic | A report-level measure has the same name as a model measure, or the same DAX text (ignoring spaces and case), so the model measure should be used instead. |
| Bound model with refresh failures or no recent refresh | Warning | Power Monitor heuristic | The bound semantic model had refresh failures in the last 7 days, or it has a refresh schedule but no refresh finished in the last 7 days. |
| Table or matrix over a large table without filters | Warning | Power Monitor heuristic | A table or matrix reads a table with more than 1,000,000 rows and no visual, page or report filter limits it. |
### Governance (9)
| Rule | Default severity | Origin | What it checks |
| ------------------------------------------------------------- | ---------------- | ----------------------- | ----------------------------------------------------------------------------------------------------------------------------------------------------------------------------------------------------------------- |
| Report without a sensitivity label | Warning | Microsoft | No sensitivity label was found on the report. |
| Widely used report without endorsement | Info | Power Monitor heuristic | The report was opened by 10 or more distinct people in the last 90 days and has no endorsement, so users cannot tell whether it is trustworthy. |
| Report without an owner | Warning | Power Monitor heuristic | No principal with the Owner access right was found on the access list of the report. |
| Bound model without a business criticality | Info | Power Monitor heuristic | Criticality is classified on the semantic model, and the report inherits it. |
| Subscription with external recipients | Warning | Power Monitor heuristic | The report sends e-mail subscriptions to recipients outside the organization, which can expose sensitive data. |
| Report published to the web or with an organization-wide link | Error | Power Monitor heuristic | There is a public link (publish to web) or an organization-wide link for this report, so anyone with the link can open it. Today this rule is not evaluated yet: it always appears under **Rules not evaluated**. |
| Certified report that is not maintained or used | Warning | Power Monitor heuristic | The report is certified, was not modified for more than 365 days and had no views in the last 90 days. |
| Report shared directly with many principals | Info | Power Monitor heuristic | More than 25 principals (users and groups) have direct access to the report; the number is a Power-Monitor threshold. |
### Lifecycle (6)
| Rule | Default severity | Origin | What it checks |
| ------------------------------------------------- | ---------------- | ----------------------- | ------------------------------------------------------------------------------------------------------------------------------------------------------------------- |
| Report not used for a long time | Warning | Power Monitor heuristic | No one opened the report in the last 180 days and it was not modified in the same period. |
| Report with a duplicated name | Info | Power Monitor heuristic | Another report has the same name, which confuses users and support. |
| Report with test or temporary name | Info | Power Monitor heuristic | Names such as Test, Copy of or Temp suggest a report that was not meant for production. |
| Report created long ago and never viewed | Info | Power Monitor heuristic | The report was created more than 90 days ago and the activity log shows no view in the last 90 days (or 180 when the log covers it). |
| Another report on the same model is almost a copy | Info | Power Monitor heuristic | Another report bound to the same semantic model shares at least 90% of its visuals (same type and same fields) with this one; the 90% is a Power-Monitor threshold. |
| Report stored in the classic report.json format | Info | Microsoft | The report is stored in the classic single-file format. |
### Accessibility (6)
| Rule | Default severity | Origin | What it checks |
| ---------------------------------------- | ---------------- | ----------------------- | -------------------------------------------------------------------------------------------------------------------------------------------------------------------- |
| Data visuals without alt text | Info | Microsoft | Microsoft accessibility guidance asks for alt text on every meaningful visual so screen readers can describe it. |
| Images without alt text | Info | Microsoft | Microsoft accessibility guidance asks for alt text on images. |
| Alt text that says nothing | Info | Microsoft | A visual has alt text shorter than 5 characters (a Power-Monitor threshold), or equal to its visual type or its title, which tells a screen reader user nothing new. |
| Chart or table with the title turned off | Info | Power Monitor heuristic | A chart, table or matrix with 2 or more fields has its title turned off. |
| No mobile layout | Info | Power Monitor heuristic | The report has no phone layout, so it is shown scaled down in the Power BI mobile app. |
| Report uses only the built-in theme | Info | Community tool | The report has no custom theme, so colors, fonts and contrast are the Power BI defaults and each visual is formatted by hand. |
## Rules and behavior
* **Only data already collected.** Nothing is run against the report or changed in it. The structure (pages, visuals, fields) comes from the daily capture in [Mapping › Report Structure](/en/power-monitor/mapeamento/estrutura-de-relatorios.md), which also reapplies new rules from a protected copy of the definition, without querying Fabric again (see [Outdated structure and reapplying without querying Fabric](#outdated-structure-and-reapplying-without-querying-fabric)); usage data comes from the Power BI activity log.
* **Missing data never passes silently.** Rules without enough data stay under **Rules not evaluated** and do not enter the score.
* **Limits are Power Monitor's.** Microsoft does not publish numbers for visuals, pages, slicers or fields per visual. The limits (for example, 20 visuals per page, 15 pages, 6 slicers, 180 days without use) are Power Monitor's or come from community tools, and the origin of each rule is shown on the screen.
* **Paginated reports.** They only receive the **Governance** and **Lifecycle** categories, and within them only the rules that do not depend on pages, visuals or a model (left out, for example, are *Bound model without a business criticality*, *Report stored in the classic report.json format* and *Another report on the same model is almost a copy*). The other rules appear under **Rules not evaluated** with the reason *Does not apply to paginated reports*.
* **Workspace scope.** The search lists only reports from workspaces you can view.
## Step by step: reviewing a report
{% stepper %}
{% step %}
Search for the report in **Search for a report...** (or use **Best Practices Analysis** in the reports list).
{% endstep %}
{% step %}
Read the **Overall score** and see which category loses the most points.
{% endstep %}
{% step %}
Filter **Severity** = *Error* and then *Warning*; open **Recommendation** on each problem.
{% endstep %}
{% step %}
Fix it in Power BI Desktop or in the service, publish and wait for the next capture.
{% endstep %}
{% step %}
Click **Run again** to check the new rating.
{% endstep %}
{% endstepper %}
## Frequently asked questions
Why does the Accessibility category not appear?
Accessibility rules are only evaluated on reports saved in the PBIR format, with the structure captured by the current version of the reader. Without that, the category has no checks and is left out of the score, and the reason appears under **Rules not evaluated**.
The rating changed without me changing the report.
The score also depends on the linked semantic model, recent usage and the rule catalog. Check the *catalog vN* badge and whether the model had refresh failures.
Can I ignore a rule?
Rules cannot be turned off. Use the displayed origin (for example, *Power Monitor heuristic*) to decide whether the item makes sense for your case and treat it as a documented exception.
The banner says the structure was captured at an older version. Do I need to do anything?
It is not mandatory. The daily capture updates the structure to the current version, and the rating is recalculated with the rules that depended on it. If you need the updated rating now and you are an administrator, use **Run Now** in [Mapping › Report Structure](/en/power-monitor/mapeamento/estrutura-de-relatorios.md) and then **Run again** here.
What is the difference between "outdated structure" and "This data is not collected by Power Monitor yet"?
*Outdated structure* solves itself: the next capture updates the structure and the rule starts being evaluated. *This data is not collected by Power Monitor yet* indicates that the data the rule needs is not part of the current collection; no capture changes that.
## Related pages
* [Best Practices Score](/en/power-monitor/qualidade-de-dados/score-de-boas-praticas-bpa.md): the equivalent rules for semantic models
* [AI Score](/en/power-monitor/qualidade-de-dados/score-de-ia.md)
* [Environment X-Ray](/en/power-monitor/qualidade-de-dados/raio-x-do-ambiente.md)
* [Governance › Reports](/en/power-monitor/governanca/relatorios.md)
* [Mapping › Report Structure](/en/power-monitor/mapeamento/estrutura-de-relatorios.md)
---
# Agent Instructions
This documentation is published with GitBook. GitBook is the documentation platform designed so that both humans and AI agents can read, navigate, and reason over technical content effectively. Learn more at gitbook.com.
## Querying This Documentation
If you need additional information that is not directly available in this page, you can query the documentation by asking a question.
Perform an HTTP GET request on the following URL with the `ask` and `goal` query parameters:
```
GET https://docs.powermonitor.com.br/en/power-monitor/qualidade-de-dados/score-de-boas-praticas-de-relatorios.md?ask=&goal=
```
`ask` is the immediate question: it should be specific, self-contained, and written in natural language.
`goal` is what the user is ultimately trying to achieve, the reason they need the answer. Sharing it helps GitBook give you a better, more relevant answer. A goal is most helpful when it describes the outcome the user wants rather than restating the question. For example, with `ask=how do I create an API token`, a goal like `automate deployments from our CI pipeline` lets GitBook tailor the answer to that use case.
The response will contain a direct answer to the question and relevant excerpts and sources from the documentation.
Use this mechanism when the answer is not explicitly present in the current page, you need clarification or additional context, or you want to retrieve related documentation sections.