> For the complete documentation index, see [llms.txt](https://docs.powermonitor.com.br/llms.txt). Markdown versions of documentation pages are available by appending `.md` to page URLs; this page is available as [Markdown](https://docs.powermonitor.com.br/en/power-monitor/qualidade-de-dados/score-de-ia.md).
# AI Score
Measure how ready a semantic model is to be consumed by Copilot and natural-language questions, with 23 rules, the list of problems and the recommended action for each one.
The **AI Score** assesses how ready a semantic model is to be consumed by **generative AI**: Copilot in Power BI/Fabric, data agents and natural language questions. AI relies on clear names, descriptions, a date table and explicit measures to choose the right data; this screen points out exactly what is missing.
**How to access:** *Data Quality › AI Score*. The page title is **AI Readiness**. Available to all profiles (read-only), unless access to the page is blocked: the predefined **Audit** profile does not open this screen by default, and an administrator can allow or block it per profile or per user (see [Users](/en/power-monitor/usuarios.md#user-profiles)); the block also applies to the data. The same score also appears on the **AI Adherence** tab of the model details, on screens such as [Governance › Semantic Models](/en/power-monitor/governanca/modelos-semanticos.md).
Overall score, weighted categories and findings
## What it is for
* **Preparing a model for Copilot** before releasing it to business users.
* **Prioritizing documentation**: find out which tables, columns and measures have no description.
* **Eliminating ambiguity**: find duplicate measures and visible technical columns (IDs) that confuse AI.
* **Tracking progress**: run the analysis again after publishing the fixes.
## Features
### Semantic model selection
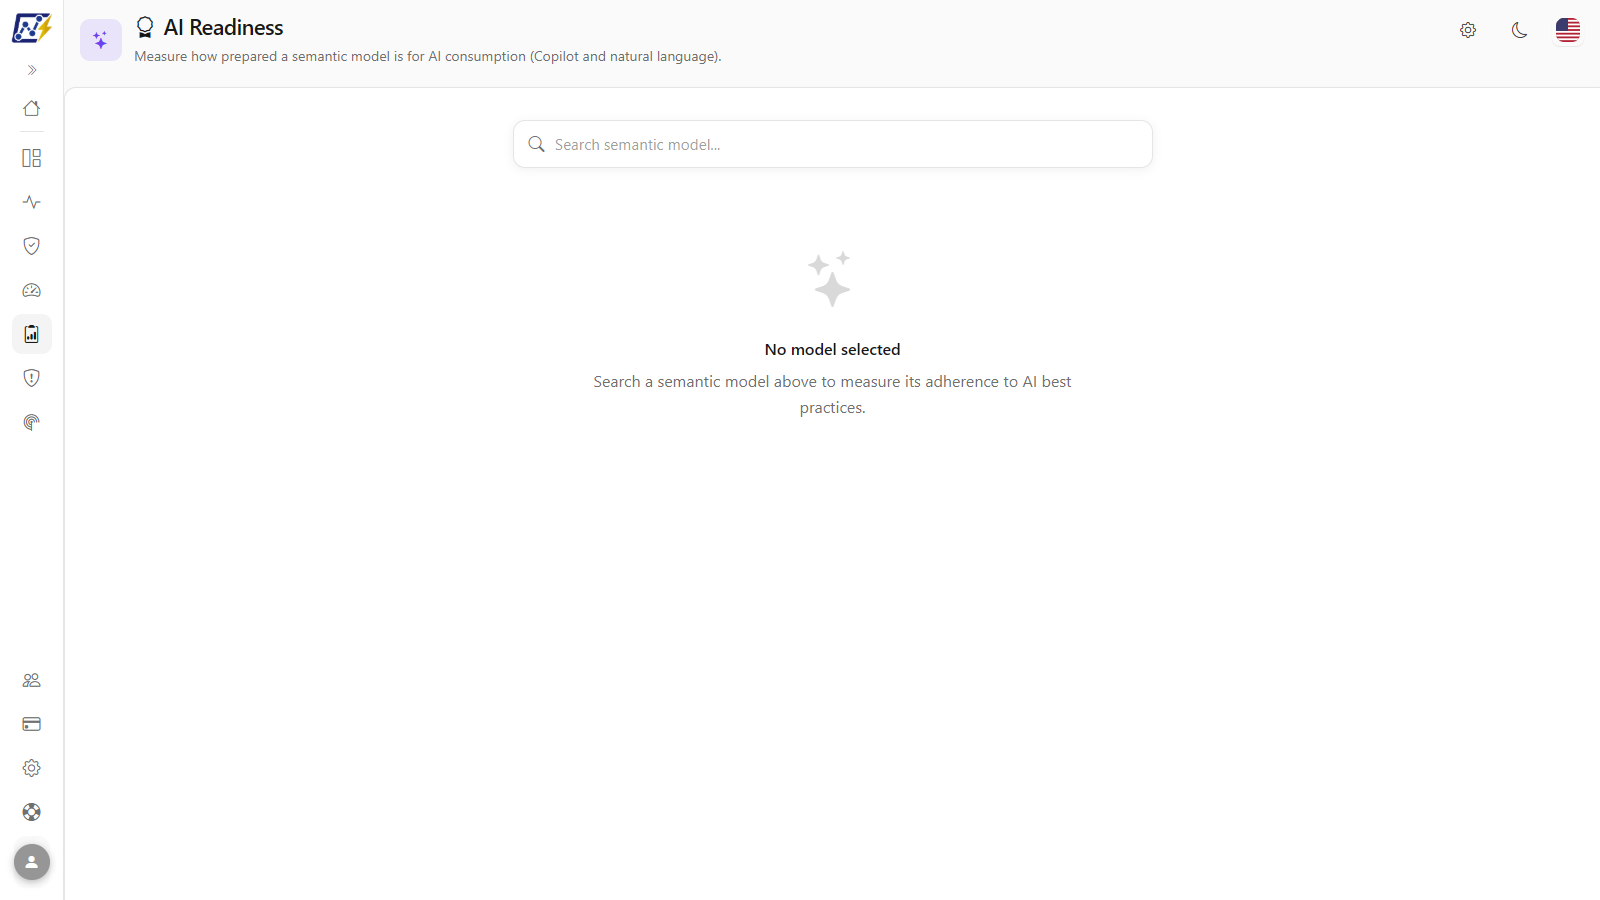
**What it is:** the *Search semantic model...* field, at the top of the screen, which lists only semantic models, with the workspace of each one.
**What it is for:** choosing which model will be assessed. The analysis is done one model at a time.
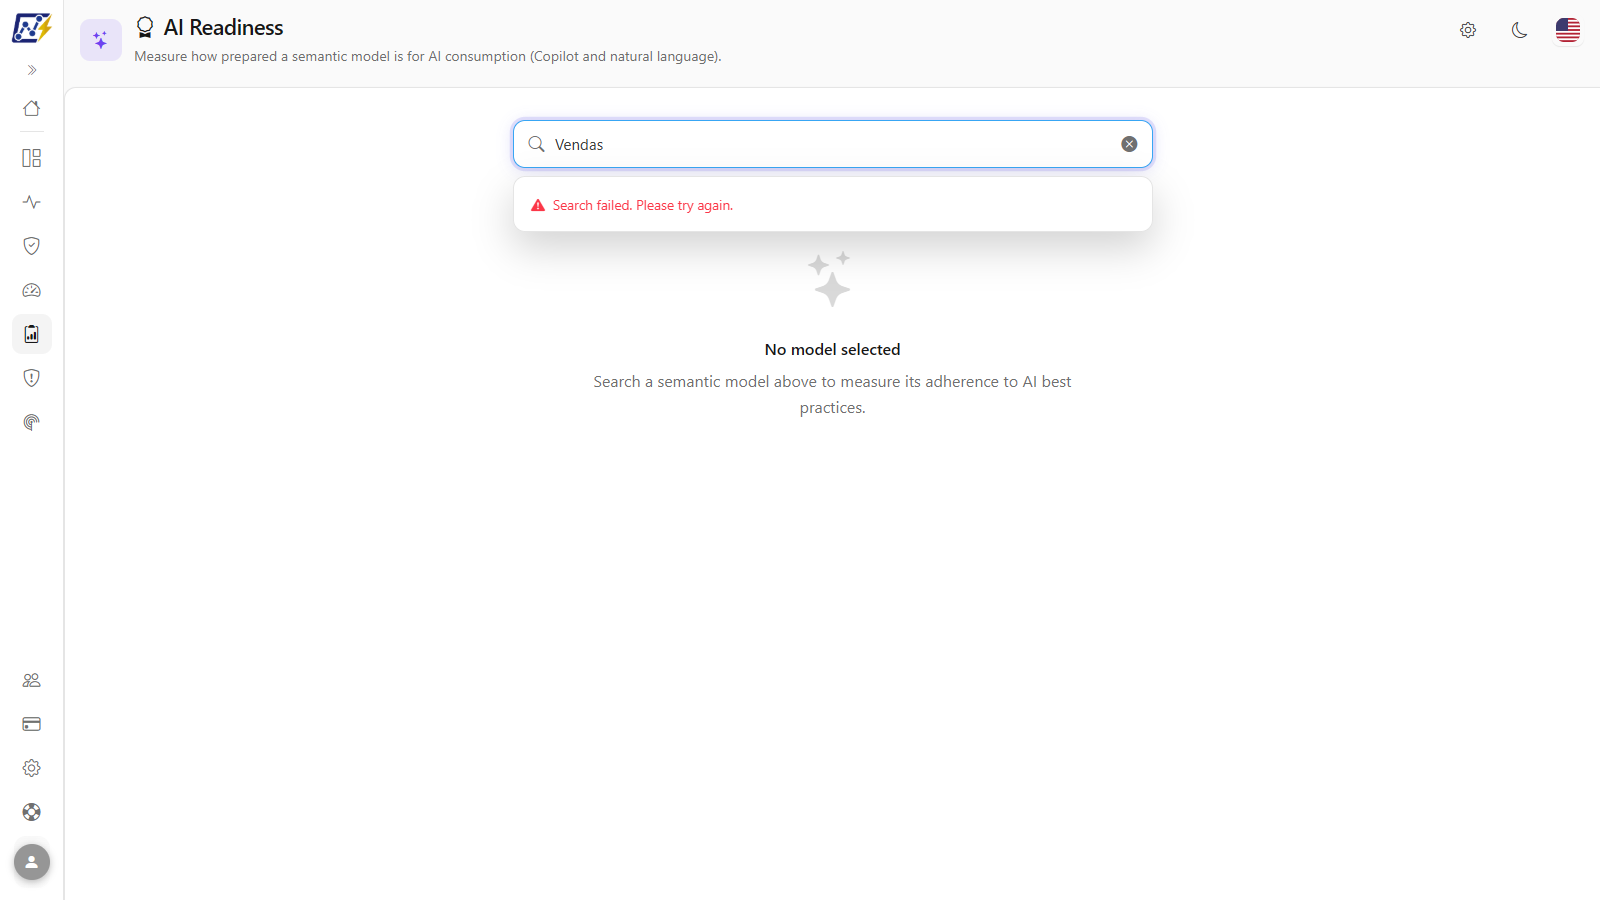
Model search and selection
**How to use:**
1. Type at least 2 characters in the **Search semantic model...** field.
2. Click the suggestion (or use **↑**/**↓** and **Enter**).
3. Check the bar below the search, with the chosen model and workspace and the reminder that *the analysis uses metadata from the latest scan*. While calculating, the screen displays *Analyzing the model...*.
**How it works:** with no model chosen, the screen shows *No model selected*. To analyze another model, just run a new search: the previous result is replaced. If the analysis fails, *Could not analyze this semantic model.* appears: select the model again. The search lists only models from workspaces in your scope that have already been collected by the scan.
### Overall score
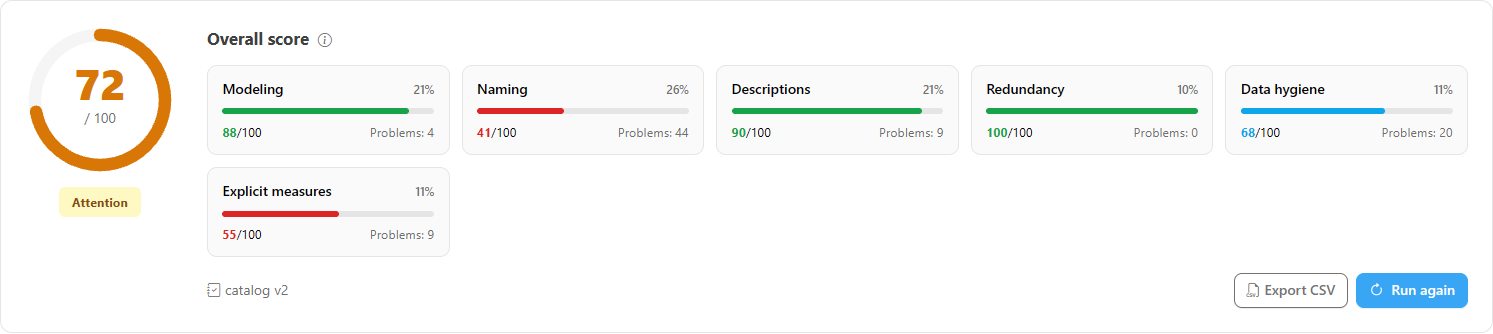
**What it is:** the **0 to 100** gauge, with the status badge, on the left of the result panel.
**What it is for:** knowing at a glance whether the model is ready for Copilot and natural language questions.
Overall score and category cards
| Band | Status | Gauge color |
| --------- | ------------------- | ----------- |
| 80 to 100 | **Good** | Green |
| 60 to 79 | **Attention** | Amber |
| 0 to 59 | **Needs attention** | Orange |
**How it works:** the overall score is the average of the category ratings, weighted by the weight of each one (see [Rules and behavior](#rules-and-behavior)).
### Category cards
**What it is:** one card for each of the six categories, with its **weight** in the overall score, the category rating (0 to 100) with a colored bar (green from 80, blue from 60 to 79 and red below 60) and the number of **Problems**. Only categories that had some applicable check appear.
**What it is for:** seeing where the model loses the most points and focusing the fixes on the categories with the highest weight.
Click a card to filter the category's problems
**How to use:**
1. Click a card (for example, **Descriptions**). The findings table then shows only that category and the **Clear filter: Descriptions** button appears.
2. To undo, click the same card or **Clear filter**.
The weights below are version 2 of the rule set. The **Synonyms** category (base weight 5) does not have rules yet and is therefore left out of the calculation: the weights of the others are redistributed to add up to 100 (*Weight on screen* column, with the six categories evaluated).
| Category | Base weight | Weight on screen | What it assesses |
| --------------------- | ----------- | ---------------- | -------------------------------------------------------------------------------------------------------------------- |
| **Naming** | 25 | 26% | Extra spaces, special characters and technical-style names (`dim`/`fact` prefixes, CamelCase) |
| **Modeling** | 20 | 21% | Date table, Auto Date/Time, empty or unrelated tables, ambiguous and bidirectional relationships |
| **Descriptions** | 20 | 21% | Presence and quality of descriptions of visible tables, columns and measures (missing, shallow or equal to the name) |
| **Data hygiene** | 10 | 11% | Technical columns (IDs and foreign keys) visible to the user and numeric keys being summed |
| **Explicit measures** | 10 | 11% | Tables with numeric columns and no measures, and measures without a display format |
| **Redundancy** | 10 | 10% | Measures that are duplicated or are merely aliases of other measures |
### Findings table
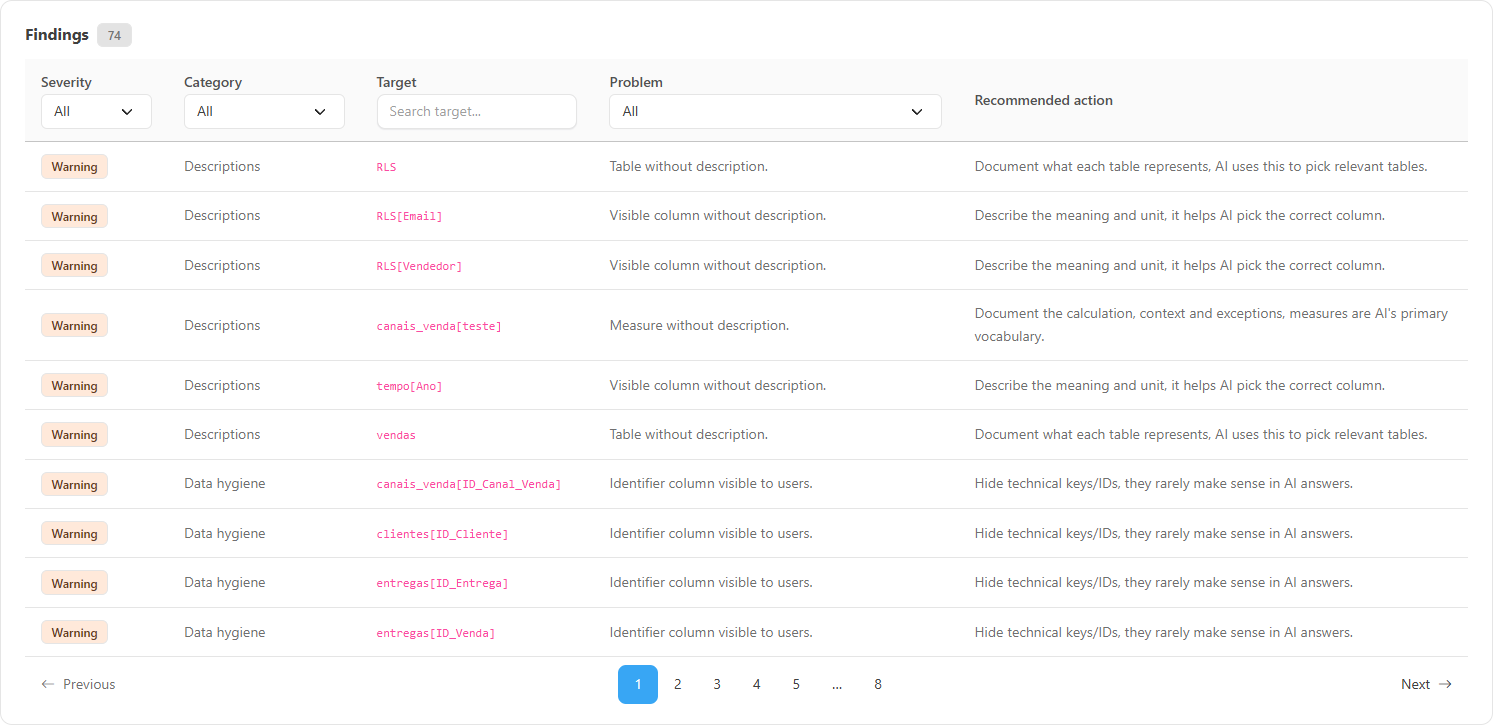
**What it is:** the list of all the model's problems, with the total next to the title and filters in the header.
**What it is for:** building the fix work list, object by object.
Findings with the recommended action
| Column | Content | Filter |
| ---------------------- | ----------------------------------------------------------------- | ------------------------- |
| **Severity** | Error, Warning or Info | List |
| **Category** | One of the six categories | List |
| **Target** | Affected object, in the format `Table` or `Table[Column/Measure]` | Text (*Search target...*) |
| **Problem** | Description of the problem | List (grouped by rule) |
| **Recommended action** | What to do to fix it | None |
**How to use:**
1. Choose a value in **Severity** (**All**, *Error*, *Warning*, *Info*), **Category** (**All** or a category) or **Problem** (**All** or a specific rule).
2. To find an object, type part of the table, column or measure name in **Search target...**.
3. The filters are combined with the category card filter.
4. The table shows 10 problems per page: use **Items per page** (10, 25, 50 or 100) and the pagination. Changing a filter returns to the first page.
**Special states:** if the model has no problems, the screen displays *No problems found. Excellent!*; if no problem matches the filters, *No problems match the applied filters.* Problems already come sorted by severity (Error, Warning, Info), category and target; the columns have no sorting of their own. On narrow screens (mobile), each problem becomes a card and the filters move to a bar above the list.
### Rules not evaluated and catalog version
**What it is:** the expandable **Rules not evaluated (N)** item, which appears below the cards when some rule could not be calculated, and the *catalog vN* badge, next to the **Export CSV** and **Run again** buttons.
**What it is for:** knowing what the score did **not** look at. For example, the relationship rules (isolated table, ambiguous and bidirectional relationship) are not evaluated when the scan did not capture any relationship of the model. A rule that was not evaluated never counts as passed: it does not enter the score. The catalog version warns that the rating can change when the rule set changes; compare ratings only between analyses of the same version.
### Export CSV
**What it is:** the **Export CSV** button, below the category cards.
**What it is for:** distributing the list of fixes to the model owners.
**How to use:**
1. With a model analyzed, click **Export CSV** (the button is disabled when the model has no problems).
2. The file `aiScore--.csv` is downloaded.
**How it works:** the file contains **all** the model's problems, regardless of the screen filters, with the columns Severity, Category, Target, Problem, Recommended action, Recommendation and Source (URL): the last two are empty in the AI Score. It opens correctly in Excel with accented characters.
### Run again
**What it is:** the **Run again** button, next to **Export CSV**.
**What it is for:** reassessing the model after the published fixes have been collected by the scan.
**How to use:**
1. Publish the fixes in Power BI and wait for the model's next scan (see [Mapping](/en/power-monitor/mapeamento.md)).
2. With the model open, click **Run again** (or select the model again).
3. Compare the **Overall score** and the number of **Problems** in each category with the previous result.
**How it works:** the analysis is redone with the most recent metadata already collected: nothing is queried in real time and nothing is changed in the model.
### Adherence tab in the model details
**What it is:** the same analysis inside the details of a semantic model, on the **AI Adherence** tab (next to **Best Practices Adherence**), opened from screens such as Governance › Semantic Models.
**How it works:** the tab shows the overall score, the category cards, the problems table, **Export CSV** and **Run again** for the open model, without the search field. The analysis starts when you open the tab (*Analyzing the model...*); if it fails, *Could not analyze this semantic model.* appears.
## Rules assessed
There are 23 rules, all calculated on the collected metadata (names, descriptions, visibility, types, relationships and DAX expressions). The problem and recommended action texts appear in the interface language.
| Category | Problem (screen text) | Severity | When it fires |
| ----------------- | ------------------------------------------------------------- | -------- | ---------------------------------------------------------------------------------------------------------------------------------------------------- |
| Modeling | Model has … Auto Date/Time table(s). | Warning | The model contains automatic date/time tables from Power BI Desktop |
| Modeling | No date table identified in the model. | Warning | No table named like a calendar/date/time and no date/time column |
| Modeling | Visible table with no visible columns or measures. | Warning | Visible table with all its content hidden |
| Modeling | Visible table without any relationship. | Warning | Visible table with no relationship (measure-only tables are skipped) |
| Modeling | There are … active relationships between the same two tables. | Warning | More than one active relationship between the same two tables |
| Modeling | Relationship with bidirectional cross-filtering. | Warning | Relationship with cross-filtering in both directions |
| Naming | Name starts or ends with a space. | Warning | Visible table, column or measure |
| Naming | Name contains special characters (…). | Warning | Any character that is not a letter, digit or space |
| Naming | Name in a technical style (…). | Warning | Table with a technical prefix (`dim`, `fact`, `stg`, `tbl`...), or a table, column or measure with a CamelCase name with no separators (`OrderDate`) |
| Descriptions | Table without description. | Warning | Visible table without a description |
| Descriptions | Visible column without description. | Warning | Visible column without a description |
| Descriptions | Measure without description. | Warning | Visible measure without a description |
| Descriptions | The description only repeats the name of the object. | Warning | The description is just a copy of the name (ignoring case, spaces and symbols) |
| Descriptions | Table description is too short (… characters). | Info | Table description with fewer than 15 characters |
| Descriptions | Column description is too short (… characters). | Info | Column description with fewer than 15 characters |
| Descriptions | Measure description is too short (… characters). | Info | Measure description with fewer than 15 characters |
| Redundancy | Measure has a definition identical to. | Warning | Two or more measures with the same DAX expression (each copy beyond the first counts as a problem) |
| Redundancy | Measure is just a direct reference to. | Info | The measure expression is just `[OtherMeasure]` |
| Data hygiene | Identifier column visible to users. | Warning | Visible column with a technical key name (for example `ID`, `xxx_id`, `SK_`, `FK_`, `PK_`, `Codigo`, `Cod_`) |
| Data hygiene | Foreign key column visible to the user. | Warning | Visible column on the "many" side of a relationship (a foreign key with a business-looking name) |
| Data hygiene | Numeric key column with default aggregation. | Warning | Numeric key whose default summarization is not "None" (the engine would sum the keys) |
| Explicit measures | Table with … numeric column(s) and no measures. | Info | Visible table with visible numeric columns and no measures. If you use a dedicated measures table, you can ignore this item |
| Explicit measures | Measure without a display format. | Info | Visible measure without a format string |
## Rules and behavior
* **How the score is calculated.** Each category starts with 100 points and loses points according to the proportion of problems over the total objects assessed in that category: each **Error** counts 2, each **Warning** counts 1 and each **Info** counts 0.5. The **overall score** is the average of the categories weighted by the weights in the [categories](#category-cards) table. Categories with no applicable check are left out and the weights are redistributed.
* **Hidden objects** are not included in most rules: AI works with what the user sees.
* **Auto Date/Time automatic tables** are excluded from all checks (they only generate their own Auto Date/Time warning).
* **Data source.** The analysis uses the metadata from the model's latest scan (names, descriptions, visibility, types and DAX expressions). Nothing is queried in real time and nothing is changed in the model.
* **Same calculation throughout the product.** The score shown here is the same as the *AI Score* column in the [Environment Inventory](/en/power-monitor/qualidade-de-dados/inventario-do-ambiente.md).
* **Microsoft standard artifacts.** Models created by Microsoft itself (Fabric Capacity Metrics, usage metrics and so on) do not appear in the model search, because they are not analyzed. See [Microsoft standard artifacts](/en/power-monitor/qualidade-de-dados/exposicao-de-dados.md#microsoft-standard-artifacts).
{% hint style="info" %}
In the AI Score, the text of the **Recommended action** column is already the fix guidance (there is no expandable **Recommendation** item as in the Best Practices Score). The AI Score rules are Power Monitor heuristics over the model metadata and have no external source link.
{% endhint %}
{% hint style="info" %}
The AI Score and the [Best Practices Score](/en/power-monitor/qualidade-de-dados/score-de-boas-praticas-bpa.md) assess the same model from different angles. A model can be technically well built (high BPA) and still be poorly documented for AI, and vice versa.
{% endhint %}
## Step by step: common scenarios
### How to prepare a model for Copilot
{% stepper %}
{% step %}
### Select the model
Search for and select the semantic model.
{% endstep %}
{% step %}
### Start with the highest-weight categories
Click the **Naming** card and then **Descriptions** to see the problems that most affect the rating. Filter **Severity** = *Warning* to leave the *Info* items for later.
{% endstep %}
{% step %}
### Export the work list
Use **Export CSV** and distribute the items to the model owners.
{% endstep %}
{% step %}
### Publish and reassess
After publishing the fixes in Power BI, wait for the next scan and click **Run again**.
{% endstep %}
{% endstepper %}
## Frequently asked questions
I fixed the model, but the score did not change.
The analysis uses the metadata from the latest scan. After publishing the changes, wait for the next collection cycle (or ask an administrator to run it in [Mapping](/en/power-monitor/mapeamento.md)) and click **Run again**.
I use a measures-only table. Why does "Table with numeric columns and no measures" appear?
The rule checks each table individually. If the measures are in a dedicated table, the item is expected and can be ignored: it has **Info** severity and carries little weight in the score.
The model does not appear in the search.
The search lists only models from workspaces you can view and that have already been collected by the scan.
## Related pages
* [Best Practices Score](/en/power-monitor/qualidade-de-dados/score-de-boas-praticas-bpa.md)
* [Environment Inventory](/en/power-monitor/qualidade-de-dados/inventario-do-ambiente.md): the score of all models in a single table
* [Model Cleanup](/en/power-monitor/performance/limpeza-de-modelo.md)
---
# Agent Instructions
This documentation is published with GitBook. GitBook is the documentation platform designed so that both humans and AI agents can read, navigate, and reason over technical content effectively. Learn more at gitbook.com.
## Querying This Documentation
If you need additional information that is not directly available in this page, you can query the documentation by asking a question.
Perform an HTTP GET request on the following URL with the `ask` and `goal` query parameters:
```
GET https://docs.powermonitor.com.br/en/power-monitor/qualidade-de-dados/score-de-ia.md?ask=&goal=
```
`ask` is the immediate question: it should be specific, self-contained, and written in natural language.
`goal` is what the user is ultimately trying to achieve, the reason they need the answer. Sharing it helps GitBook give you a better, more relevant answer. A goal is most helpful when it describes the outcome the user wants rather than restating the question. For example, with `ask=how do I create an API token`, a goal like `automate deployments from our CI pipeline` lets GitBook tailor the answer to that use case.
The response will contain a direct answer to the question and relevant excerpts and sources from the documentation.
Use this mechanism when the answer is not explicitly present in the current page, you need clarification or additional context, or you want to retrieve related documentation sections.