> For the complete documentation index, see [llms.txt](https://docs.powermonitor.com.br/llms.txt). Markdown versions of documentation pages are available by appending `.md` to page URLs; this page is available as [Markdown](https://docs.powermonitor.com.br/en/principais-funcionalidades/alertas-em-tempo-real.md).
# Custom alerts
Power Monitor custom alerts: which events trigger alerts, thresholds and filters defined by the organization, channels (email, Teams, Slack, Telegram and webhooks/ITSM) and the incident center with MT
A good alert arrives **before users complain**, **to someone who can fix it** and **without noise**. Power Monitor watches your environment around the clock and lets you decide what matters, who hears about it and on which channel.
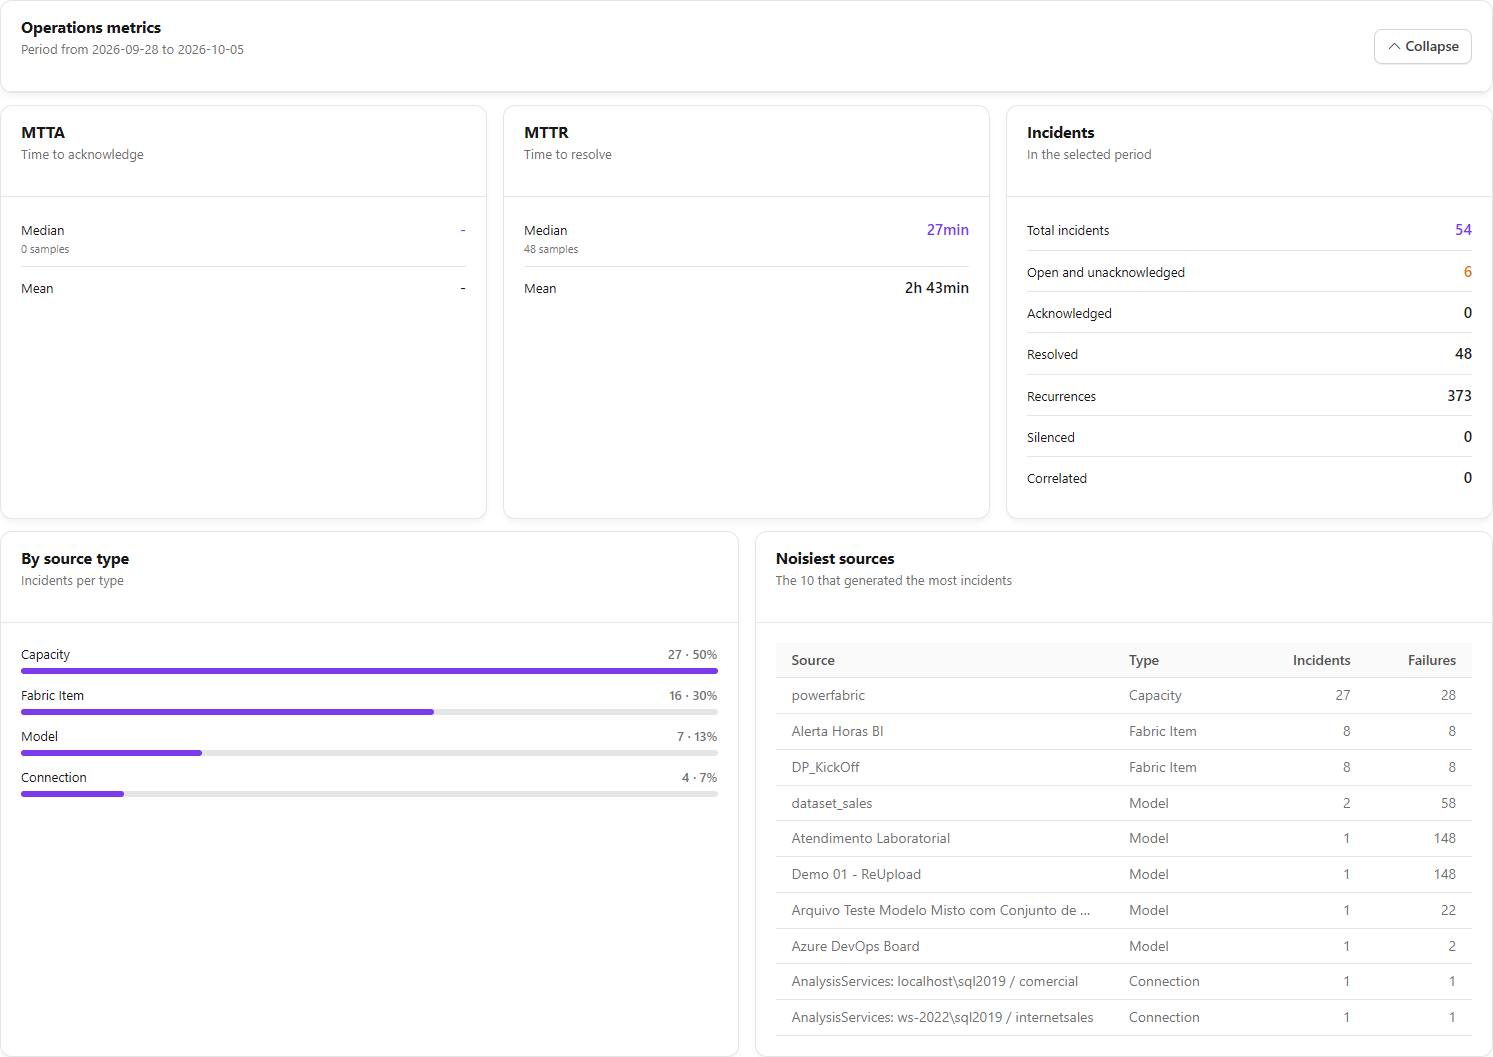
Incident center with MTTA, MTTR and recurrence
## What triggers an alert
| Area | Alerts |
| ------------------ | -------------------------------------------------------------------------------------------------------------------------------------------------------------------------------------------------------------------------------------------- |
| **Refreshes** | Semantic model refresh failure, pipeline, notebook, Copy job or Dataflow Gen2 failure, a run much longer than average, tables with late data (Data Freshness), Fabric Mirroring issues |
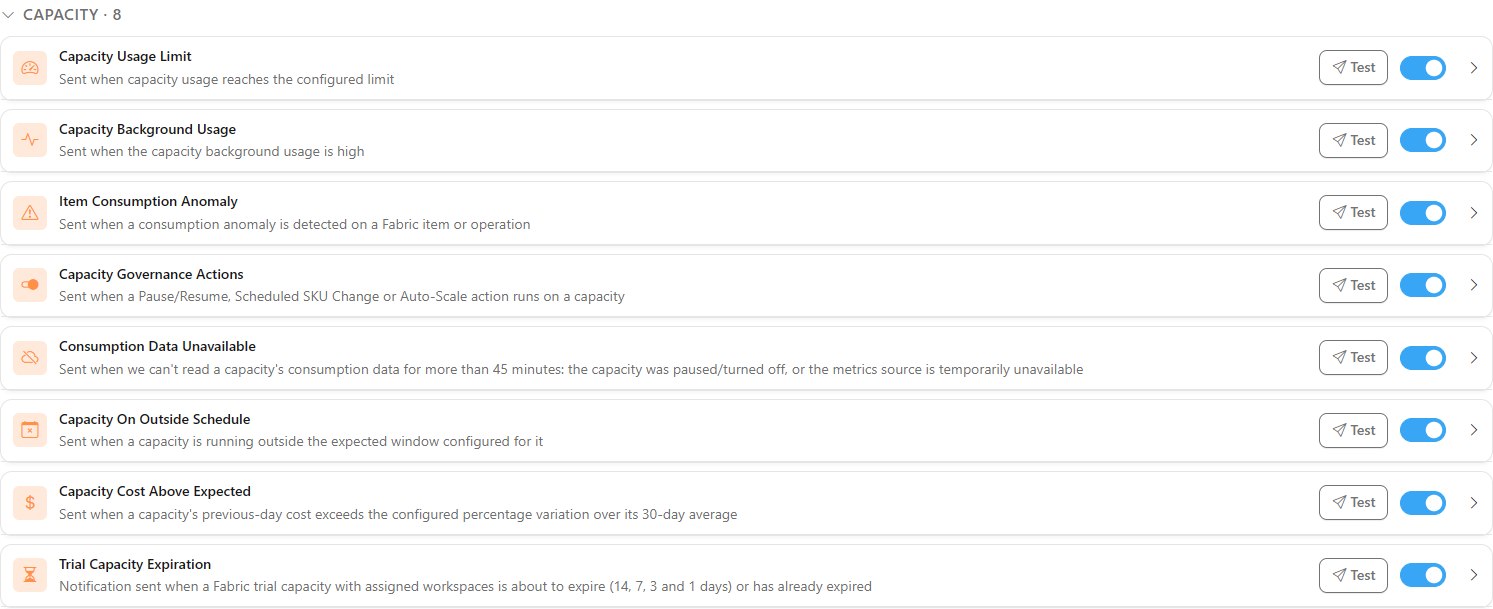
| **Capacity** | Capacity offline, total usage limit, background usage by level, consumption data unavailable, consumption anomaly by item, capacity running outside its schedule, trial capacity about to expire, pause, resume and scaling actions executed |
| **Cost** | Daily cost above the recent average, beyond the defined percentage |
| **Infrastructure** | Gateway offline |
| **Summaries** | Daily checklist and hourly checklist (sent only when there is something to report) and the **Alert Resolved** notice |
## Your way
* **Thresholds you define:** the total usage percentage that triggers the capacity alert, the Low, Medium, High and Critical levels for background usage, the cost variation that counts as unusual and the tolerance for each table in Data Freshness.
* **Criticality filters:** receive failures only from the most critical workspaces or items and leave the rest for the checklist.
* **Recipients per alert:** each alert type has its own list of recipients, and users scoped to specific workspaces only receive what belongs to them.
* **Notify the artifact's creator:** when a semantic model or Fabric item fails, the email can go straight to the person who maintains it, even if that person does not use Power Monitor.
* **Organization language and time zone:** emails and messages go out in your team's language and time zone.
Each alert with its own recipients and rules
## On the channels your team already uses
* **Email**, through the Power Monitor server or an SMTP account from your company;
* **Microsoft Teams**, **Slack** and **Telegram**;
* **Webhooks** and integrations with ITSM tools such as **ServiceNow**, **PagerDuty**, **Opsgenie** and **Azure DevOps**, so the alert automatically becomes a ticket.
## A real incident center
Every alert opens an **incident** in *Monitoring › Alerts*, which tracks the problem from start to finish:
* **Acknowledge, assign and comment**, so everyone knows who is handling it;
* **Mute** an item under maintenance and **escalate** whatever has gone too long without a response;
* **Correlation** of incidents with the same cause (for example, several refreshes failing because a gateway went down);
* **Investigate with AI** the likely cause;
* **Operational metrics:** mean time to acknowledge (**MTTA**), mean time to resolve (**MTTR**), recurrence and the sources that generate the most incidents.
## Related pages
* [Alerts (incident center)](/en/power-monitor/monitoramento/alertas.md)
* [Notifications](/en/power-monitor/configuracoes/notificacoes.md): who receives each alert, filters and thresholds
* [Alerts (channels)](/en/power-monitor/configuracoes/alertas.md): SMTP, Teams, Slack, Telegram, webhooks and ITSM
* [How does proactive monitoring work?](/en/perguntas-frequentes/duvidas-gerais/como-funciona-o-monitoramento-proativo.md)
---
# Agent Instructions
This documentation is published with GitBook. GitBook is the documentation platform designed so that both humans and AI agents can read, navigate, and reason over technical content effectively. Learn more at gitbook.com.
## Querying This Documentation
If you need additional information that is not directly available in this page, you can query the documentation by asking a question.
Perform an HTTP GET request on the following URL with the `ask` and `goal` query parameters:
```
GET https://docs.powermonitor.com.br/en/principais-funcionalidades/alertas-em-tempo-real.md?ask=&goal=
```
`ask` is the immediate question: it should be specific, self-contained, and written in natural language.
`goal` is what the user is ultimately trying to achieve, the reason they need the answer. Sharing it helps GitBook give you a better, more relevant answer. A goal is most helpful when it describes the outcome the user wants rather than restating the question. For example, with `ask=how do I create an API token`, a goal like `automate deployments from our CI pipeline` lets GitBook tailor the answer to that use case.
The response will contain a direct answer to the question and relevant excerpts and sources from the documentation.
Use this mechanism when the answer is not explicitly present in the current page, you need clarification or additional context, or you want to retrieve related documentation sections.