> For the complete documentation index, see [llms.txt](https://docs.powermonitor.com.br/llms.txt). Markdown versions of documentation pages are available by appending `.md` to page URLs; this page is available as [Markdown](https://docs.powermonitor.com.br/en/principais-funcionalidades/analise-de-performance.md).
# Performance Analysis
Power Monitor Performance Analysis: semantic model assessment cross-referenced with real capacity consumption, best practices, model cleanup, execution time and query diagnostics for Lakehouses and Wa
The capacity is at its limit and the same old question comes up: **scale up the SKU or optimize?** Without data, the answer tends to be the most expensive one. Power Monitor shows **where the weight is**, **why it is there** and **how much you gain** by fixing each point, across semantic models, Lakehouses and Warehouses.
## Semantic model Performance Assessment
VertiPaq Analyzer and Best Practice Analyzer show the **state** of the model. Power Monitor's Performance Assessment goes one step further: it cross-references that state with the model's **real Capacity Units consumption** on the capacity and with what Power Monitor already knows about it (refresh history, schedule, usage in reports, criticality) to tell you **what is worth optimizing first**.
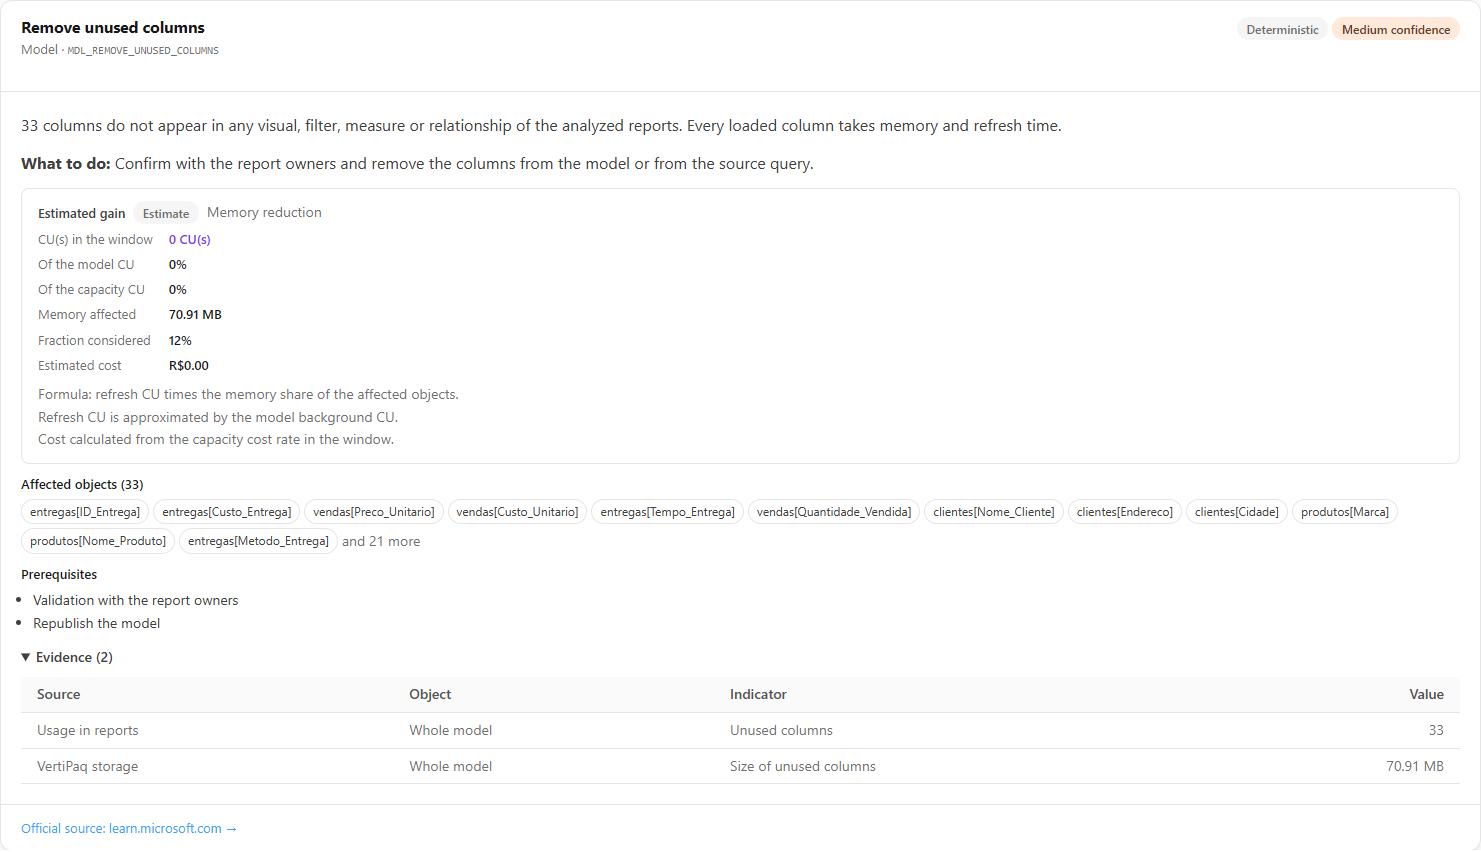
Every recommendation with estimated gain, evidence and official source
* **Recommendations prioritized by gain:** each one includes the estimated gain in CU, memory and cost, the affected objects, the evidence and the **official Microsoft source**.
* **VertiPaq storage:** largest tables and columns, cardinality, heavy text columns, auto date tables and columns that no report uses.
* **Capacity consumption:** how much of the capacity's CU the model accounts for and which operations (interactive and background) weigh the most.
* **History and export:** compare a model's 10 most recent assessments and export the report for the development team.
* **AI suggestion (optional):** with the organization's AI provider configured, generate an analysis in natural language.
{% hint style="success" %}
**No risk to your data:** the assessment reads only the model's **metadata** and capacity metrics. No customer values are queried and nothing is changed in the model.
{% endhint %}
## Best practices and model cleanup
* **Best Practices Score:** 55 modeling rules, such as bidirectional relationships, floating point, text keys and visible key columns.
* **AI Score:** the model's readiness for Copilot and natural language questions.
* **Model Cleanup:** the tables, columns and measures that no visual or filter uses, ready to remove to reduce memory and refresh time.
## Lakehouses and Warehouses: the diagnostics Fabric doesn't put together for you
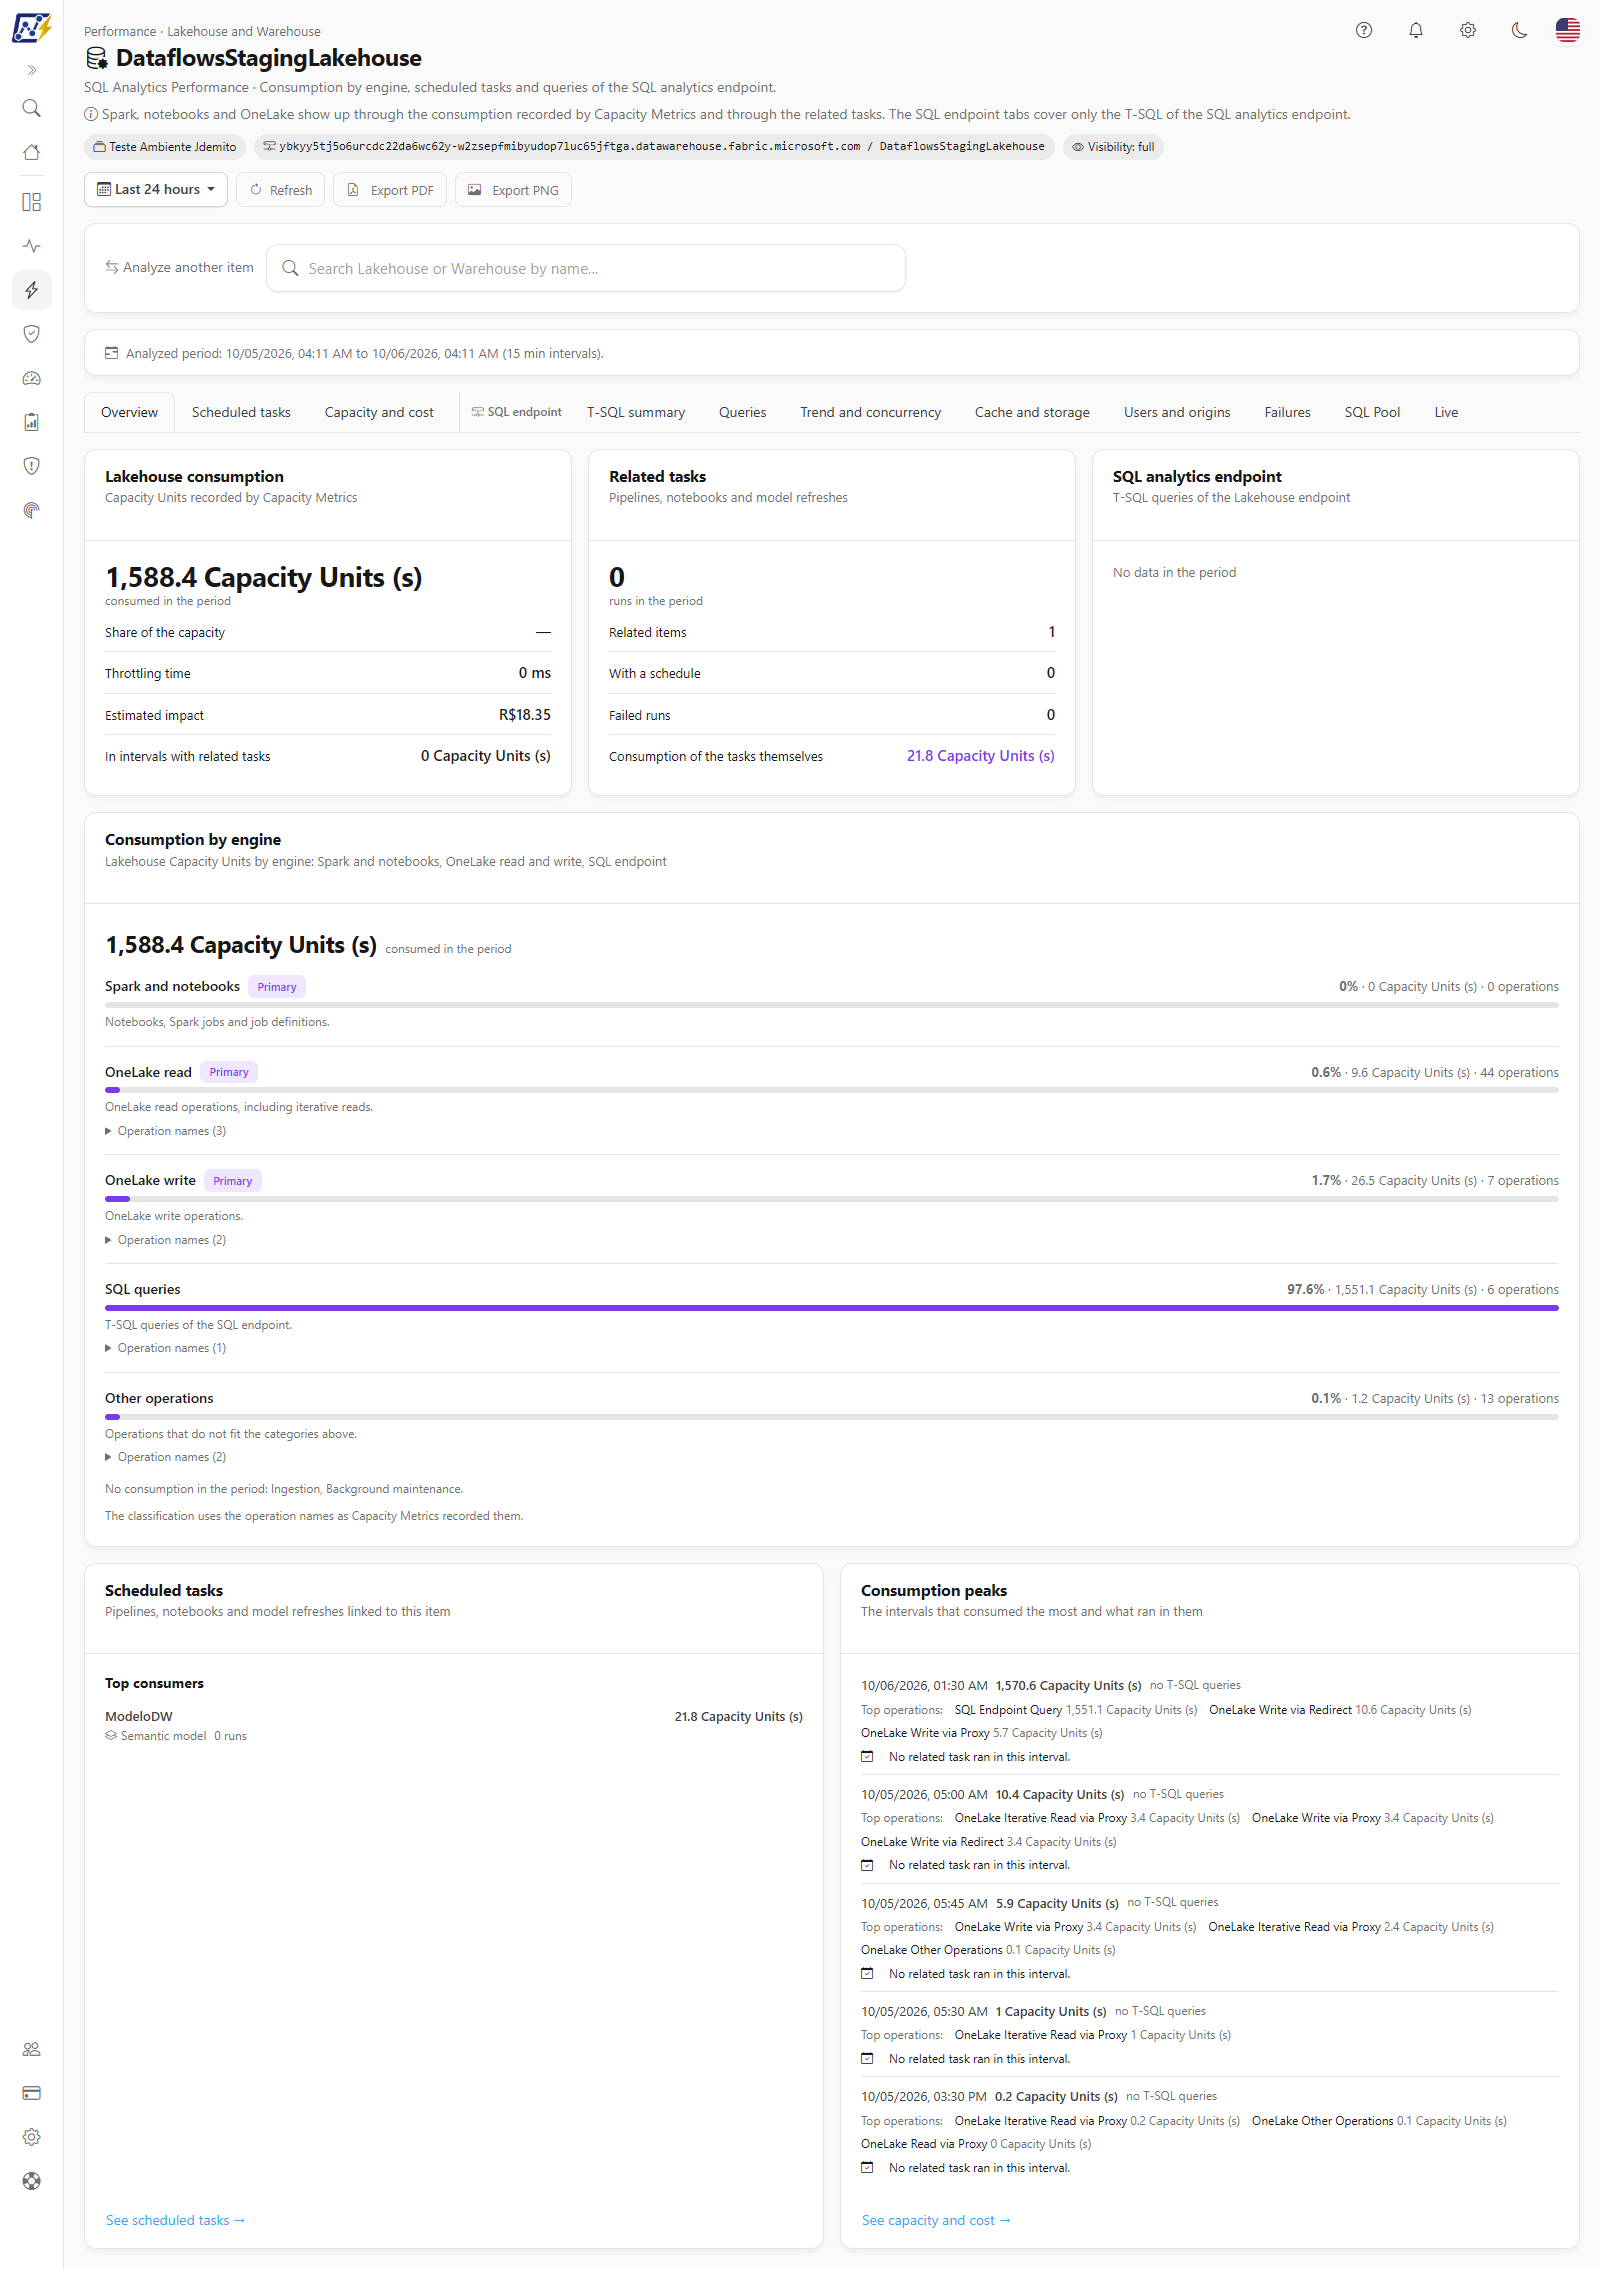
Pick a Lakehouse or Warehouse by name and open a complete diagnosis of the item's T-SQL queries:
* **Impact score** that ranks query patterns by their real weight (CPU, time, reads, failures and regression), so you tackle what matters most first;
* **Cause of slowness:** remote reads with a cold cache, CPU, SQL Pool pressure, concurrency, a regression in one query or "death by a thousand cuts";
* **Spike investigation:** select a range on the chart and see exactly what ran;
* **Who consumes:** the logins and applications that use the item the most and how many Capacity Units it spent;
* **Related tasks:** pipelines, notebooks, Dataflows Gen2, Copy Jobs and semantic models linked to the item, with schedules, runs and consumption.
Performance diagnosis of a Warehouse
## Execution time and consumption
* **Average Execution Time:** the average duration of semantic models, dataflows, notebooks and Copy jobs, with per-item limits and an alert when a run strays far from the average.
* **Consumption Metrics, Comparisons and Anomalies:** the items and operations that consume the most Capacity Units, comparisons between days or between entities, and what broke the pattern.
* **Efficiency Dashboard:** the consolidated view of the environment's efficiency.
## What you gain
* **Data-driven capacity decisions:** before scaling up the SKU, find out whether optimization solves the problem.
* **Less consumption, lower cost:** smaller models and better queries consume less CU and memory.
* **Faster reports:** the business user's experience improves along the way.
{% hint style="info" %}
Power Tuning offers specialized **report and model optimization** services to reduce Fabric capacity consumption. [Talk to our team](https://powermonitor.com.br/whatsapp).
{% endhint %}
## Related pages
* [Performance Assessment](/en/power-monitor/performance/avaliacao-de-performance.md)
* [Lakehouse and Warehouse](/en/power-monitor/performance/lakehouse-e-warehouse.md)
* [Model Cleanup](/en/power-monitor/performance/limpeza-de-modelo.md)
* [Average Execution Time](/en/power-monitor/performance/tempo-medio-de-execucao.md)
* [Best Practices Score (BPA)](/en/power-monitor/qualidade-de-dados/score-de-boas-praticas-bpa.md)
---
# Agent Instructions
This documentation is published with GitBook. GitBook is the documentation platform designed so that both humans and AI agents can read, navigate, and reason over technical content effectively. Learn more at gitbook.com.
## Querying This Documentation
If you need additional information that is not directly available in this page, you can query the documentation by asking a question.
Perform an HTTP GET request on the following URL with the `ask` and `goal` query parameters:
```
GET https://docs.powermonitor.com.br/en/principais-funcionalidades/analise-de-performance.md?ask=&goal=
```
`ask` is the immediate question: it should be specific, self-contained, and written in natural language.
`goal` is what the user is ultimately trying to achieve, the reason they need the answer. Sharing it helps GitBook give you a better, more relevant answer. A goal is most helpful when it describes the outcome the user wants rather than restating the question. For example, with `ask=how do I create an API token`, a goal like `automate deployments from our CI pipeline` lets GitBook tailor the answer to that use case.
The response will contain a direct answer to the question and relevant excerpts and sources from the documentation.
Use this mechanism when the answer is not explicitly present in the current page, you need clarification or additional context, or you want to retrieve related documentation sections.