> For the complete documentation index, see [llms.txt](https://docs.powermonitor.com.br/llms.txt). Markdown versions of documentation pages are available by appending `.md` to page URLs; this page is available as [Markdown](https://docs.powermonitor.com.br/en/principais-funcionalidades/custo-e-dashboards.md).
# Cost and Dashboards
Power Monitor Cost and Dashboards: real Azure cost of your capacities, allocation by workspace, item and user, reservations, budget, where to save and the executive dashboards for capacity, efficiency
"How much does Power BI cost each business area?" is a simple question that almost nobody can answer. The Azure invoice shows the cost of the whole capacity; the Capacity Metrics App shows consumption in Capacity Units. Nobody puts the two together.
Power Monitor does. And it turns cost into decisions.
## Capacity Cost dashboard
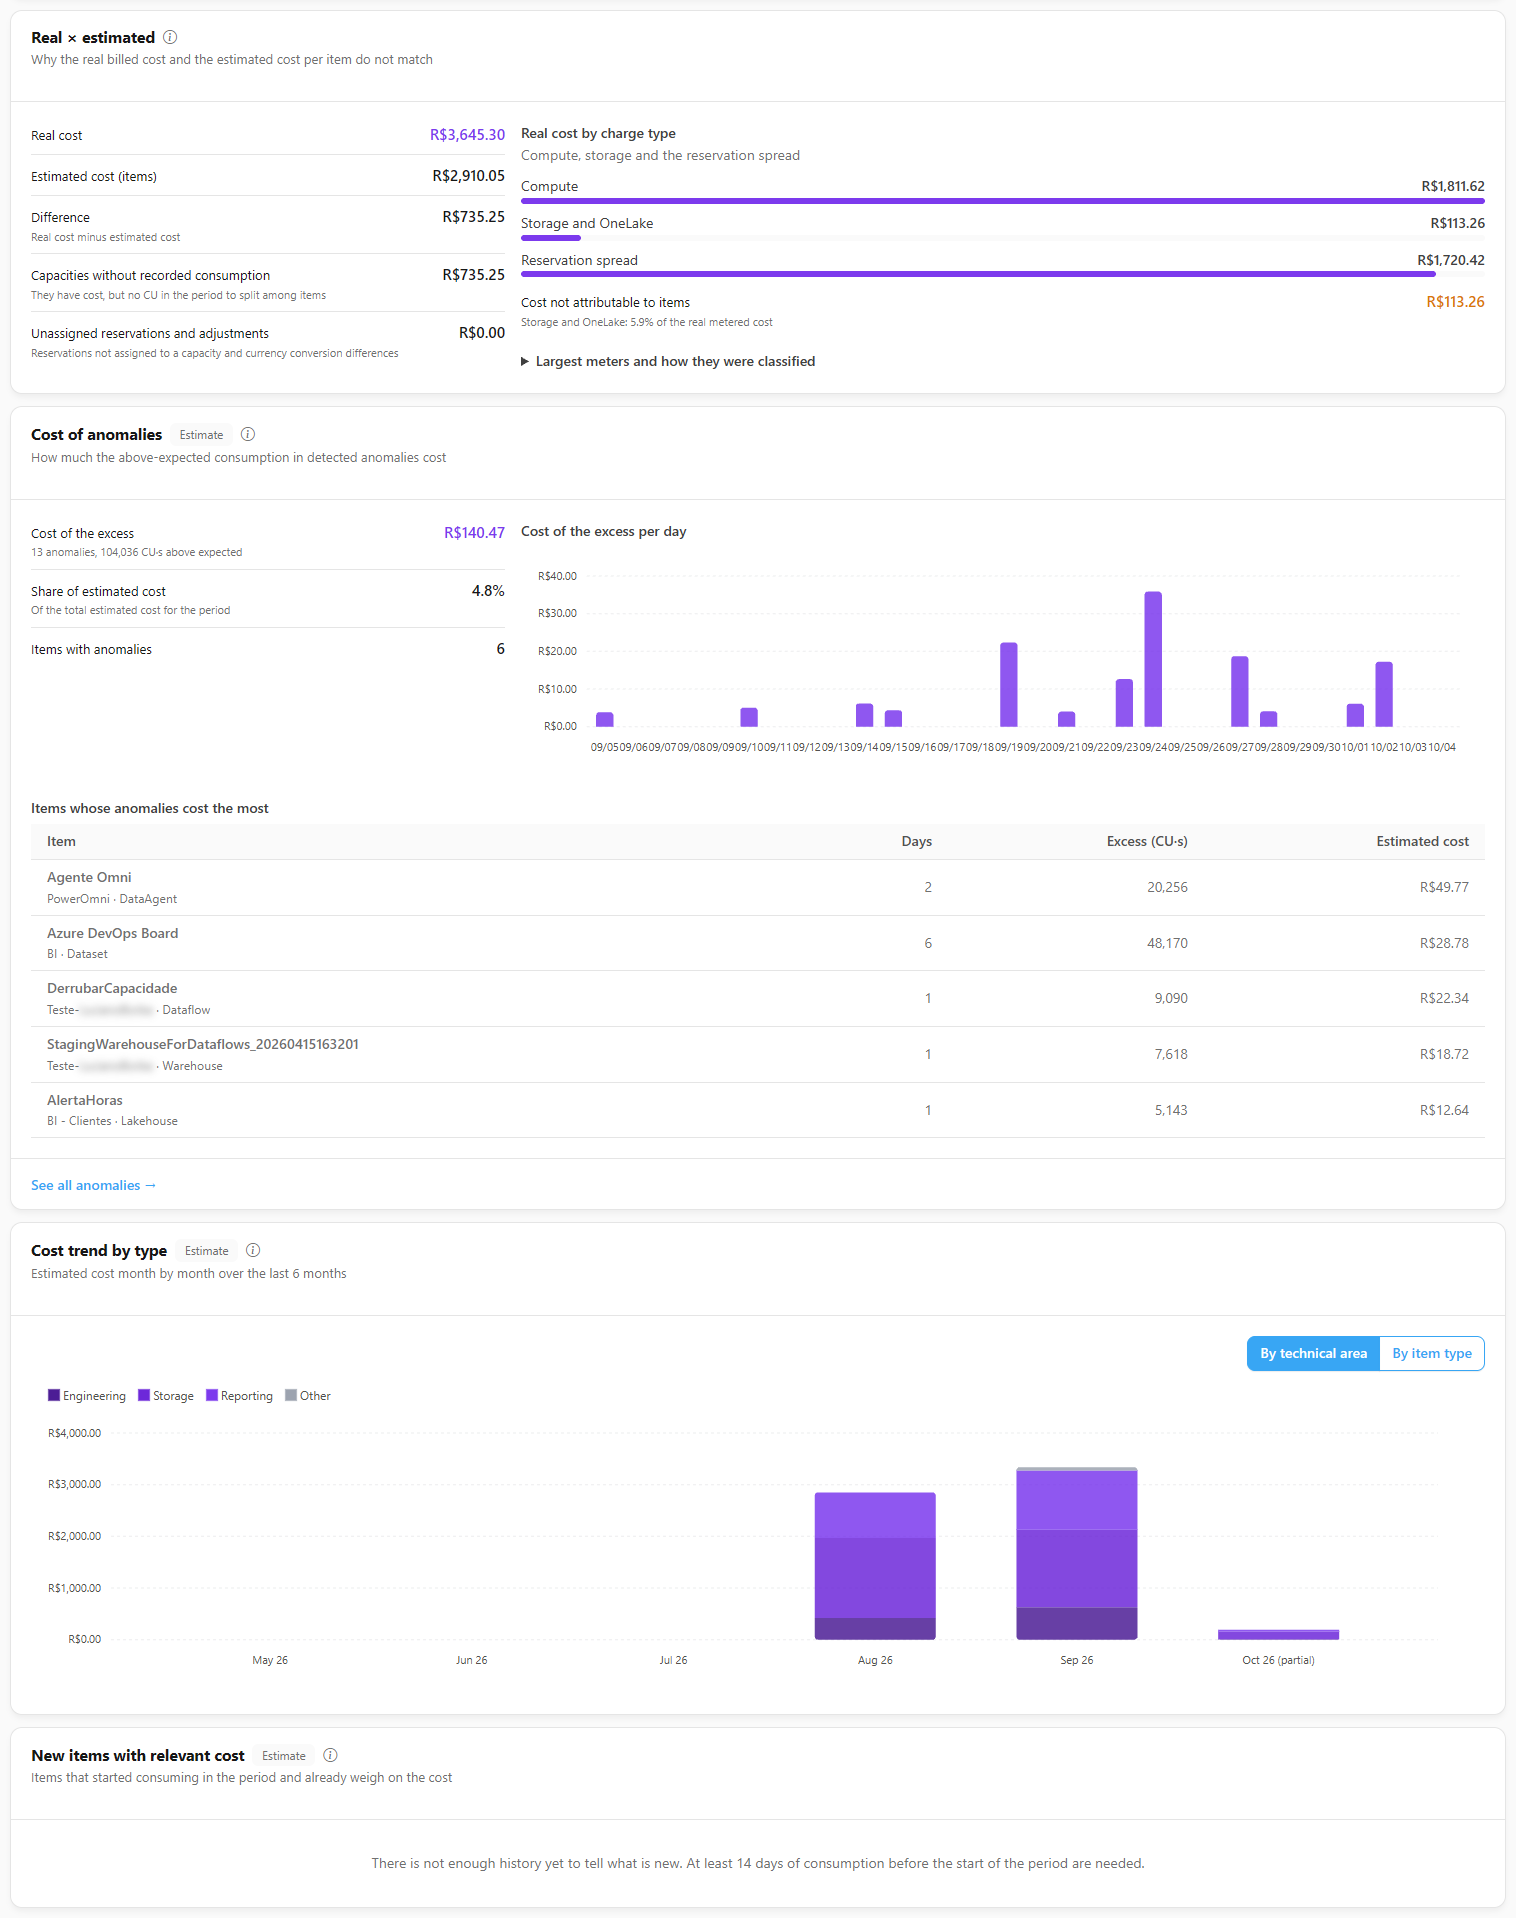
Capacity Cost: overview and analyses
* **Real cost, not an estimate:** the cost of each capacity read from Azure Cost Management, day by day and by meter (compute, storage and others), in your organization's currency.
* **Chargeback and showback:** the estimated cost of each **workspace**, **business area**, **item** and **user**, allocated by Capacity Units consumption. Every area sees what it costs.
* **Cost per view and cost of failures:** how much each access to a report costs and how much was spent on refreshes that failed.
* **Reservations under control:** which reservations are active, for which capacity, when they expire and how much of the actual usage they cover.
* **Budget and month close:** set the budget for each capacity, track the month close and see the projected cost for the next period.
* **Unattributed cost:** whatever cannot be allocated is shown separately, without distorting the numbers.
* **Cost alerts:** get an email when a day's cost exceeds the recent average by more than the threshold you set.
Monthly capacity budget
## Where to save
More than showing what you spend, the dashboard points to **what to do**:
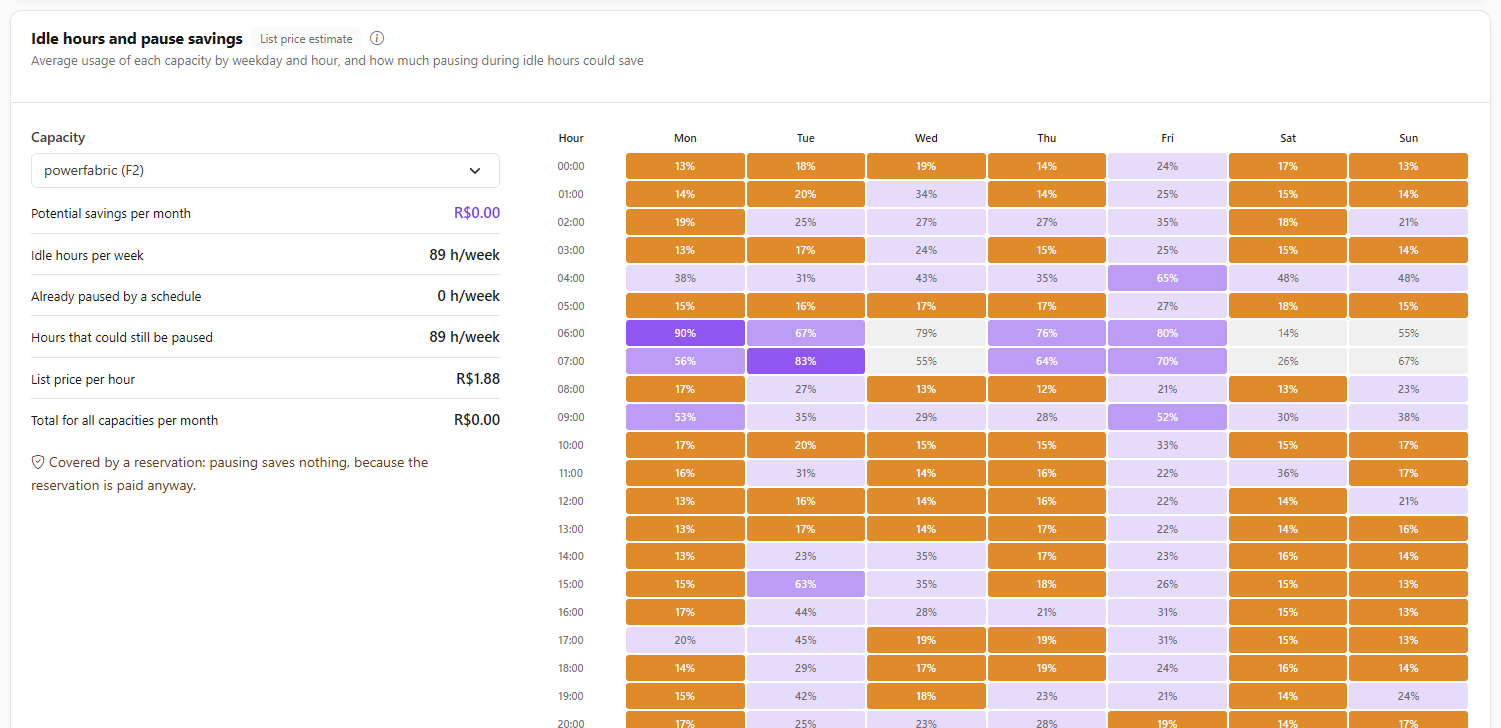
* **Idle hours:** the average usage of each capacity by day of the week and hour, and how much you could save by pausing during idle hours (taking into account what is already covered by a reservation).
* **SKU and business hours:** whether the capacity is oversized or could run only during the hours it is used.
* **Throttling risk:** where consumption gets close to the limit and the user experience is at risk.
* **Savings from automation:** how much Power Monitor's scheduled pauses and autoscale have already saved.
Idle hours and potential savings from pausing
{% hint style="info" %}
Real cost requires Power Monitor to have permission to read costs on the Azure subscriptions (the **Cost Management Reader** role), granted in a few clicks in *Settings › Additional Permissions*.
{% endhint %}
## The other dashboards
| Dashboard | For whom and for what |
| ------------------------------------------------------------------------------------- | ----------------------------------------------------------------------------------------------------------- |
| [Capacity Dashboard](/en/power-monitor/dashboards/dashboard-de-capacidade.md) | Executive view of capacity consumption and health, today versus yesterday, top consumers and AI explanation |
| [Capacity Overview](/en/power-monitor/dashboards/visao-geral-de-capacidades.md) | How workspaces, users, artifacts and growth are distributed across capacities |
| [Efficiency Dashboard](/en/power-monitor/dashboards/dashboard-de-eficiencia.md) | Where the environment wastes capacity and what to optimize |
| [Report Access Dashboard](/en/power-monitor/dashboards/dashboard-de-visualizacoes.md) | Adoption: who uses what, when and from where, and the reports nobody opens |
| [Permissions Dashboard](/en/power-monitor/dashboards/dashboard-de-permissoes.md) | Who has access to what, risk findings and access review |
| [Governance Dashboard](/en/power-monitor/dashboards/dashboard-de-governanca.md) | Inventory, governance metadata and points of attention in the environment |
| [Artifact Refreshes](/en/power-monitor/dashboards/atualizacoes-de-artefatos.md) | Health of model, pipeline, notebook and dataflow refreshes over time |
| [Monitoring Dashboard](/en/power-monitor/dashboards/dashboard-de-monitoramento.md) | A TV screen showing the real-time state of the environment for the operations team |
Executive dashboards, such as Capacity, Governance and Permissions, can be exported as PDF or PNG to take to your meeting.
## Why it matters
* **Real FinOps:** real cost, allocated to whoever consumes it, with budget and alerts.
* **Number-driven conversations with leadership:** every area knows how much it costs and why.
* **Savings that show up on the invoice:** pausing idle hours, right-sizing the SKU and making good use of reservations lowers the cost month after month.
## Related pages
* [Capacity Cost](/en/power-monitor/dashboards/custo-de-capacidade.md): every section, filter and alert, step by step
* [Capacity Governance](/en/principais-funcionalidades/governanca-de-capacidade.md): scheduled pause, resume and SKU changes, plus autoscale
* [Power BI Licenses](/en/principais-funcionalidades/licencas-power-bi.md)
---
# Agent Instructions
This documentation is published with GitBook. GitBook is the documentation platform designed so that both humans and AI agents can read, navigate, and reason over technical content effectively. Learn more at gitbook.com.
## Querying This Documentation
If you need additional information that is not directly available in this page, you can query the documentation by asking a question.
Perform an HTTP GET request on the following URL with the `ask` and `goal` query parameters:
```
GET https://docs.powermonitor.com.br/en/principais-funcionalidades/custo-e-dashboards.md?ask=&goal=
```
`ask` is the immediate question: it should be specific, self-contained, and written in natural language.
`goal` is what the user is ultimately trying to achieve, the reason they need the answer. Sharing it helps GitBook give you a better, more relevant answer. A goal is most helpful when it describes the outcome the user wants rather than restating the question. For example, with `ask=how do I create an API token`, a goal like `automate deployments from our CI pipeline` lets GitBook tailor the answer to that use case.
The response will contain a direct answer to the question and relevant excerpts and sources from the documentation.
Use this mechanism when the answer is not explicitly present in the current page, you need clarification or additional context, or you want to retrieve related documentation sections.