> For the complete documentation index, see [llms.txt](https://docs.powermonitor.com.br/llms.txt). Markdown versions of documentation pages are available by appending `.md` to page URLs; this page is available as [Markdown](https://docs.powermonitor.com.br/en/principais-funcionalidades/dados-atualizados.md).
# Truly up-to-date data
Data Freshness: Power Monitor checks inside the semantic model whether each table received new data on time and in the expected volume, and alerts IT and the business when it did not.
The refresh completed successfully. Monitoring is all green. And the sales director just asked why yesterday's sales are missing from the report.
It happens more often than you would think: the source load ran late, an upstream pipeline failed silently, a partition was not processed, a date filter cut off the new records. Power BI only knows that the refresh **ran**. It does not know whether the **data arrived**.
Power Monitor's **Data Freshness** answers the question the business is actually asking: **"is the newest data in this table recent enough?"**
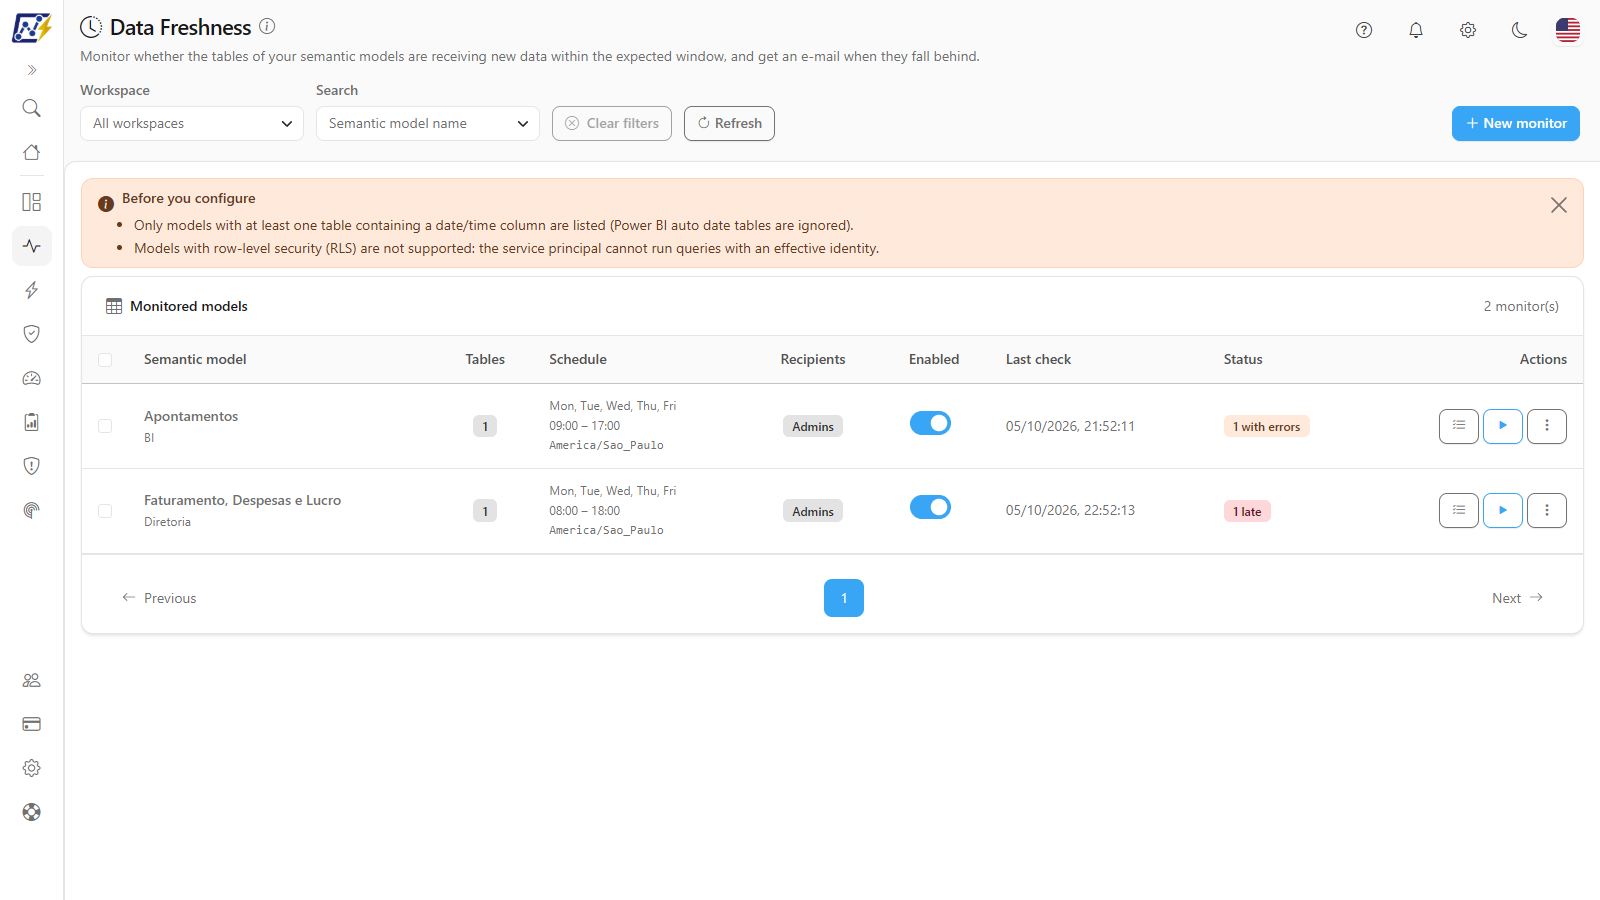
Each monitored table with its own deadline
## What it does
* **Watches table by table.** You choose the model, the tables, the date column of each one and the tolerance: "the sales fact table must have records from up to 1 hour ago during business hours", "the overnight load must be there by 7 a.m.".
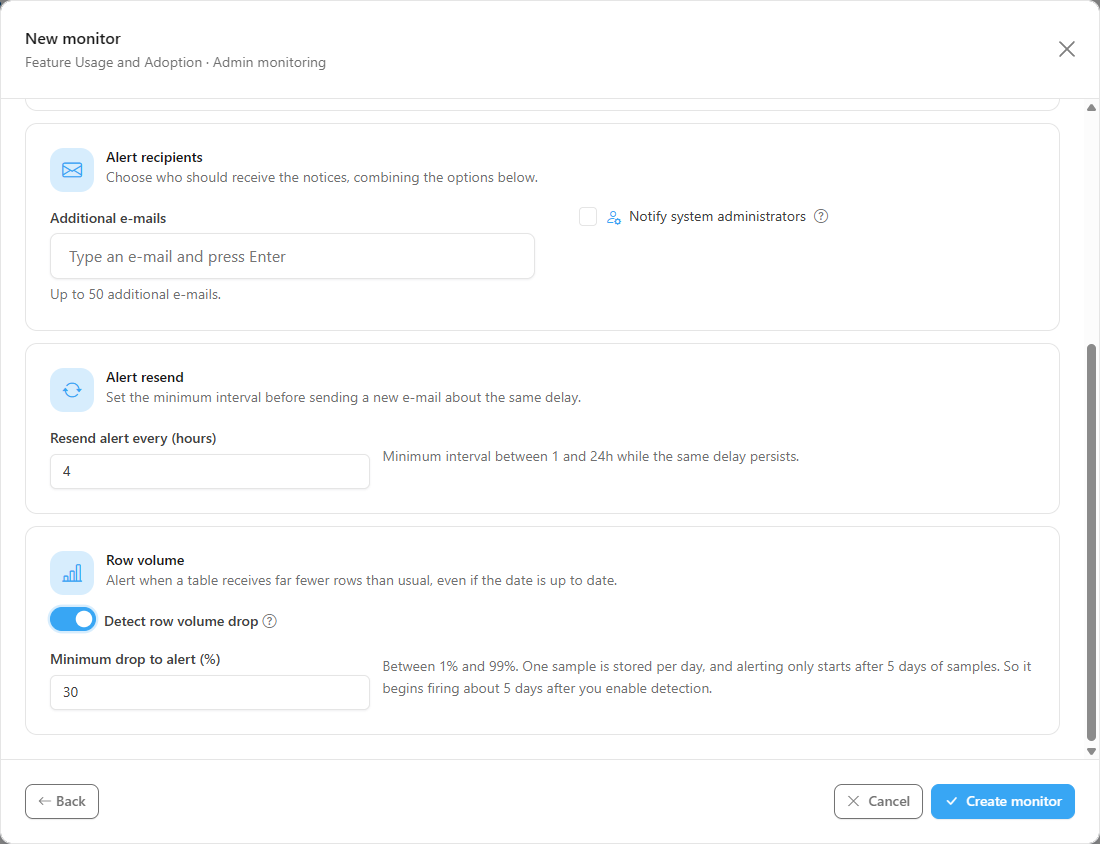
* **Detects incomplete loads.** With the optional **row count** check, you are alerted when a table receives far fewer rows than usual, even if the date is current.
* **Alerts the people who need to know.** The alert goes to IT and also to the business contacts registered on the workspace or the model, and is resent while the problem persists.
* **Runs on your schedule.** Each monitor has its own check schedule, and **Check now** (including in bulk) checks on the spot.
* **Diagnoses permissions.** If the query cannot read the model, the diagnostic tells you what is missing and offers to grant the Build permission with one click.
Check schedule and row count check
## Why it matters
* **Confidence in the numbers.** The business is warned before deciding on stale data, not after.
* **Fewer support tickets.** IT finds the delay before the user does and walks into the meeting with the cause, not with a surprise.
* **A faithful picture.** It complements run monitoring: [Semantic Models](/en/power-monitor/monitoramento/modelos-semanticos.md) and [Artifact Refreshes](/en/power-monitor/dashboards/atualizacoes-de-artefatos.md) show whether the refresh ran; Data Freshness shows whether the **result** is right.
{% hint style="info" %}
The check runs a lightweight query against the semantic model and may therefore consume a little of the capacity where it lives. The screen points this out when you create the monitor.
{% endhint %}
## Related pages
* [Data Freshness](/en/power-monitor/monitoramento/atualizacao-de-dados.md): create, edit and check monitors, step by step
* [Retry and failure investigation](/en/principais-funcionalidades/reprocessamento-de-falhas.md)
* [Custom alerts](/en/principais-funcionalidades/alertas-em-tempo-real.md)
---
# Agent Instructions
This documentation is published with GitBook. GitBook is the documentation platform designed so that both humans and AI agents can read, navigate, and reason over technical content effectively. Learn more at gitbook.com.
## Querying This Documentation
If you need additional information that is not directly available in this page, you can query the documentation by asking a question.
Perform an HTTP GET request on the following URL with the `ask` and `goal` query parameters:
```
GET https://docs.powermonitor.com.br/en/principais-funcionalidades/dados-atualizados.md?ask=&goal=
```
`ask` is the immediate question: it should be specific, self-contained, and written in natural language.
`goal` is what the user is ultimately trying to achieve, the reason they need the answer. Sharing it helps GitBook give you a better, more relevant answer. A goal is most helpful when it describes the outcome the user wants rather than restating the question. For example, with `ask=how do I create an API token`, a goal like `automate deployments from our CI pipeline` lets GitBook tailor the answer to that use case.
The response will contain a direct answer to the question and relevant excerpts and sources from the documentation.
Use this mechanism when the answer is not explicitly present in the current page, you need clarification or additional context, or you want to retrieve related documentation sections.