> For the complete documentation index, see [llms.txt](https://docs.powermonitor.com.br/llms.txt). Markdown versions of documentation pages are available by appending `.md` to page URLs; this page is available as [Markdown](https://docs.powermonitor.com.br/en/principais-funcionalidades/reprocessamento-de-falhas.md).
# Retry and failure investigation
Retry failed semantic model refreshes in bulk, with the error explained, the failure history of each model and a technical dossier with AI analysis.
Monday, 8 a.m. Twelve semantic models failed overnight because a data source password expired. In the Power BI portal, that means opening twelve models, reading twelve histories and clicking "Refresh now" twelve times, hoping you don't miss one.
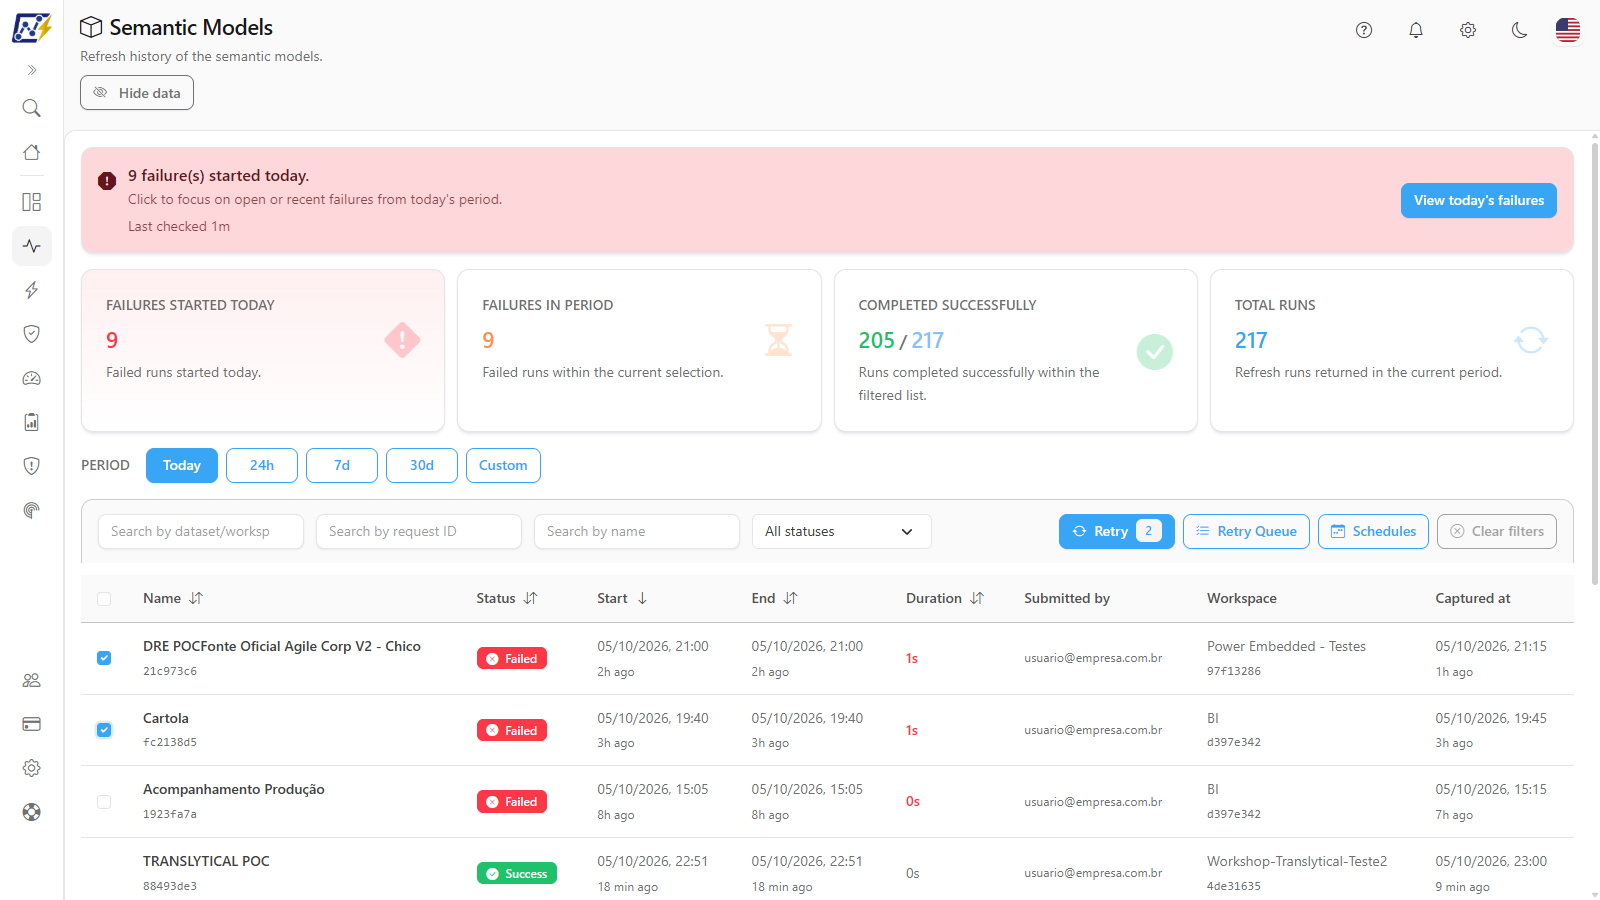
In Power Monitor, it takes three clicks: **view today's failures**, **select them all** and **Retry**.
All of the day's failures selected to retry at once
## Why this changes your routine
* **One screen for the entire environment.** Refreshes of every model in the monitored workspaces appear together, with a banner that answers the first question right away: "did anything fail today?".
* **Bulk retry, safely.** Power Monitor sends the selected models to a **retry queue** and triggers the new refreshes on behalf of the organization's service principal, respecting a limit of concurrent refreshes that you define (from 1 to 10) so the capacity is not overloaded. Models already in the queue are skipped, so nobody triggers the same refresh twice.
* **Tracked through to the end.** The **Retry Queue** shows each item until it reaches **Succeeded** or **Failed**, with no need to keep reloading the Power BI page.
* **The error explained, not just the code.** Each failure comes with an explanation of the error code (expired credential, unreachable gateway, timeout, capacity limit) and the model's recent failure history, so you know whether the problem is new or recurring.
## Investigate with AI: from the error to the cause
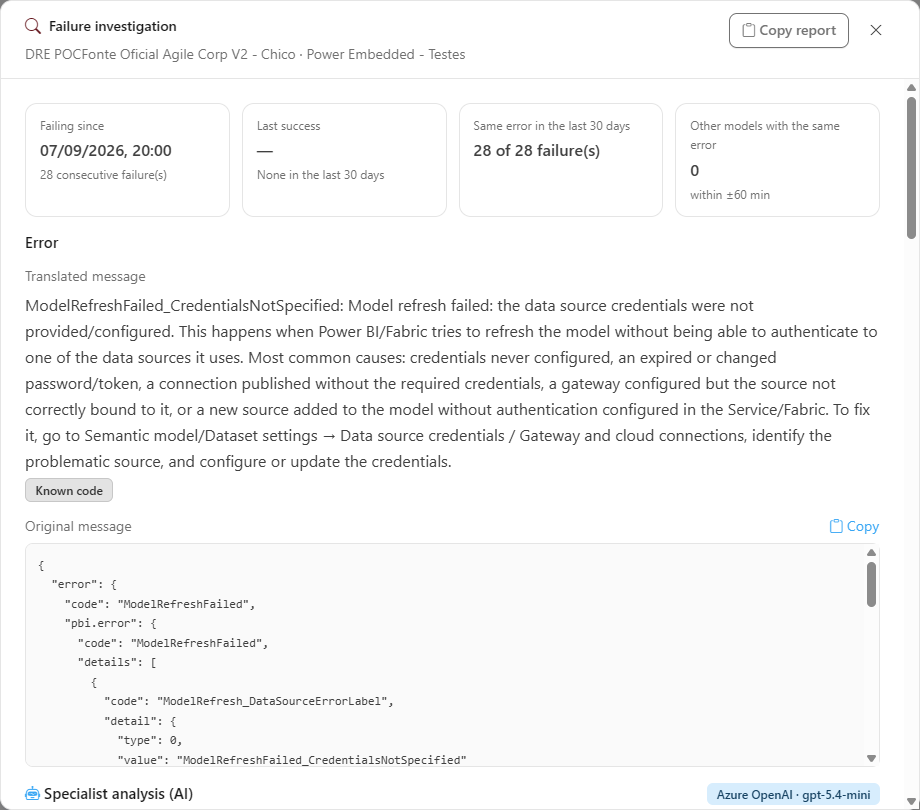
Right-click a failure and choose **Investigate**. Power Monitor builds a **technical dossier** with the model's history, the recurrence of the error, other models affected at the same time and the run identifiers you need to open a Microsoft support case. With the organization's AI provider configured, it also generates an **analysis of the likely cause and the next steps**.
Investigation dossier for a failure
## How it works in practice
1. Open *Monitoring › Semantic Models* and click **View today's failures**.
2. Read the error for each model. If the cause requires action (credential, gateway), fix it first.
3. Select the models (or **Select all failures**) and click **Retry**.
4. Follow the result in the **Retry Queue**.
{% hint style="info" %}
Retrying is restricted to Power Monitor **Administrators**. Every profile can follow the Retry Queue.
{% endhint %}
## Beyond semantic models
* **Fabric items:** failed pipelines, notebooks, Copy jobs and Dataflows Gen2 appear in *Monitoring › Fabric Items*, with the reason reported by Fabric and the same **Investigate** option.
* **Automatic alerts:** each failure opens an incident and notifies the people responsible by email, Teams, Slack, Telegram or webhook. See [Custom alerts](/en/principais-funcionalidades/alertas-em-tempo-real.md).
* **Truly up-to-date data:** when the refresh succeeds but the data never arrived, [Data Freshness](/en/principais-funcionalidades/dados-atualizados.md) steps in.
## Related pages
* [Semantic Models (Monitoring)](/en/power-monitor/monitoramento/modelos-semanticos.md): every screen and rule, step by step
* [Refresh retry (Settings › Organization)](/en/power-monitor/configuracoes/organizacao.md#refresh-retry): the limit of concurrent refreshes
* [Data Refresh Failures](/en/principais-funcionalidades/falhas-de-atualizacao.md)
---
# Agent Instructions
This documentation is published with GitBook. GitBook is the documentation platform designed so that both humans and AI agents can read, navigate, and reason over technical content effectively. Learn more at gitbook.com.
## Querying This Documentation
If you need additional information that is not directly available in this page, you can query the documentation by asking a question.
Perform an HTTP GET request on the following URL with the `ask` and `goal` query parameters:
```
GET https://docs.powermonitor.com.br/en/principais-funcionalidades/reprocessamento-de-falhas.md?ask=&goal=
```
`ask` is the immediate question: it should be specific, self-contained, and written in natural language.
`goal` is what the user is ultimately trying to achieve, the reason they need the answer. Sharing it helps GitBook give you a better, more relevant answer. A goal is most helpful when it describes the outcome the user wants rather than restating the question. For example, with `ask=how do I create an API token`, a goal like `automate deployments from our CI pipeline` lets GitBook tailor the answer to that use case.
The response will contain a direct answer to the question and relevant excerpts and sources from the documentation.
Use this mechanism when the answer is not explicitly present in the current page, you need clarification or additional context, or you want to retrieve related documentation sections.