> For the complete documentation index, see [llms.txt](https://docs.powermonitor.com.br/llms.txt). Markdown versions of documentation pages are available by appending `.md` to page URLs; this page is available as [Markdown](https://docs.powermonitor.com.br/en/readme/problemas-que-o-power-monitor-resolve.md).

# Problems Power Monitor solves

The most common pains of those who run and answer for Power BI and Microsoft Fabric, from stale data in a report to costs nobody owns, and how Power Monitor solves each one.

Whoever looks after **Power BI** and **Microsoft Fabric** usually learns about problems the hard way: a user complains, the bill comes in higher, an auditor asks something nobody can answer. The information exists, but it is scattered across workspaces, admin APIs, activity logs and the Azure portal.

**Power Monitor** puts those pieces together and turns each of these pains into an alert, a number or a list you can act on. Below are the problems it solves, organized by the questions that administrators, data leaders, finance managers and security teams ask every day. First come the eight most common pains. Then, more specific questions about cost, governance and security.

{% hint style="success" %}
**Want to see it in your environment?** The trial is free for 30 days, no credit card required. [Schedule a demo](https://powermonitor.com.br/apresentacao) or [install now](https://powermonitor.com.br/instalacao).
{% endhint %}

**On this page:** [Stale data](#a-user-told-me-the-report-had-stale-data) · [Capacity maxing out](#our-fabric-capacity-is-maxing-out-and-nobody-knows-who-is-using-it) · [Cost and who pays](#how-much-do-fabric-and-power-bi-cost-and-who-pays-the-bill) · [Inventory and orphans](#what-exists-in-the-tenant-who-owns-it-and-what-does-nobody-use) · [Who has access](#who-has-access-to-what-and-who-had-it-last-month) · [Governance and compliance](#governance-and-compliance-without-spreadsheets) · [Model performance](#why-is-this-model-slow-and-why-does-it-consume-so-much) · [Ready-made monitoring](#i-dont-have-time-to-build-and-maintain-my-own-monitoring) · [More questions about cost](#more-questions-about-cost) · [More questions about governance](#more-questions-about-governance) · [More questions about security](#more-questions-about-security) · [Get started](#get-started)

***

## "A user told me the report had stale data"

**For:** Power BI and Fabric administrators, data teams.

Without Power Monitor, a refresh that failed overnight only shows up when someone opens the report. It is even worse when the refresh succeeds and the data simply never arrives. Finding the cause means opening one workspace and one history after another.

**With Power Monitor:**

* [**Refresh failures**](/en/principais-funcionalidades/falhas-de-atualizacao.md) of semantic models, pipelines, notebooks, Copy jobs and Dataflows Gen2 become alerts within minutes, with the error explained. See also [Fabric Items](/en/power-monitor/monitoramento/itens-do-microsoft-fabric.md) and [Dataflow Monitoring](/en/principais-funcionalidades/monitoramento-de-dataflows.md).
* [**Retry**](/en/power-monitor/monitoramento/modelos-semanticos.md#retry-reprocess-failures) reprocesses every failed model in bulk, within the concurrent refresh limit you set.
* [**Investigate with AI**](/en/power-monitor/monitoramento/modelos-semanticos.md#investigate-a-failure-with-ai) builds a dossier with history, recurrence and other affected items, and suggests the likely cause.
* [**Truly up-to-date data (Data Freshness)**](/en/principais-funcionalidades/dados-atualizados.md) checks inside the model whether each table received new data on time and with the expected volume, and also notifies the business team.
* Offline [**Gateways**](/en/power-monitor/monitoramento/gateways.md) trigger an alert and a resolution notice. [**Data source credentials**](/en/power-monitor/monitoramento/credenciais-de-fontes-de-dados.md) are checked before refreshes start failing.
* [**Fabric Mirroring**](/en/power-monitor/monitoramento/fabric-mirroring.md) warns you when replication of mirrored databases stops, fails or falls behind.

[See how it works →](/en/principais-funcionalidades/reprocessamento-de-falhas.md)

***

## "Our Fabric capacity is maxing out and nobody knows who is using it"

**For:** capacity administrators, BI and data leaders.

Without Power Monitor, consumption lives in the Capacity Metrics App, checked only after users complain about slowness. Finding which workspace, item or person caused the 9 a.m. spike is manual detective work, and the throttling has already happened.

**With Power Monitor:**

* [**Capacity Monitoring**](/en/principais-funcionalidades/monitoramento-de-capacidades.md) reads consumption in Capacity Units every 5 minutes, separating interactive from background usage.
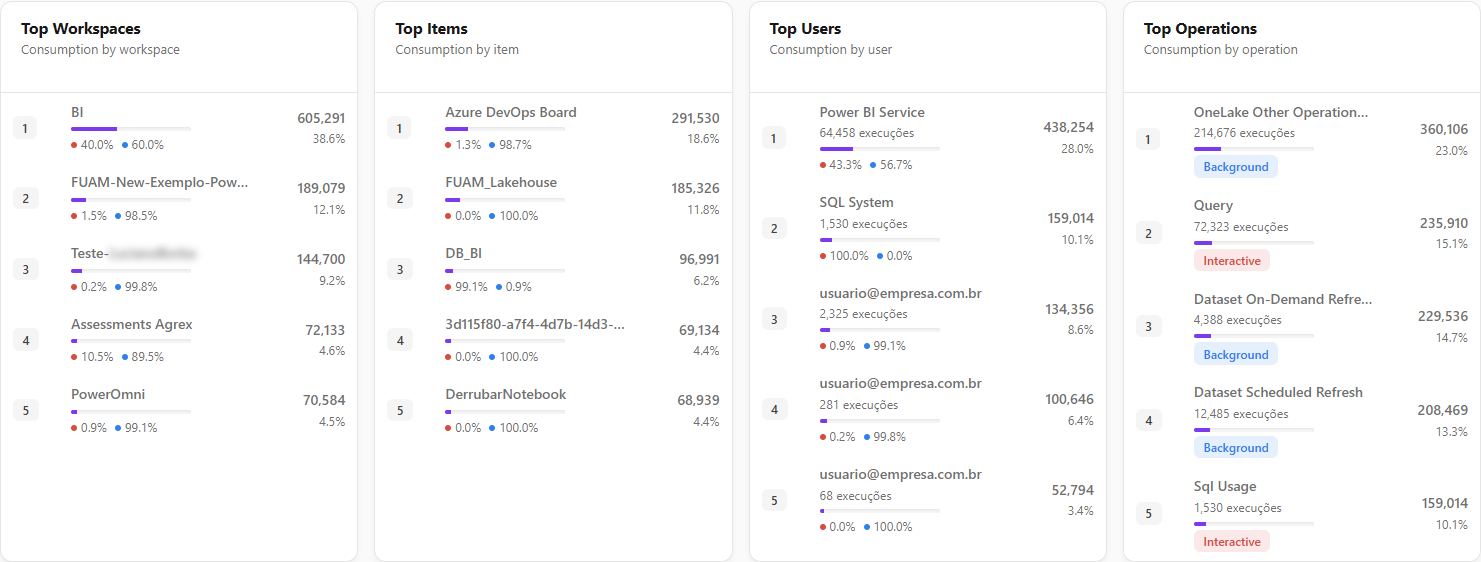
* [**Consumer rankings**](/en/power-monitor/dashboards/dashboard-de-capacidade.md#consumer-rankings) on the Capacity Dashboard show the workspaces, items, users and operations that consume the most, and the [**insight cards**](/en/power-monitor/dashboards/dashboard-de-capacidade.md#insight-cards) point out throttling by item and the saturation forecast.
* [**Consumption Anomalies**](/en/power-monitor/monitoramento/anomalias-de-consumo.md) detects items that consumed above their own baseline and warns you before they become an incident.
* [**Capacity usage alert limits**](/en/power-monitor/configuracoes/notificacoes.md#capacity-usage-alert-limits) are yours to set: the total usage limit and the Low, Medium, High and Critical background usage levels.
* [**Consumption Comparison**](/en/power-monitor/monitoramento/comparativo-de-consumo.md) and [**Entity Comparison**](/en/power-monitor/monitoramento/comparativo-por-entidade.md) tell you whether consumption changed between periods or between two workspaces, capacities or items.
* [**Capacity Governance**](/en/principais-funcionalidades/governanca-de-capacidade.md) pauses, resumes and changes the SKU on a schedule, with auto-scale and every action recorded in [**Capacity Actions**](/en/power-monitor/auditoria/acoes-de-capacidade.md).

<figure><picture><source srcset="/files/TLQ0N9xbVa1zff7eu8xy" media="(prefers-color-scheme: dark)"><img src="https://3938213054-files.gitbook.io/~/files/v0/b/gitbook-x-prod.appspot.com/o/spaces%2FH2bFRBmIfyK3kwVKbldl%2Fuploads%2Fgit-blob-94f257aaeb94f27426e1b1fbd4e853fa2205bcb8%2Fpm-dashboards-capacidade-rankings-en.png?alt=media" alt="Top Workspaces, Top Items, Top Users and Top Operations cards"></picture><figcaption><p>Who is using the capacity, with no manual investigation</p></figcaption></figure>

[See how to investigate a consumption peak →](/en/power-monitor/capacidades.md#investigating-a-consumption-peak)

***

## "How much do Fabric and Power BI cost, and who pays the bill?"

**For:** managers, CFOs, FinOps, data leaders.

Without Power Monitor, the Azure bill shows the cost of the whole capacity and Capacity Metrics shows consumption in Capacity Units. Combining the two to tell what each department costs ends up in a spreadsheet. And Pro and Premium Per User licenses assigned to people who don't use Power BI keep getting billed every month.

**With Power Monitor:**

* [**Capacity Cost**](/en/power-monitor/dashboards/custo-de-capacidade.md) shows the actual cost of each capacity, read from Azure Cost Management, day by day and in your organization's currency.
* **Allocation by** [**workspace**](/en/power-monitor/dashboards/custo-de-capacidade.md#workspace-cost)**,** [**item**](/en/power-monitor/dashboards/custo-de-capacidade.md#item-cost) **and** [**user**](/en/power-monitor/dashboards/custo-de-capacidade.md#user-cost), proportional to consumption, for chargeback and showback.
* [**Monthly budget**](/en/power-monitor/dashboards/custo-de-capacidade.md#monthly-budget) and [**Cost Alerts**](/en/power-monitor/dashboards/custo-de-capacidade.md#cost-alerts) warn you when a day goes off pattern.
* [**Where to save**](/en/power-monitor/dashboards/custo-de-capacidade.md#where-to-save-idle-hours-sku-business-hours-and-cost-per-cu) points out idle hours when the capacity could be paused and suggests the right SKU size.
* [**Power BI Licenses**](/en/power-monitor/governanca/tenant/licencas-power-bi.md#savings-opportunities) finds idle paid licenses, disabled accounts that still hold a license and licenses at the wrong tier, and calculates monthly and annual savings with your contract prices.
* [**Estimated savings with Power Embedded**](/en/power-monitor/governanca/tenant/licencas-power-bi.md#estimated-savings-with-power-embedded) shows what it would cost to move viewers to embedded reports.

[See how it works →](/en/principais-funcionalidades/custo-e-dashboards.md)

***

## "What exists in the tenant, who owns it and what does nobody use?"

**For:** administrators, data governance, BI leaders.

Without Power Monitor, the inventory is a periodic export through the Admin API or PowerShell scripts that is out of date the next day. Who is responsible for each item, what was deleted and what nobody has opened in months are questions with no quick answer.

**With Power Monitor:**

* [**Inventory**](/en/principais-funcionalidades/inventario-e-governanca.md) of workspaces, reports, semantic models, lakehouses, warehouses, notebooks, pipelines, capacities, gateways and connections, updated daily.
* [**Governance metadata**](/en/power-monitor/governanca/workspaces.md#governance-metadata) that Power BI doesn't have: technical and business owner, criticality and business area, with [**bulk editing**](/en/power-monitor/governanca/workspaces.md#bulk-governance-editing).
* [**Departed Owners**](/en/power-monitor/governanca/conformidade/responsaveis-desligados.md) finds workspaces, models and dataflows that depend on blocked or deleted accounts, before the refresh fails or the workspace is left without an admin.
* [**Deleted Artifacts**](/en/power-monitor/governanca/operacao/artefatos-excluidos.md) records what disappeared from the tenant and when the deletion was detected.
* [**Reports not accessed**](/en/power-monitor/dashboards/dashboard-de-visualizacoes.md#reports-not-accessed) separates what was never used from what stopped being used.
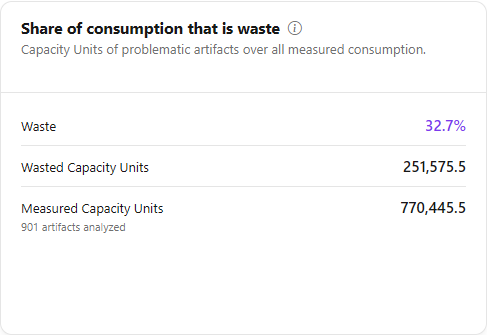
* [**Efficiency Dashboard**](/en/power-monitor/dashboards/dashboard-de-eficiencia.md) combines consumption and access to point out dead artifacts, ghost refreshes and over-refreshing.
* [**Data Lineage**](/en/power-monitor/qualidade-de-dados/linhagem-de-dados.md) shows the impact of changing a table before you touch it.

<figure><picture><source srcset="/files/3Gjj6gHLSP4B40M1TOPQ" media="(prefers-color-scheme: dark)"><img src="https://3938213054-files.gitbook.io/~/files/v0/b/gitbook-x-prod.appspot.com/o/spaces%2FH2bFRBmIfyK3kwVKbldl%2Fuploads%2Fgit-blob-f087384ff568c63317b98660b2557372deb388d1%2Fpm-dashboards-eficiencia-resumo-desperdicio-en.png?alt=media" alt="Three summary cards: share of consumption that is waste, current x previous period and estimated cost of waste"></picture><figcaption><p>How much of the capacity goes to artifacts nobody uses</p></figcaption></figure>

[See how it works →](/en/principais-funcionalidades/inventario-e-governanca.md)

***

## "Who has access to what? And who had it last month?"

**For:** information security, compliance, administrators.

Without Power Monitor, permissions are checked one workspace at a time, without expanding groups and without history. The activity log keeps events for a limited time and in a format that is hard to read. Answering an audit takes days.

**With Power Monitor:**

* [**Permissions Audit**](/en/power-monitor/auditoria/auditoria-de-permissoes.md) consolidates permissions on workspaces, items, gateways and connections, including access inherited from groups.
* [**Permission history**](/en/power-monitor/auditoria/historico-de-permissoes.md) reconstructs who had access to a workspace or artifact on a past date.
* [**Direct Sharing**](/en/power-monitor/auditoria/compartilhamento-direto.md) shows who accesses an item without having access to its workspace.
* [**Row-Level Security**](/en/power-monitor/auditoria/seguranca-em-nivel-de-linha.md) lists the RLS roles of each model, with findings such as roles without members or without a filter.
* [**Service Principals**](/en/power-monitor/auditoria/service-principals.md) reveals applications with direct permissions, highlighting write and admin access.
* [**Report Views**](/en/power-monitor/auditoria/visualizacoes-de-relatorios.md) answers who opened each report and from where, and [**E-mail Subscriptions**](/en/power-monitor/auditoria/assinaturas-de-e-mail.md) shows subscribers from external domains.
* [**Access reviews**](/en/power-monitor/governanca/conformidade/revisoes-de-acesso.md) runs campaigns in which owners confirm, person by person, who should keep their access.

[See how it works →](/en/principais-funcionalidades/auditoria-e-seguranca.md)

***

## "Governance and compliance without spreadsheets"

**For:** data governance, compliance, privacy, security.

Without Power Monitor, nobody notices when someone turns on "Publish to web" in the tenant, how many models hold personal data without a label or whether the naming convention is being followed. Compliance becomes a manual survey, rushed before every audit.

**With Power Monitor:**

* [**Tenant Settings**](/en/power-monitor/governanca/tenant/configuracoes-do-tenant.md) keeps the [**change history**](/en/power-monitor/governanca/tenant/configuracoes-do-tenant.md#change-history-tab) and compares each setting with the [**desired state**](/en/power-monitor/governanca/tenant/configuracoes-do-tenant.md#desired-state-tab) defined by your organization, warning you about drift.
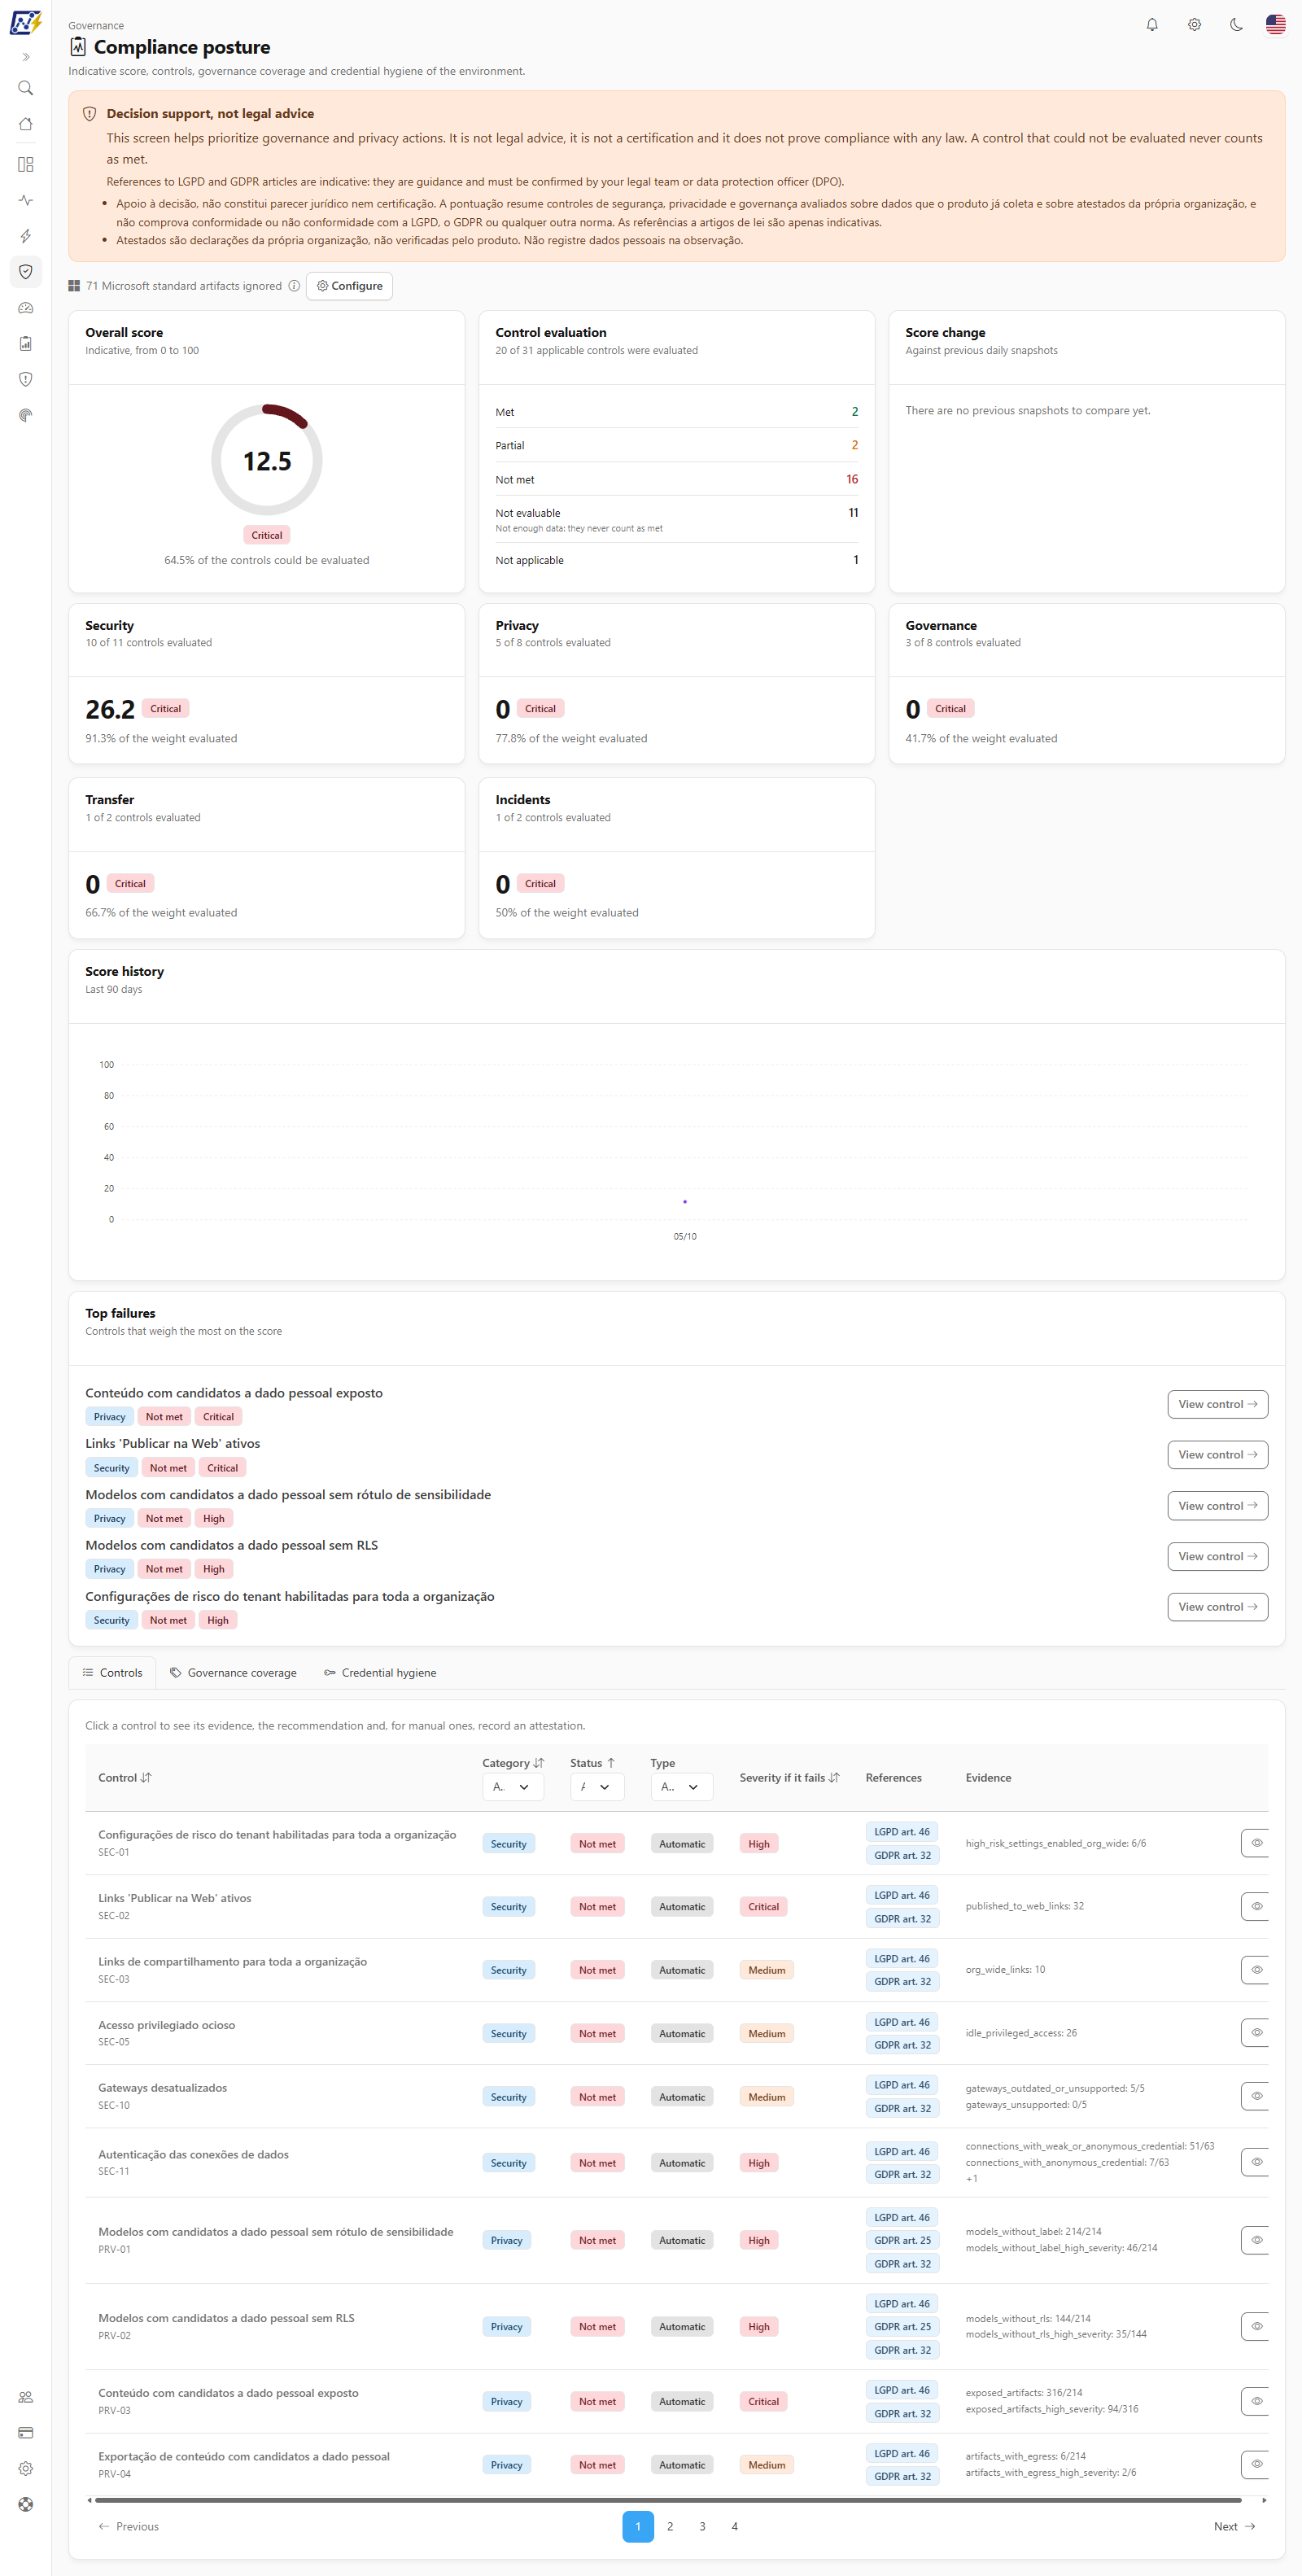
* [**Compliance posture**](/en/power-monitor/governanca/conformidade/postura-de-conformidade.md) scores your governance controls and shows the top failures and how to fix them.
* [**Personal data discovery**](/en/power-monitor/governanca/conformidade/descoberta-de-dados-pessoais.md) and [**Privacy risks**](/en/power-monitor/governanca/conformidade/riscos-de-privacidade.md) point out models with columns that look like personal data and cross them with label, RLS and exposure.
* [**Labels and Certification**](/en/power-monitor/governanca/conformidade/rotulos-e-certificacao.md) shows sensitivity label coverage, endorsement and exposed classified content.
* [**Public Links**](/en/power-monitor/governanca/conformidade/links-publicos.md) lists reports published to the web, and [**Data Exposure**](/en/power-monitor/qualidade-de-dados/exposicao-de-dados.md) finds passwords and tokens written in model code.
* [**Naming conventions**](/en/power-monitor/governanca/conformidade/convencao-de-nomes.md) checks item names against the rules you define.
* [**Behavioral risk**](/en/power-monitor/auditoria/risco-comportamental.md) calculates a daily, explainable score that flags changes in each person's usage pattern.

<figure><picture><source srcset="/files/x4dfSzEpuHu5mE05dC80" media="(prefers-color-scheme: dark)"><img src="https://3938213054-files.gitbook.io/~/files/v0/b/gitbook-x-prod.appspot.com/o/spaces%2FH2bFRBmIfyK3kwVKbldl%2Fuploads%2Fgit-blob-fc1c7ec73b2d3155e47d338670a1a0d963c4688c%2Fpm-governanca-postura-conformidade-en.png?alt=media" alt="Compliance posture screen with the overall score, the evaluation and change cards, the score history and the top failures"></picture><figcaption><p>Compliance posture: the score and what to fix first</p></figcaption></figure>

[See how it works →](/en/power-monitor/governanca/conformidade.md)

***

## "Why is this model slow and why does it consume so much?"

**For:** BI developers, data architects, BI leaders.

Without Power Monitor, analyzing a model takes external tools, one at a time, and the result doesn't connect to actual capacity consumption. Knowing whether today's run was slower than usual depends on someone looking.

**With Power Monitor:**

* [**Environment X-Ray**](/en/power-monitor/qualidade-de-dados/raio-x-do-ambiente.md) gives your environment's health a score from 0 to 100 and lists what to fix first.
* [**Best Practices Score**](/en/power-monitor/qualidade-de-dados/score-de-boas-praticas-bpa.md) evaluates models against 55 rules, and the [**Report Best Practices Score**](/en/power-monitor/qualidade-de-dados/score-de-boas-praticas-de-relatorios.md) does the same for reports.
* [**AI Score**](/en/power-monitor/qualidade-de-dados/score-de-ia.md) measures how ready a model is for Copilot and natural language questions.
* [**Performance Assessment**](/en/power-monitor/performance/avaliacao-de-performance.md) combines VertiPaq storage with actual Capacity Unit consumption and prioritizes recommendations backed by official Microsoft sources. For Fabric, see [**Lakehouse and Warehouse**](/en/power-monitor/performance/lakehouse-e-warehouse.md).
* [**Model Cleanup**](/en/power-monitor/performance/limpeza-de-modelo.md) finds tables, columns and measures that no report uses, without changing the model.
* [**Average Execution Time**](/en/power-monitor/performance/tempo-medio-de-execucao.md) flags models, pipelines, Copy jobs, dataflows and notebooks running slower than their history, and [**Model Size**](/en/power-monitor/mapeamento/tamanho-de-modelos.md) tracks each model's actual size day by day.

[See how it works →](/en/principais-funcionalidades/analise-de-performance.md)

***

## "I don't have time to build and maintain my own monitoring"

**For:** any team that has tried to stitch together scripts, the Admin API, homemade reports and alerts on its own.

Without Power Monitor, monitoring Power BI and Fabric properly means building and maintaining a whole project: collecting from the APIs, keeping history, handling request limits, building reports and alerts. Every change Microsoft makes means more maintenance.

**With Power Monitor:**

* [**Automatic Installation**](/en/readme/como-instalar-o-power-monitor/instalacao-automatica.md) guided by a wizard, 100% SaaS, [with no server, agent, VPN or firewall rule](/en/perguntas-frequentes/duvidas-gerais/quanto-tempo-demora-para-instalar.md#does-the-installation-require-any-infrastructure).
* [**Metadata only**](/en/perguntas-frequentes/duvidas-tecnicas/seguranca-e-privacidade.md): Power Monitor reads metadata and status through official Microsoft APIs and does not copy the business data in your reports.
* [**Alerts**](/en/power-monitor/configuracoes/alertas.md) by e-mail, Microsoft Teams, Slack and Telegram, and [**webhooks**](/en/power-monitor/configuracoes/alertas.md#webhooks-and-itsm) for ServiceNow, PagerDuty, Opsgenie and Azure DevOps.
* [**Incident center**](/en/power-monitor/monitoramento/alertas.md) with acknowledgment, assignment, silencing and [**MTTA and MTTR metrics**](/en/power-monitor/monitoramento/alertas.md#operations-metrics-mtta-mttr-and-reoccurrence), plus a monthly [**SLA Report**](/en/power-monitor/monitoramento/relatorio-de-sla.md) by e-mail.
* Read-only [**public API**](/en/power-monitor/configuracoes/webhooks-e-api-publica.md) with [**API keys**](/en/power-monitor/configuracoes/alertas.md#api-keys), to bring the data into your own tools.
* [**AI Assistant**](/en/power-monitor/assistente-de-ia.md) answers natural language questions about consumption, failures, permissions and access in your environment.
* [**Interface in five languages**](/en/power-monitor/interface-e-navegacao.md#language) (Portuguese, English, Spanish, Italian and Japanese) and [**works on mobile**](/en/perguntas-frequentes/duvidas-gerais/funciona-em-dispositivos-moveis.md).

[See how to install →](/en/readme/como-instalar-o-power-monitor.md)

***

## More questions about cost

Short answers to the cost questions that come up most often in Fabric and Power BI environments.

### "The capacity stayed on all night and nobody noticed"

A capacity turned back on by hand, or a scheduled pause that failed, means hours of billing with no use. The [**Schedule On/Off**](/en/power-monitor/governanca/infraestrutura/capacidades.md#schedule-onoff-tab) tab pauses and resumes the capacity at the times you set. [**Schedule Alerts**](/en/power-monitor/governanca/infraestrutura/capacidades.md#schedule-alerts-tab) sends an e-mail when it is running outside the expected window. [**Automation savings**](/en/power-monitor/dashboards/custo-de-capacidade.md#automation-savings) shows how much the pauses saved.

### "Are we paying for a bigger SKU than we need? Or a smaller one?"

An oversized SKU is money sitting idle. An undersized SKU turns into slowness. [**SKU sizing**](/en/power-monitor/dashboards/custo-de-capacidade.md#where-to-save-idle-hours-sku-business-hours-and-cost-per-cu) compares average, P95 and peak usage with the current SKU, suggests a size and shows the monthly difference. [**Throttling risk**](/en/power-monitor/dashboards/custo-de-capacidade.md#throttling-risk) points out the periods with usage above 100%. For predictable or sustained peaks, [**Schedule SKU Change**](/en/power-monitor/governanca/infraestrutura/capacidades.md#schedule-sku-change-tab) and [**Autoscale**](/en/power-monitor/governanca/infraestrutura/capacidades.md#autoscale-tab) pay for the larger SKU only when it is needed.

### "Is the reservation we bought being used?"

An underused reservation, or usage above it billed pay-as-you-go, is hard to spot on the invoice. [**Reservations**](/en/power-monitor/governanca/infraestrutura/capacidades.md#reservations) lists your Azure reservations, when they expire and what they cost. [**Reservation coverage**](/en/power-monitor/dashboards/custo-de-capacidade.md#capacity-cost-reservation-coverage) splits, day by day, what the reservation covered and the overage. [**Reservation vs actual usage**](/en/power-monitor/dashboards/custo-de-capacidade.md#reservation-vs-actual-usage) compares, hour by hour, the SKU the capacity ran on with the reserved CU and flags a reservation that is too small, too large or paid while the capacity was paused.

### "How much does each area and each owner cost?"

Showback stalls when cost only exists per capacity. [**Cost by owner**](/en/power-monitor/dashboards/custo-de-capacidade.md#workspace-cost-cost-by-owner) groups the estimated cost by the technical and business owners and by the criticality of the workspaces, and makes visible what still has no owner. [**Cost by department**](/en/power-monitor/dashboards/custo-de-capacidade.md#user-cost-by-department-and-per-active-user) adds up cost by the Entra ID department, without exposing individuals. The [**Monthly report by e-mail**](/en/power-monitor/dashboards/custo-de-capacidade.md#monthly-report-by-e-mail) takes the summary to managers who do not use the platform.

### "Will this month's cost close above forecast?"

The Azure invoice only confirms the overrun after the month is over. [**Month close**](/en/power-monitor/dashboards/custo-de-capacidade.md#capacity-cost-month-close-and-budget) shows the actual cost up to yesterday and the forecast for the end of the month, next to the previous month. [**Monthly budget**](/en/power-monitor/dashboards/custo-de-capacidade.md#monthly-budget) sends an e-mail when the cost or the forecast approaches the limit. [**Unattributed cost**](/en/power-monitor/dashboards/custo-de-capacidade.md#capacity-cost-unattributed-cost) reveals the cost of capacities nobody is tracking.

### "Which reports are expensive and almost nobody opens?"

A heavy model behind a rarely viewed report consumes capacity every day. [**Cost per view**](/en/power-monitor/dashboards/custo-de-capacidade.md#item-cost-cost-per-view-and-cost-of-failures) divides the estimated cost of each model by the number of times its reports were opened and lists the expensive, rarely viewed ones. In the same place, the cost of failed runs shows how much CU was spent without delivering a result.

### "Will the trial capacity expire and take the workspaces with it?"

A Fabric trial capacity expires and takes with it access to the content of the workspaces assigned to it. In [**Capacities**](/en/power-monitor/governanca/infraestrutura/capacidades.md#capacities-table), each trial capacity shows how many days are left, and a [**notice at the top of the pages**](/en/power-monitor/interface-e-navegacao.md#notices-at-the-top-of-the-pages) appears when 14 days or fewer remain. [**Change capacity in bulk**](/en/power-monitor/governanca/workspaces.md#change-capacity-in-bulk) moves the workspaces to another capacity in one go.

### "Do we have Azure quota for the new capacity or a larger SKU?"

Hitting the subscription quota delays buying a capacity or scaling up a SKU. [**Azure Quotas**](/en/power-monitor/governanca/infraestrutura/azure-quotas.md) shows the Fabric CU limit and usage per subscription and region, highlights the combinations with high usage and helps you [calculate the headroom](/en/power-monitor/governanca/infraestrutura/azure-quotas.md#how-to-check-whether-there-is-quota-for-a-new-capacity-or-a-larger-sku) before requesting an increase.

***

## More questions about governance

### "Who changed the tenant setting, and what changed?"

A setting such as "Publish to web" or external sharing can change without governance knowing. The [**Change History**](/en/power-monitor/governanca/tenant/configuracoes-do-tenant.md#how-to-investigate-a-setting-that-changed) shows the before and after of each setting, the groups added and removed and the likely author. The [**Desired state**](/en/power-monitor/governanca/tenant/configuracoes-do-tenant.md#how-to-define-the-desired-state-and-detect-drift-administrator) records what your organization expects from each setting and can warn you about drift.

### "Will this model change break the reports?"

A renamed column or a removed measure breaks visuals nobody reviewed. [**Model History**](/en/power-monitor/governanca/operacao/historico-de-modelos.md) records changes to tables, columns, measures and relationships, classifies their severity and compares versions. An administrator can turn on the [**alert on breaking changes**](/en/power-monitor/governanca/operacao/historico-de-modelos.md#alert-on-breaking-changes-card-administrator). Before changing anything, [**Data Lineage**](/en/power-monitor/qualidade-de-dados/linhagem-de-dados.md#how-to-assess-the-impact-of-changing-a-column) shows which models contain the column.

### "What stops working if I shut down this server or touch this Lakehouse table?"

Maintenance without an impact assessment turns into broken refreshes the next morning. [**Data Dictionary**](/en/power-monitor/qualidade-de-dados/dicionario-de-dados.md#how-to-assess-the-impact-of-server-maintenance) starts from the gateway, server, database or table and shows which models and reports use each object. In Fabric, it shows [who reads and writes each table](/en/power-monitor/qualidade-de-dados/dicionario-de-dados.md#how-to-find-out-who-reads-or-writes-a-lakehouse-table) of Lakehouses and Warehouses. [**Connections**](/en/power-monitor/governanca/infraestrutura/conexoes.md#how-to-find-out-the-impact-of-shutting-down-a-server) does the same starting from the data source.

### "Are Git and the deployment pipelines under control?"

Uncommitted work and forgotten pipelines make the development cycle hard to audit. [**Workspace Git**](/en/power-monitor/governanca/operacao/git-dos-workspaces.md) shows which workspaces are connected to Git and where there are uncommitted changes or conflicts. [**Deployment Pipelines**](/en/power-monitor/governanca/operacao/pipelines-de-implantacao.md) points out orphaned pipelines and empty stages. [**Deployment history**](/en/power-monitor/governanca/operacao/historico-de-deploys.md) records who ran each deployment, when, what changed and whether it succeeded.

### "Which workspaces have no administrator?"

A workspace without an active administrator has nobody to grant access or answer for it. The [**Permissions Dashboard**](/en/power-monitor/dashboards/dashboard-de-permissoes.md#risk-findings) counts workspaces without an administrator among its risk findings. [**Administration concentration**](/en/power-monitor/dashboards/dashboard-de-governanca.md#administration-concentration-card) in the Governance Dashboard also shows where there are too many administrators. When the administrator has left the company, [**Departed Owners**](/en/power-monitor/governanca/conformidade/responsaveis-desligados.md#how-to-resolve-a-workspace-without-an-active-administrator) shows how to fix it.

### "Who deleted this report, and when?"

The report is gone and nobody knows whether it was deleted, moved to another workspace or is just a missing permission. [**Deleted Artifacts**](/en/power-monitor/governanca/operacao/artefatos-excluidos.md#how-to-check-whether-a-report-was-deleted) confirms whether the item left the environment and when the deletion was detected. [**Events Overview**](/en/power-monitor/auditoria/geral-de-eventos.md#how-to-find-out-who-deleted-a-report) shows who deleted it in the activity log.

***

## More questions about security

### "Which guests from outside the company can change our content?"

Guest (B2B) accounts keep their access after the project ends, sometimes with write permission. The [**External**](/en/power-monitor/dashboards/dashboard-de-permissoes.md#external-tab) tab of the Permissions Dashboard lists guests by domain and access level, highlighting those with write access. The [**External tenant access**](/en/power-monitor/dashboards/dashboard-de-governanca.md#external-tenant-access-card) card does the same for the monitored workspaces, and [**Direct Sharing**](/en/power-monitor/auditoria/compartilhamento-direto.md#how-to-find-guests-with-direct-access) finds guests with access to items outside the workspace.

### "Which applications have write permission in our environment?"

Old integrations leave applications with access nobody remembers granting. [**Service Principals**](/en/power-monitor/auditoria/service-principals.md#how-to-find-third-party-applications-with-write-or-administration-access) highlights third-party applications with write or administration access and shows each grant. For an application nobody recognizes, follow the steps to [investigate an unknown application](/en/power-monitor/auditoria/service-principals.md#how-to-investigate-an-unknown-application) in Microsoft Entra ID.

### "Who exported data or downloaded a model?"

Exporting, downloading and printing are the most common ways for data to leave Power BI. The [**Critical Actions**](/en/power-monitor/auditoria/geral-de-eventos.md#critical-actions-shortcut) shortcut in Events Overview filters deletions, exports, sharing as an administrator and group membership changes. [**Privacy risks**](/en/power-monitor/governanca/conformidade/riscos-de-privacidade.md#the-six-cross-cuts) cross-references exports, downloads and prints with the models that appear to contain personal data.

### "Is this access from another country normal?"

A credential used in two places at the same time is rarely noticed in time. [**Access alerts**](/en/power-monitor/dashboards/dashboard-de-visualizacoes.md#access-alerts) show, over the last 7 days, new countries, distance jumps and simultaneous access from different IPs. The [**Cross-border access**](/en/power-monitor/governanca/conformidade/riscos-de-privacidade.md#cross-border-access) cross-cut in Privacy risks points out views of models with personal data made from outside the home countries.

### "Is sensitive content open to the whole organization?"

A "People in your organization" link gives access to any employee, including confidential reports. [**Organization-wide Links**](/en/power-monitor/governanca/conformidade/links-para-toda-a-organizacao.md) lists these links with the permission granted, who shared them and the sensitivity label. In [**Labels and Certification**](/en/power-monitor/governanca/conformidade/rotulos-e-certificacao.md#how-to-find-and-handle-exposed-classified-content), the Exposure card cross-references the label with Publish to web and organization-wide links.

### "Are models with sensitive data protected by RLS?"

A sensitivity label without row-level security lets every reader see every row. [**Row-Level Security**](/en/power-monitor/auditoria/seguranca-em-nivel-de-linha.md#how-to-find-models-with-classified-data-and-no-rls) points out labeled models without RLS, roles without members and roles without a filter, and helps you [measure RLS coverage](/en/power-monitor/auditoria/seguranca-em-nivel-de-linha.md#how-to-measure-rls-coverage) across the environment.

### "Are there passwords in connections and credentials written in model code?"

Password credentials with no privacy level are the most common weak spot in data sources. [**Connections**](/en/power-monitor/governanca/infraestrutura/conexoes.md#how-to-audit-connections-without-privacy-and-with-a-password) counts and lists connections with no privacy level and with Basic or Windows credentials. [**Data Exposure**](/en/power-monitor/qualidade-de-dados/exposicao-de-dados.md#how-to-handle-an-exposed-credential) finds tokens, passwords and keys in model code, always masked, and guides the rotation.

### "Who changed the settings of Power Monitor itself?"

The governance tool needs an audit trail too. [**Application Events**](/en/power-monitor/auditoria/eventos-da-aplicacao.md#how-to-find-out-who-changed-a-setting) records sign-ins, pages accessed, consents and configuration changes made in your organization, with the author of each one.

***

## Get started

Instead of finding out about problems from users, the bill or the auditors, find out first, with the data to decide.

<table data-view="cards"><thead><tr><th></th><th></th><th data-hidden data-card-target data-type="content-ref"></th></tr></thead><tbody><tr><td><strong>Schedule a presentation</strong></td><td>See Power Monitor in action in your scenario</td><td><a href="https://powermonitor.com.br/apresentacao">https://powermonitor.com.br/apresentacao</a></td></tr><tr><td><strong>Start a free trial</strong></td><td>30 days at no cost and no credit card</td><td><a href="https://powermonitor.com.br/instalacao">https://powermonitor.com.br/instalacao</a></td></tr><tr><td><strong>How the trial works</strong></td><td>What happens during the 30-day evaluation</td><td><a href="/en/perguntas-frequentes/licenciamento/como-funciona-o-trial-de-30-dias.md">How does the 30-day trial work?</a></td></tr><tr><td><strong>How much does it cost?</strong></td><td>Monthly fee based on the size of your environment</td><td><a href="/en/readme/quanto-custa-o-power-monitor.md">How much does Power Monitor cost?</a></td></tr></tbody></table>


---

# Agent Instructions
This documentation is published with GitBook. GitBook is the documentation platform designed so that both humans and AI agents can read, navigate, and reason over technical content effectively. Learn more at gitbook.com.

## Querying This Documentation
If you need additional information that is not directly available in this page, you can query the documentation by asking a question.

Perform an HTTP GET request on the following URL with the `ask` and `goal` query parameters:

```
GET https://docs.powermonitor.com.br/en/readme/problemas-que-o-power-monitor-resolve.md?ask=<question>&goal=<user_goal>
```

`ask` is the immediate question: it should be specific, self-contained, and written in natural language.
`goal` is what the user is ultimately trying to achieve, the reason they need the answer. Sharing it helps GitBook give you a better, more relevant answer. A goal is most helpful when it describes the outcome the user wants rather than restating the question. For example, with `ask=how do I create an API token`, a goal like `automate deployments from our CI pipeline` lets GitBook tailor the answer to that use case.

The response will contain a direct answer to the question and relevant excerpts and sources from the documentation.

Use this mechanism when the answer is not explicitly present in the current page, you need clarification or additional context, or you want to retrieve related documentation sections.