> For the complete documentation index, see [llms.txt](https://docs.powermonitor.com.br/llms.txt). Markdown versions of documentation pages are available by appending `.md` to page URLs; this page is available as [Markdown](https://docs.powermonitor.com.br/en/principais-funcionalidades.md).

# Key Features

What Power Monitor delivers that the Power BI admin portal does not: bulk retry of failed refreshes, truly up-to-date data, performance of models, lakehouses and warehouses, licenses, custom alerts, c

If you manage **Power BI** and **Microsoft Fabric**, you know the routine: going workspace by workspace hunting for failed refreshes, finding out from a business user that the report still shows yesterday's numbers, explaining to leadership why the capacity cost more this month and telling the auditors who had access to that report back in March. The Microsoft admin portal shows pieces of this story, scattered across screens, APIs and logs that nobody has time to cross-reference.

**Power Monitor** brings all of it into one place and goes further: it **detects the problem before your users do**, **explains the cause**, **tells you what to do** and, whenever possible, **fixes it with one click**. The result is less time firefighting, stronger governance and an environment you can explain and defend.

{% hint style="success" %}
**Try it in your own environment:** installation takes minutes and the trial is free for 30 days. [Install now](https://powermonitor.com.br/instalacao) or [schedule a demo](https://powermonitor.com.br/apresentacao).
{% endhint %}

## What you won't find in the Power BI portal

| Feature                                                                                        | What changes in your routine                                                                                |
| ---------------------------------------------------------------------------------------------- | ----------------------------------------------------------------------------------------------------------- |
| [Retry and failure investigation](/en/principais-funcionalidades/reprocessamento-de-falhas.md) | Retries failed refreshes in bulk and explains the cause of each error, without opening model after model    |
| [Truly up-to-date data (Data Freshness)](/en/principais-funcionalidades/dados-atualizados.md)  | Warns you when the refresh "succeeded" but the table did not receive new data                               |
| [Performance Analysis](/en/principais-funcionalidades/analise-de-performance.md)               | Diagnostics for semantic models, lakehouses and warehouses, cross-referenced with real capacity consumption |
| [Power BI Licenses](/en/principais-funcionalidades/licencas-power-bi.md)                       | Shows idle paid licenses, licenses at the wrong tier and how much you can save                              |
| [Custom alerts](/en/principais-funcionalidades/alertas-em-tempo-real.md)                       | Every alert goes to the right person, on the right channel, with thresholds and filters you define          |
| [Cost and Dashboards](/en/principais-funcionalidades/custo-e-dashboards.md)                    | Real Azure cost of your capacities, allocation by workspace, item and user, budget and where to save        |
| [Data Quality](/en/principais-funcionalidades/qualidade-de-dados.md)                           | Environment health score, lineage, model and report best practices and credentials exposed in code          |
| [Audit and Security](/en/principais-funcionalidades/auditoria-e-seguranca.md)                  | Who has and who had access to what, who viewed what and from where, and unusual behavior                    |

## Retry: refresh failures resolved in minutes

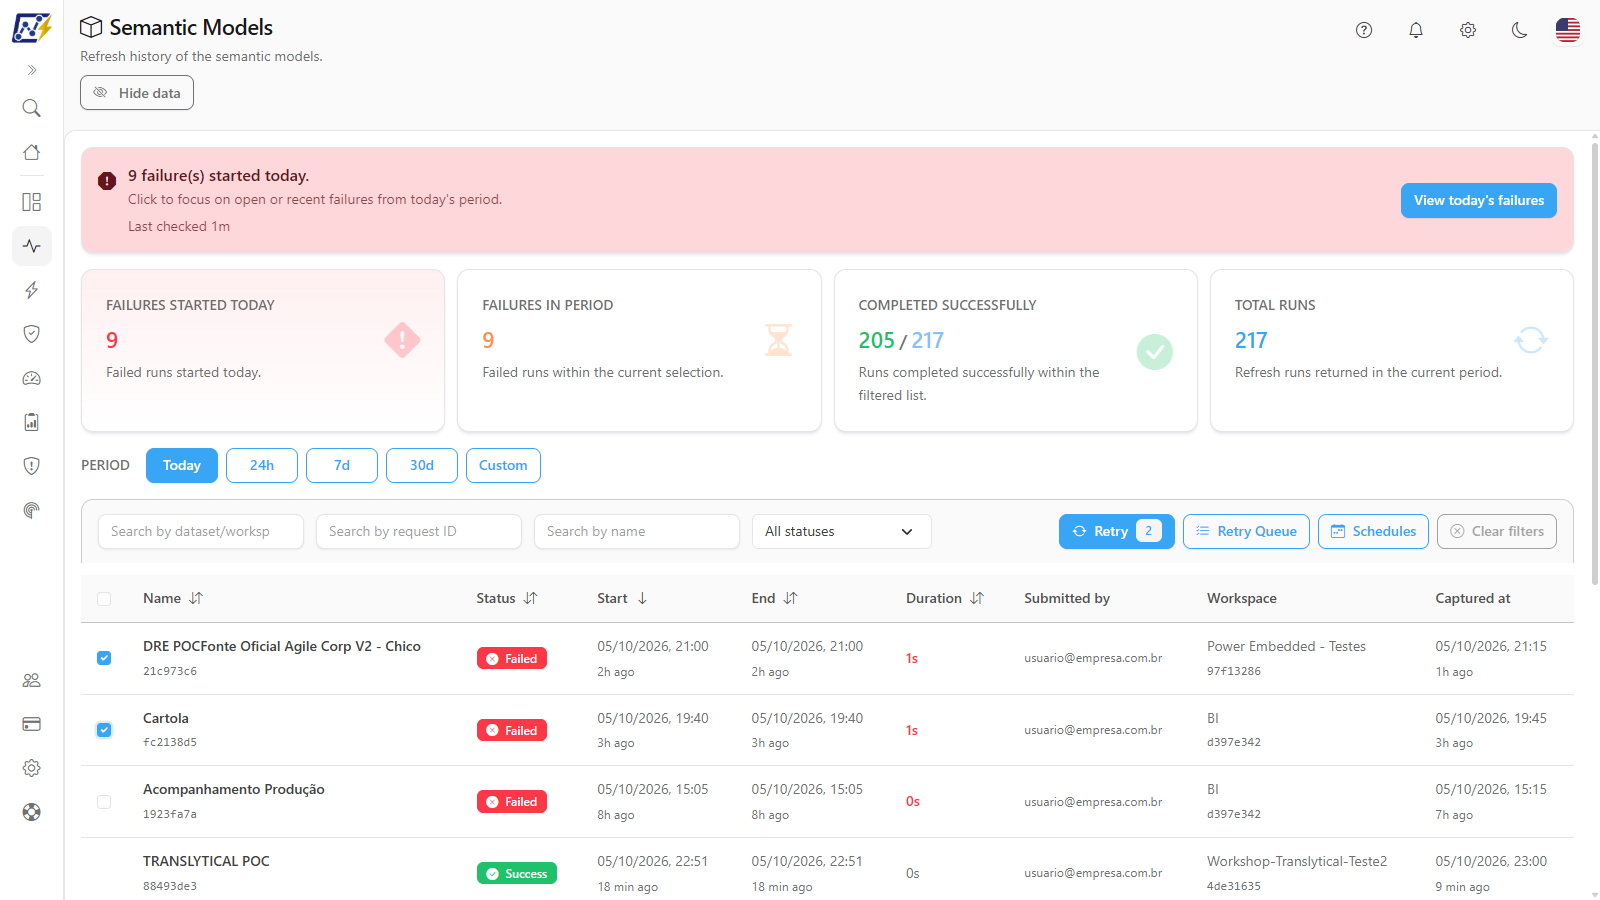
In Power BI, every failed refresh means a trip to the workspace, the model and its history. In Power Monitor, the day's failures appear in one place, with **the error explained in plain language** and the failure history of each model. Fixed the credential or brought the gateway back online? Select all the failed models and click **Retry**: Power Monitor retries them in bulk, respecting your organization's limit of concurrent refreshes, and follows each one through to the end.

<figure><picture><source srcset="/files/Hu0eISxI2IhAIcIU3Pqt" media="(prefers-color-scheme: dark)"><img src="https://3938213054-files.gitbook.io/~/files/v0/b/gitbook-x-prod.appspot.com/o/spaces%2FH2bFRBmIfyK3kwVKbldl%2Fuploads%2Fgit-blob-985517746bbdfb5194cd8c7c7239581db3396282%2Fpm-monitoramento-modelos-semanticos-selecao-modelos-com-falha-en.png?alt=media" alt="Failed semantic models selected for Retry"></picture><figcaption><p>The day's failures selected for bulk retry</p></figcaption></figure>

[Learn about retry and failure investigation →](/en/principais-funcionalidades/reprocessamento-de-falhas.md)

## Truly up-to-date data (Data Freshness)

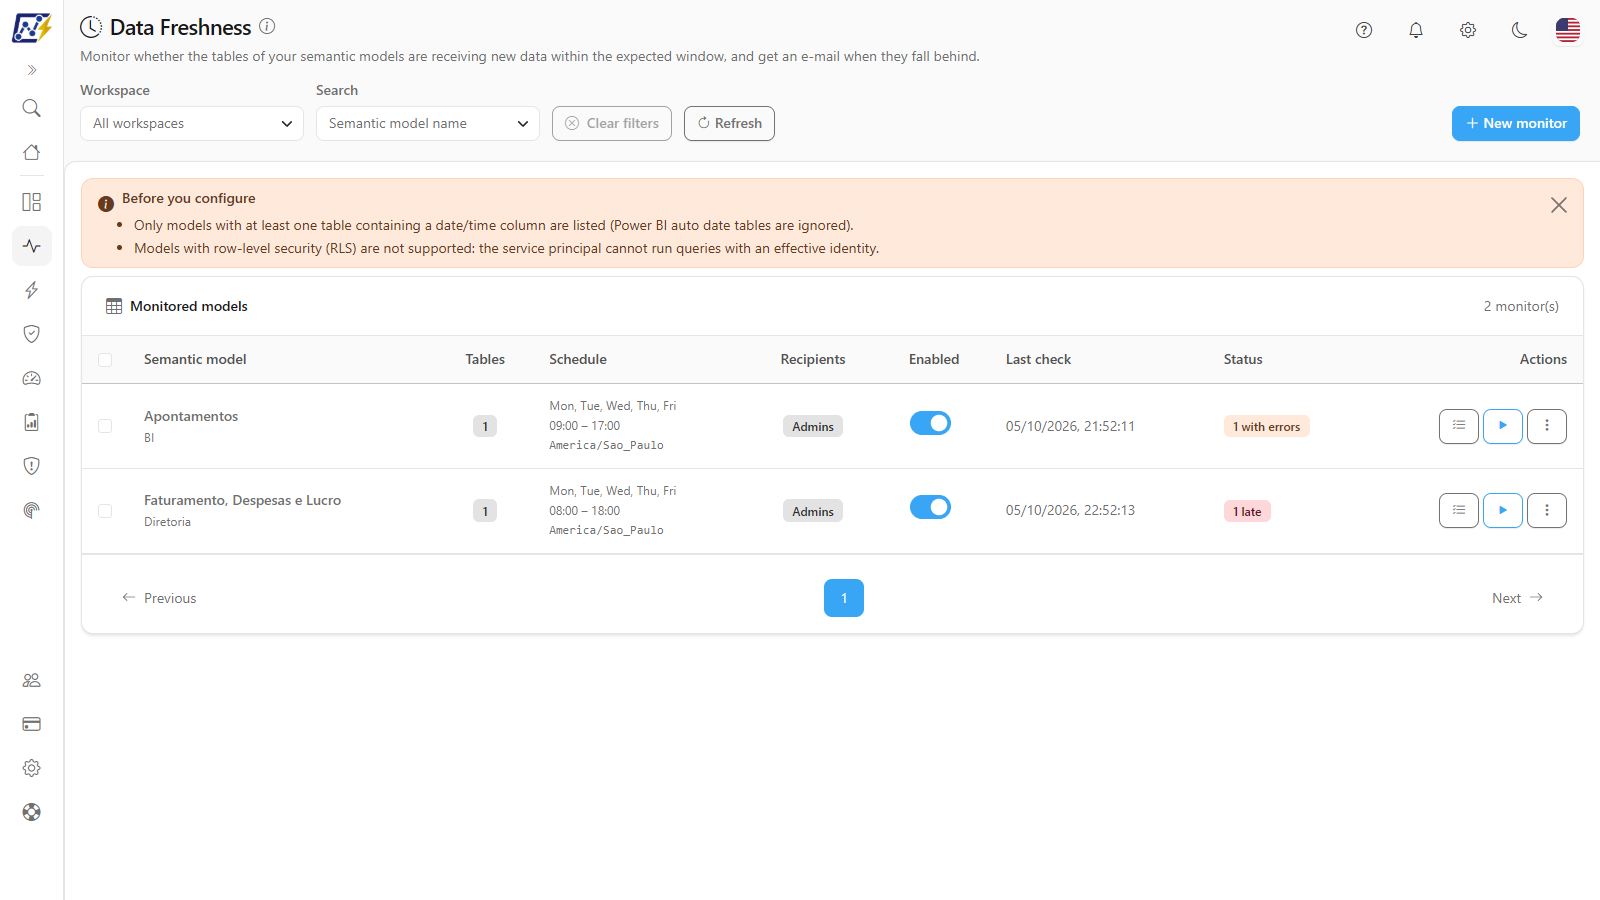
A refresh can finish **successfully** while the report still shows yesterday's numbers: the source did not load, a pipeline failed silently, a partition was left out. Power Monitor checks **inside the model** whether the most recent data in each table is within the deadline you set and whether the row count dropped, and alerts both IT and the business before anyone makes a decision on stale data.

<figure><picture><source srcset="/files/DBnTmia1OfMhPAQITSi6" media="(prefers-color-scheme: dark)"><img src="https://3938213054-files.gitbook.io/~/files/v0/b/gitbook-x-prod.appspot.com/o/spaces%2FH2bFRBmIfyK3kwVKbldl%2Fuploads%2Fgit-blob-760a640b725f15f6f421ffdc298f96c39600a490%2Fpm-monitoramento-atualizacao-dados-visao-geral-en.png?alt=media" alt="Data Freshness screen with the monitored models and the status of each table"></picture><figcaption><p>Data Freshness: the outcome of the refresh, not just the run</p></figcaption></figure>

[Learn about data freshness monitoring →](/en/principais-funcionalidades/dados-atualizados.md)

## Performance Analysis of models, lakehouses and warehouses

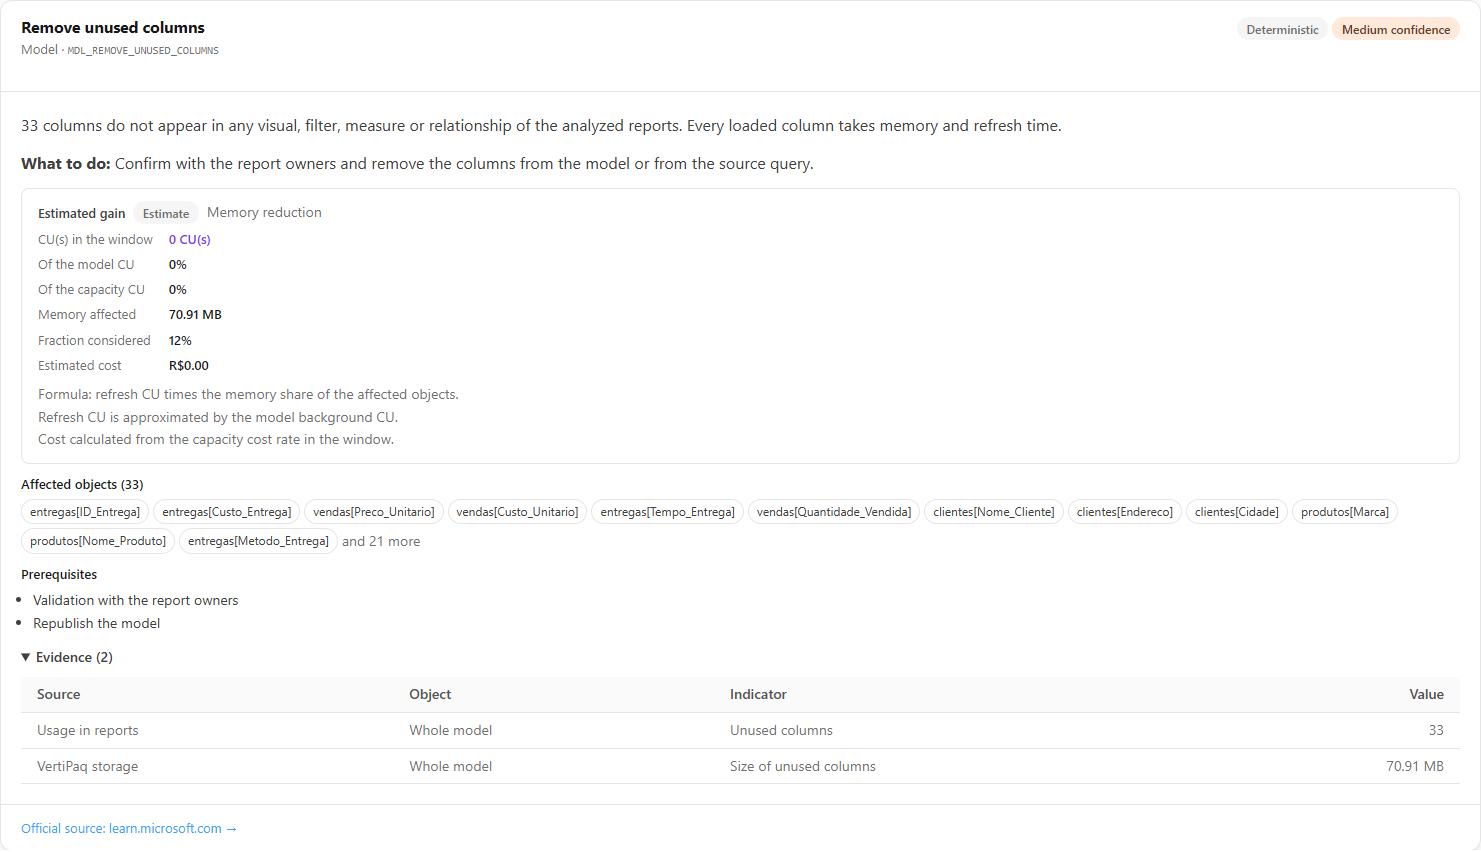
Tools such as VertiPaq Analyzer and Best Practice Analyzer show the state of the model. Power Monitor **cross-references that state with real Capacity Units consumption** and delivers recommendations prioritized by estimated gain, backed by the official Microsoft source. For **Warehouses** and **Lakehouses**, it shows the heaviest T-SQL queries, regressions, cold cache, SQL Pool pressure and who consumes what.

<figure><picture><source srcset="/files/gFDO8DF9X3cYtEDbI1ey" media="(prefers-color-scheme: dark)"><img src="https://3938213054-files.gitbook.io/~/files/v0/b/gitbook-x-prod.appspot.com/o/spaces%2FH2bFRBmIfyK3kwVKbldl%2Fuploads%2Fgit-blob-f9f470b82369887b55822180f0b7e31ee1af6a02%2Fpm-monitoramento-avaliacao-performance-recomendacao-evidencias-en.png?alt=media" alt="Performance Assessment recommendation with estimated gain, affected objects and evidence"></picture><figcaption><p>Recommendation with estimated gain, evidence and official source</p></figcaption></figure>

[Learn about Performance Analysis →](/en/principais-funcionalidades/analise-de-performance.md)

## Power BI Licenses: stop paying for people who don't use them

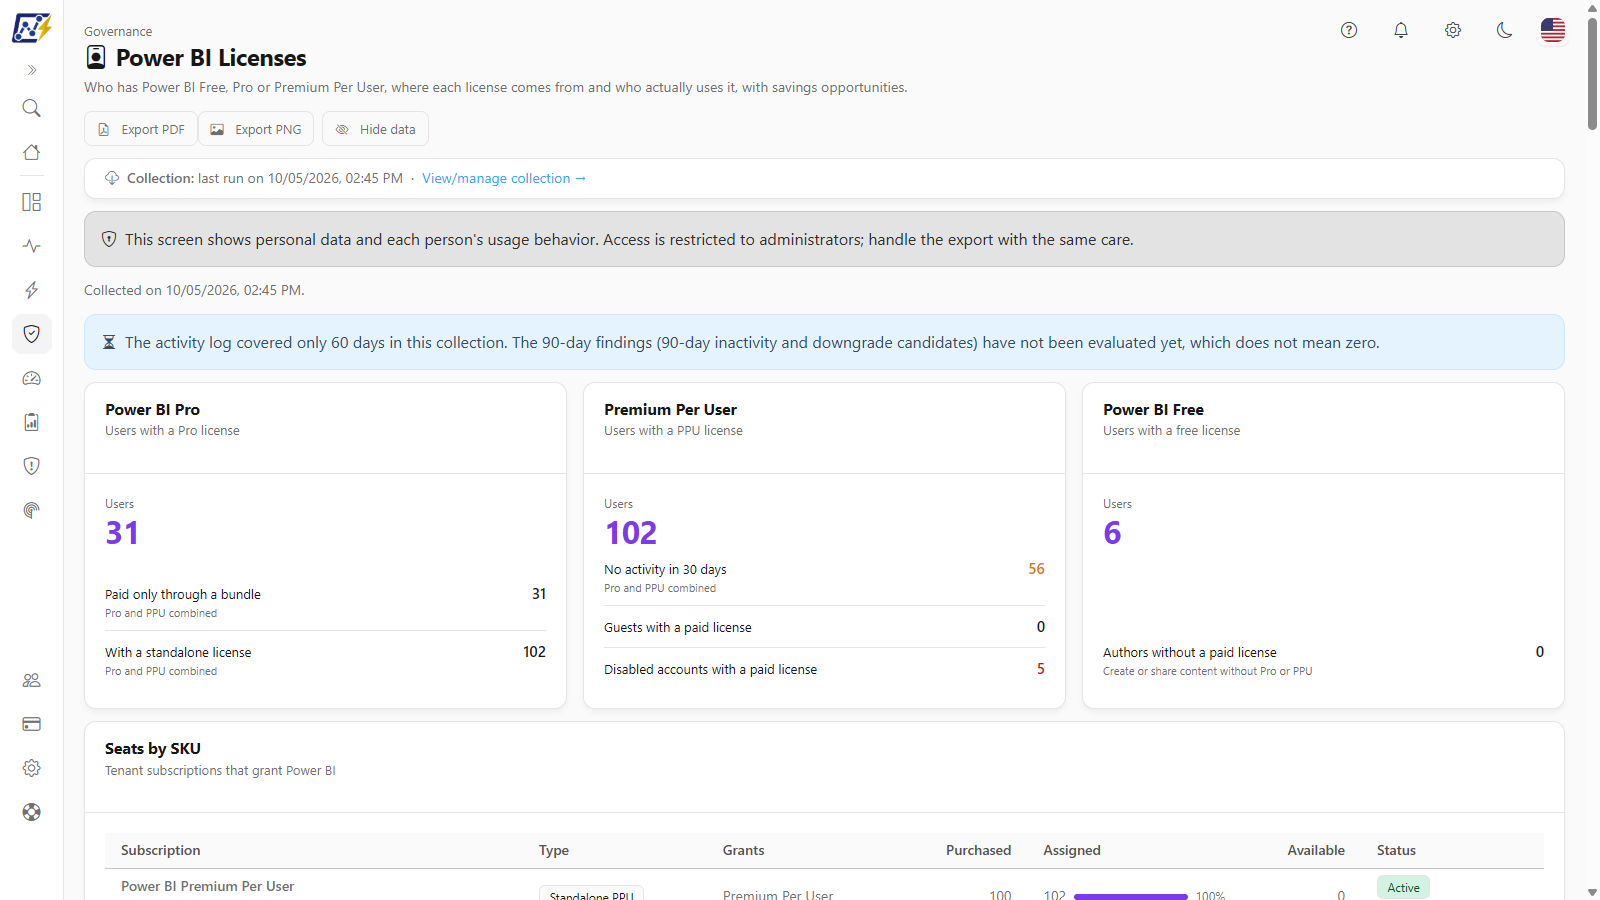
Find out in minutes who has Pro or Premium Per User and hasn't opened Power BI in months, disabled accounts still holding a paid license, who has Pro only to read content in a capacity and purchased seats nobody uses. Enter your contract prices and see the **monthly and annual savings**, including the estimate for moving viewers to **Power Embedded**.

<figure><picture><source srcset="/files/LwEVhqeJNWGIkQPeJJy0" media="(prefers-color-scheme: dark)"><img src="https://3938213054-files.gitbook.io/~/files/v0/b/gitbook-x-prod.appspot.com/o/spaces%2FH2bFRBmIfyK3kwVKbldl%2Fuploads%2Fgit-blob-b9c5cec92f49ed29d245be9bcd0093bbfbaa778f%2Fpm-governanca-licencas-power-bi-en.png?alt=media" alt="Power BI Licenses screen with indicators, findings and savings opportunities"></picture><figcaption><p>Power BI Licenses: findings and savings opportunities</p></figcaption></figure>

[Learn about license governance →](/en/principais-funcionalidades/licencas-power-bi.md)

## Custom alerts, built around how you operate

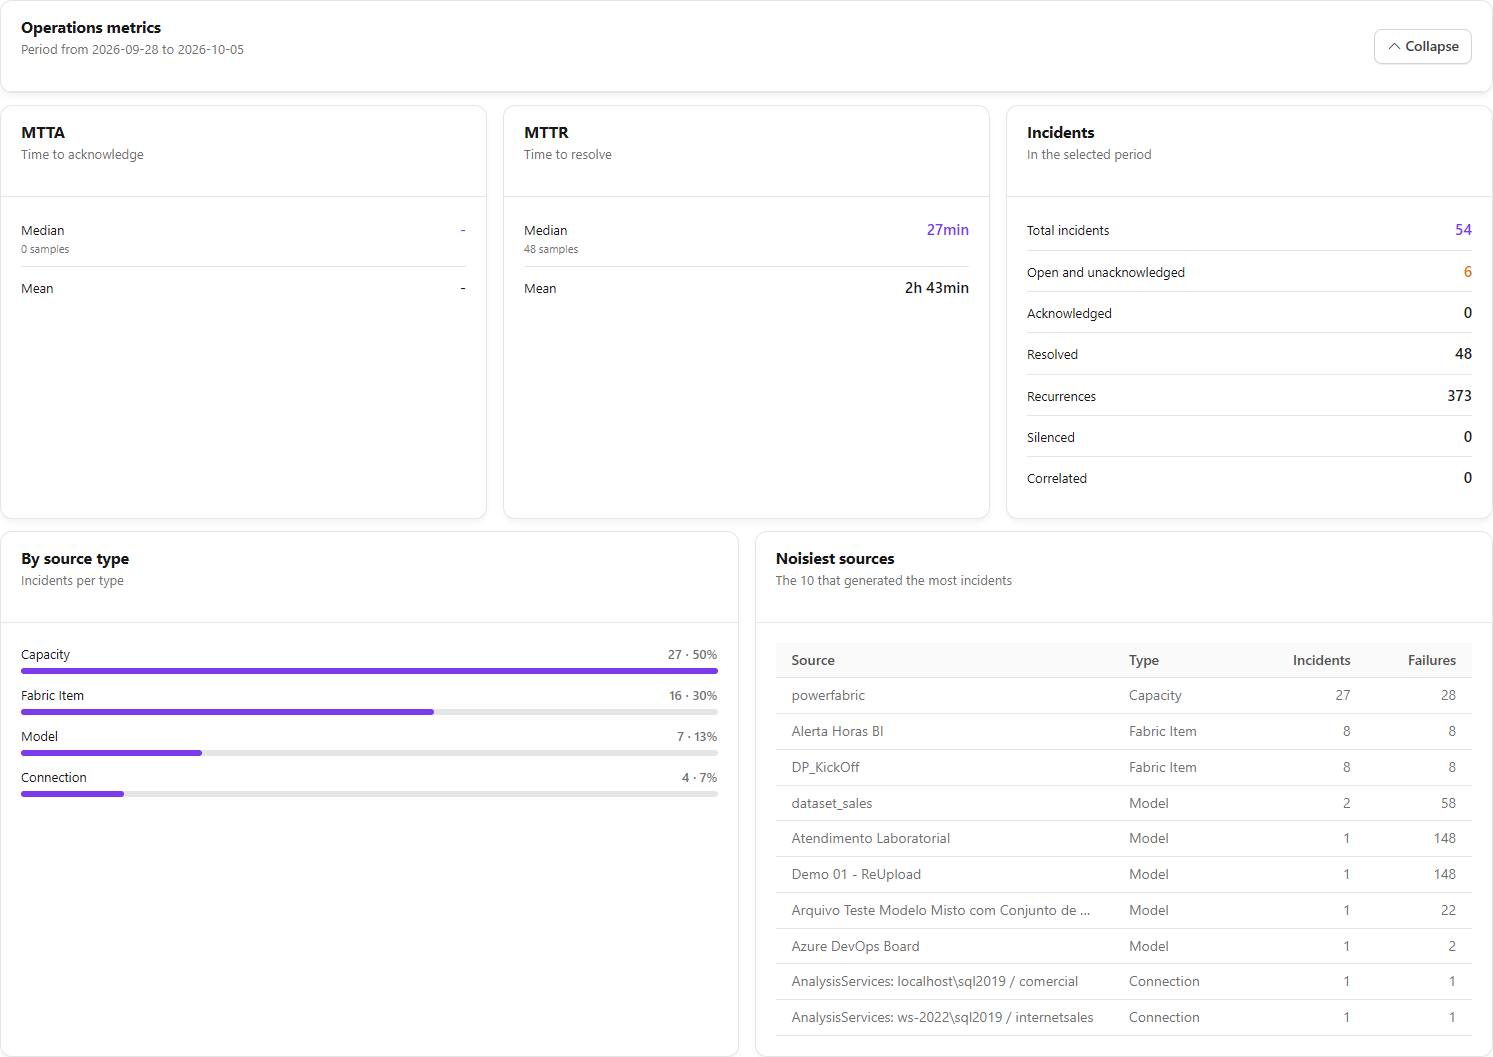
Gateway offline, failed refresh, capacity at its limit, unusual cost, late data, anomalous consumption: every alert goes **to the people who need to know**, by **email, Microsoft Teams, Slack, Telegram or webhook** (including ServiceNow, PagerDuty, Opsgenie and Azure DevOps). You set the thresholds, filter by workspace or item criticality, notify the artifact's creator and track everything in an incident center with acknowledgment, assignment, muting, escalation and **MTTA** and **MTTR** metrics.

<figure><picture><source srcset="/files/QoDtU0yZFikTfuefi3Vz" media="(prefers-color-scheme: dark)"><img src="https://3938213054-files.gitbook.io/~/files/v0/b/gitbook-x-prod.appspot.com/o/spaces%2FH2bFRBmIfyK3kwVKbldl%2Fuploads%2Fgit-blob-1b5aa21e0263ee395250e974a326bfa244b79190%2Fpm-monitoramento-alertas-metricas-operacao-en.png?alt=media" alt="Operational metrics of the Alerts center with MTTA, MTTR and recurrence"></picture><figcaption><p>Incident center with operational metrics</p></figcaption></figure>

[Learn about custom alerts →](/en/principais-funcionalidades/alertas-em-tempo-real.md)

## Cost and Dashboards: real FinOps for Fabric and Power BI

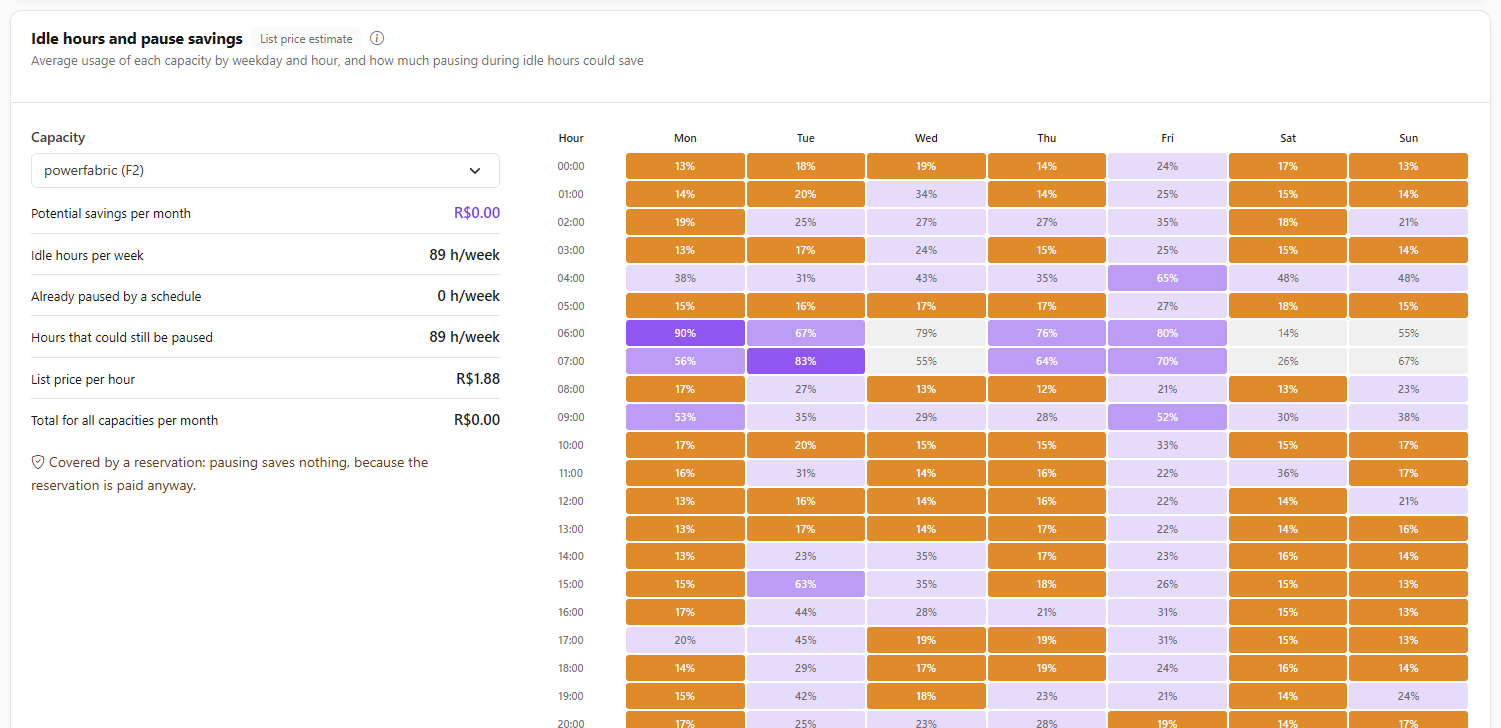
The **Capacity Cost** dashboard shows the **real cost** of each capacity in Azure, day by day, and estimates how much each workspace, business area, item and user costs, allocated by consumption. Track reservations, the month's budget and unattributed cost, and get alerted when a day breaks the pattern. Most importantly, it shows **where to save**, such as the idle hours when the capacity could have been paused.

<figure><picture><source srcset="/files/jEkHe4I2RHQh3myHXIH3" media="(prefers-color-scheme: dark)"><img src="https://3938213054-files.gitbook.io/~/files/v0/b/gitbook-x-prod.appspot.com/o/spaces%2FH2bFRBmIfyK3kwVKbldl%2Fuploads%2Fgit-blob-e133641787932f4f6cfa146e9b5c6a0163af948d%2Fpm-dashboards-custo-capacidade-onde-economizar-en.png?alt=media" alt="Idle hours and savings from pausing by day of the week and hour"></picture><figcaption><p>Where to save: idle hours of each capacity</p></figcaption></figure>

[Learn about Cost and Dashboards →](/en/principais-funcionalidades/custo-e-dashboards.md)

## Data Quality: what's inside your models

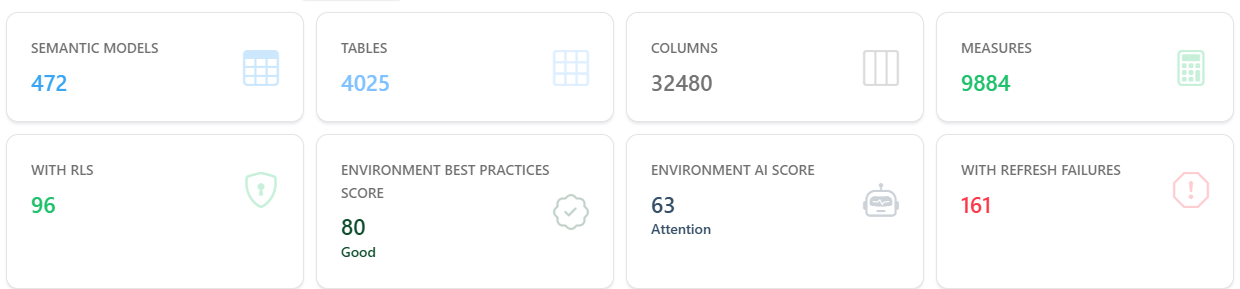
The **Environment X-Ray** gives your organization a health score from 0 to 100 and lists what to fix first. Lineage shows the impact of changing a table at the source, the scores assess models and reports against dozens of best practices and Copilot readiness, and Data Exposure finds **passwords and tokens written in Power Query**.

<figure><picture><source srcset="/files/udJGOckBnOHr45ZwUHg5" media="(prefers-color-scheme: dark)"><img src="https://3938213054-files.gitbook.io/~/files/v0/b/gitbook-x-prod.appspot.com/o/spaces%2FH2bFRBmIfyK3kwVKbldl%2Fuploads%2Fgit-blob-54399fb88ee1c2ce629888dccb1156943d24efa5%2Fpm-qualidade-raio-x-ambiente-kpis-en.png?alt=media" alt="Overall score and findings by severity in the Environment X-Ray"></picture><figcaption><p>Environment X-Ray: overall score and findings by severity</p></figcaption></figure>

[Learn about Data Quality →](/en/principais-funcionalidades/qualidade-de-dados.md)

## Audit and Security: the answers auditors ask for

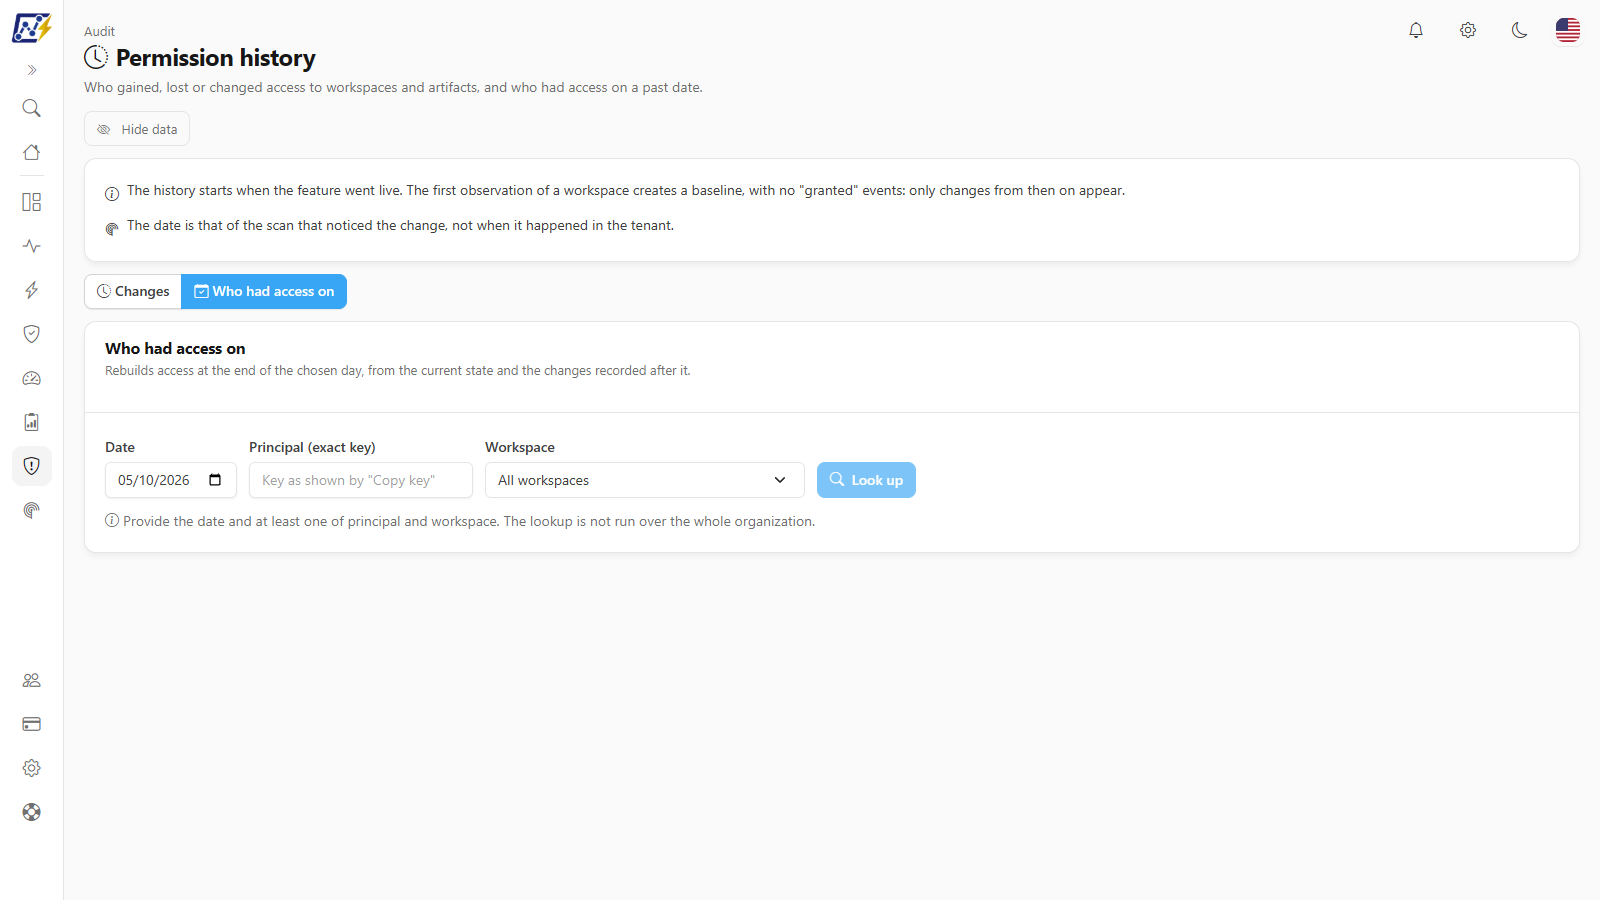
Who has access to what, through which path (direct, group or workspace), and **who had access on a past date**. Who viewed each report and from where. Service principals with write permission, RLS roles with no members, direct sharing, subscriptions sent outside the company and a **behavioral risk score** that flags changes in usage patterns. All with a historical trail for LGPD, ISO 27001 and SOC 2.

<figure><picture><source srcset="/files/ok3U27ayCAzTeRH88Dxm" media="(prefers-color-scheme: dark)"><img src="https://3938213054-files.gitbook.io/~/files/v0/b/gitbook-x-prod.appspot.com/o/spaces%2FH2bFRBmIfyK3kwVKbldl%2Fuploads%2Fgit-blob-5d189e5957a8e755f4cde608e9a0f86b88cab7c8%2Fpm-auditoria-historico-permissoes-quem-tinha-acesso-en.png?alt=media" alt="Permission history answering who had access on a past date"></picture><figcaption><p>Permission history: who had access on a given date</p></figcaption></figure>

[Learn about Audit and Security →](/en/principais-funcionalidades/auditoria-e-seguranca.md)

## All features

<table data-view="cards"><thead><tr><th></th><th></th><th data-hidden data-card-target data-type="content-ref"></th></tr></thead><tbody><tr><td><strong>Retry and failure investigation</strong></td><td>Bulk retry, explained errors and an AI-powered dossier</td><td><a href="/en/principais-funcionalidades/reprocessamento-de-falhas.md">Retry and failure investigation</a></td></tr><tr><td><strong>Truly up-to-date data</strong></td><td>Data Freshness: deadline and row count for each table</td><td><a href="/en/principais-funcionalidades/dados-atualizados.md">Truly up-to-date data</a></td></tr><tr><td><strong>Performance Analysis</strong></td><td>Semantic models, lakehouses and warehouses</td><td><a href="/en/principais-funcionalidades/analise-de-performance.md">Performance Analysis</a></td></tr><tr><td><strong>Power BI Licenses</strong></td><td>Idle licenses, the right tier and savings</td><td><a href="/en/principais-funcionalidades/licencas-power-bi.md">Power BI Licenses</a></td></tr><tr><td><strong>Custom alerts</strong></td><td>Channels, thresholds, filters and incident center</td><td><a href="/en/principais-funcionalidades/alertas-em-tempo-real.md">Custom alerts</a></td></tr><tr><td><strong>Cost and Dashboards</strong></td><td>Real cost, allocation, budget and where to save</td><td><a href="/en/principais-funcionalidades/custo-e-dashboards.md">Cost and Dashboards</a></td></tr><tr><td><strong>Data Quality</strong></td><td>X-Ray, lineage, best practices and data exposure</td><td><a href="/en/principais-funcionalidades/qualidade-de-dados.md">Data Quality</a></td></tr><tr><td><strong>Audit and Security</strong></td><td>Permissions, history, views and risk</td><td><a href="/en/principais-funcionalidades/auditoria-e-seguranca.md">Audit and Security</a></td></tr><tr><td><strong>Capacity Monitoring</strong></td><td>Consumption in Capacity Units, history, comparisons and anomalies</td><td><a href="/en/principais-funcionalidades/monitoramento-de-capacidades.md">Capacity Monitoring</a></td></tr><tr><td><strong>Capacity Governance</strong></td><td>Scheduled pause, resume and SKU changes, plus autoscale</td><td><a href="/en/principais-funcionalidades/governanca-de-capacidade.md">Capacity Governance</a></td></tr><tr><td><strong>Gateway Monitoring</strong></td><td>Status every 5 minutes and offline gateway alert</td><td><a href="/en/principais-funcionalidades/monitoramento-de-gateways.md">Gateway Monitoring</a></td></tr><tr><td><strong>Data Refresh Failures</strong></td><td>Semantic models and Fabric items</td><td><a href="/en/principais-funcionalidades/falhas-de-atualizacao.md">Data Refresh Failures</a></td></tr><tr><td><strong>Notebook Monitoring</strong></td><td>Fabric notebooks, pipelines and Copy jobs</td><td><a href="/en/principais-funcionalidades/monitoramento-de-notebooks.md">Notebook Monitoring</a></td></tr><tr><td><strong>Dataflow Monitoring</strong></td><td>Dataflows Gen1 and Gen2</td><td><a href="/en/principais-funcionalidades/monitoramento-de-dataflows.md">Dataflow Monitoring</a></td></tr><tr><td><strong>Semantic Models</strong></td><td>Refreshes, schedules, quality and performance</td><td><a href="/en/principais-funcionalidades/modelos-semanticos.md">Semantic Models</a></td></tr><tr><td><strong>Inventory and Governance</strong></td><td>Complete tenant inventory and bulk actions</td><td><a href="/en/principais-funcionalidades/inventario-e-governanca.md">Inventory and Governance</a></td></tr><tr><td><strong>Permissions and Access</strong></td><td>Who has access to what and who accessed what</td><td><a href="/en/principais-funcionalidades/permissoes-e-acessos.md">Permissions and Access</a></td></tr></tbody></table>

## Explore the portal

Each feature has detailed, step-by-step screens in the **Power Monitor** section of this documentation. Start with the [Portal overview](/en/power-monitor/visao-geral.md).


---

# Agent Instructions
This documentation is published with GitBook. GitBook is the documentation platform designed so that both humans and AI agents can read, navigate, and reason over technical content effectively. Learn more at gitbook.com.

## Querying This Documentation
If you need additional information that is not directly available in this page, you can query the documentation by asking a question.

Perform an HTTP GET request on the following URL with the `ask` and `goal` query parameters:

```
GET https://docs.powermonitor.com.br/en/principais-funcionalidades.md?ask=<question>&goal=<user_goal>
```

`ask` is the immediate question: it should be specific, self-contained, and written in natural language.
`goal` is what the user is ultimately trying to achieve, the reason they need the answer. Sharing it helps GitBook give you a better, more relevant answer. A goal is most helpful when it describes the outcome the user wants rather than restating the question. For example, with `ask=how do I create an API token`, a goal like `automate deployments from our CI pipeline` lets GitBook tailor the answer to that use case.

The response will contain a direct answer to the question and relevant excerpts and sources from the documentation.

Use this mechanism when the answer is not explicitly present in the current page, you need clarification or additional context, or you want to retrieve related documentation sections.