> For the complete documentation index, see [llms.txt](https://docs.powermonitor.com.br/llms.txt). Markdown versions of documentation pages are available by appending `.md` to page URLs; this page is available as [Markdown](https://docs.powermonitor.com.br/en/power-monitor/visao-geral.md).

# Overview

Overview of the Power Monitor portal: how the menu is organized, what each area offers and who can access each one.

The Power Monitor portal ([app.powermonitor.com.br](https://app.powermonitor.com.br/)) is where you monitor and govern your entire Microsoft Fabric and Power BI environment. This page presents the structure of the portal (menu, top controls, user and assistant), the available areas, and points to the documentation for each one.

**How to access:** sign in at [app.powermonitor.com.br](https://app.powermonitor.com.br/) with your organization's Microsoft account. After signing in, the first screen is [Home](/en/power-monitor/pagina-inicial.md).

<figure><picture><source srcset="/files/EnqR08tiKzIViSgBlame" media="(prefers-color-scheme: dark)"><img src="https://3938213054-files.gitbook.io/~/files/v0/b/gitbook-x-prod.appspot.com/o/spaces%2FH2bFRBmIfyK3kwVKbldl%2Fuploads%2Fgit-blob-52db07023d3c407cadb23197dc17bbe86c2bf5d8%2Fpm-visao-geral-portal-menu-en.png?alt=media" alt="Power Monitor portal with the side menu open"></picture><figcaption><p>Power Monitor portal</p></figcaption></figure>

## What it is for

* **Guiding your first contact with the product:** understanding how the menu is organized and where each subject is located, and how to reach your screens faster with search and Favorites.
* **Knowing what your profile allows:** which areas are open to everyone and which are restricted to Administrators.
* **Understanding where the data comes from** on the screens and how often it is updated.

## Features

### Main menu (icon bar)

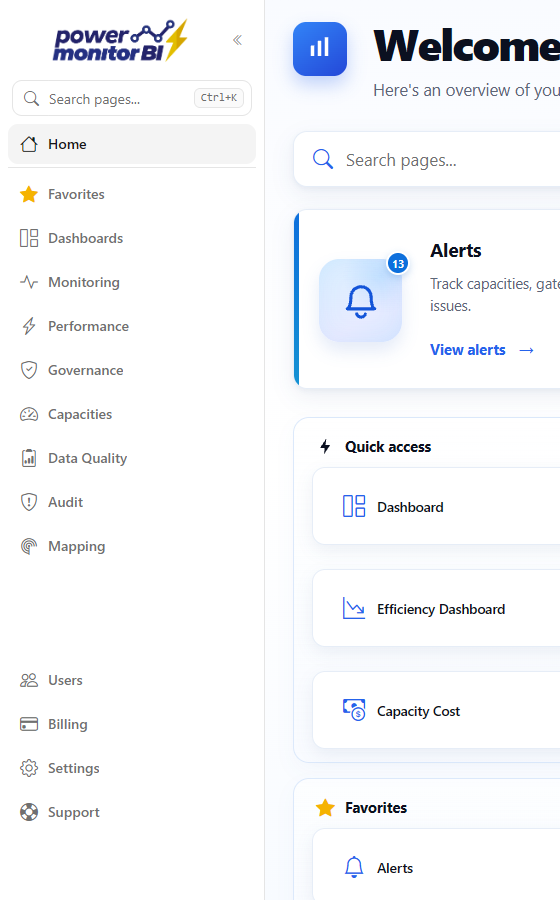
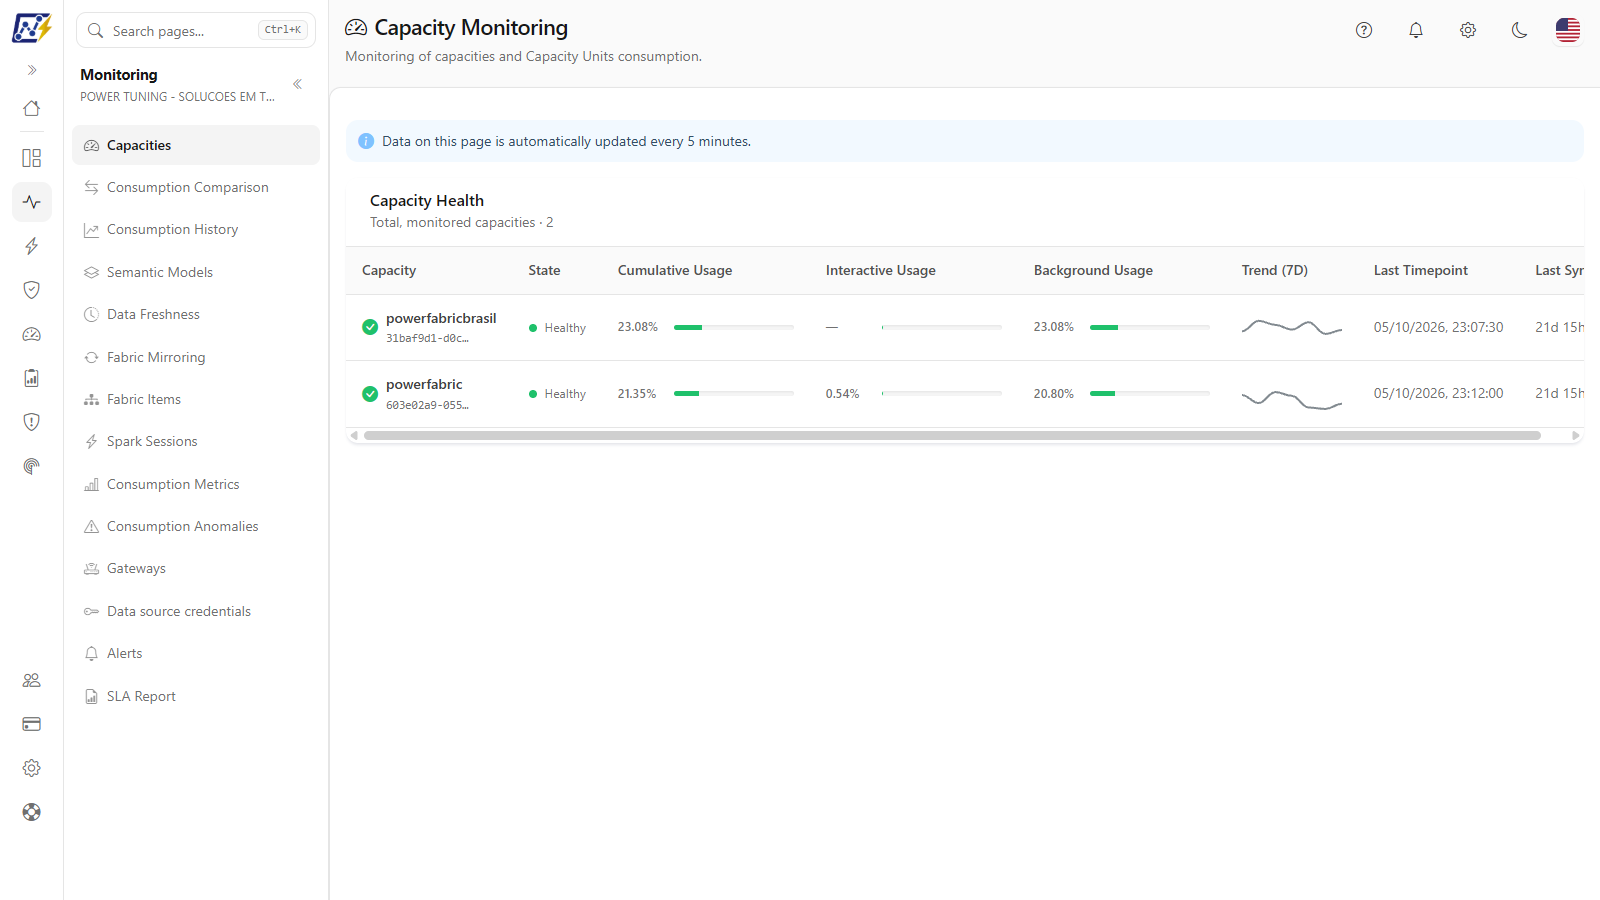
**What it is:** the leftmost column of the portal. From top to bottom, it contains the logo, the expand/collapse button, the page search field, **Home**, **Favorites** (only when you have favorites), the **Dashboards**, **Monitoring**, **Performance**, **Governance**, **Capacities**, **Data Quality**, **Audit** and **Mapping** areas and, at the bottom, **Users**, **Billing**, **Settings**, **Support** and your user.

**What it is for:** choosing the area for the subject you are going to work on and returning to Home at any time.

<figure><picture><source srcset="/files/WbFq1JWNuiQMAMIoHNEm" media="(prefers-color-scheme: dark)"><img src="https://3938213054-files.gitbook.io/~/files/v0/b/gitbook-x-prod.appspot.com/o/spaces%2FH2bFRBmIfyK3kwVKbldl%2Fuploads%2Fgit-blob-226e642ce6b53243489d8e76d1c79dc41e0104d5%2Fpm-interface-menu-principal-expandido-en.png?alt=media" alt="Expanded main menu with the search field, Home, Favorites, the area names and the utilities at the bottom"></picture><figcaption><p>Expanded main menu, with area names</p></figcaption></figure>

**How to use:**

1. Click an area (for example, **Governance**). The main menu switches to icons only and the [area panel](#area-panel) opens beside it.
2. With the menu showing icons only, hover over an icon to see the area name.
3. To see the names of all areas, click the double-arrow button next to the logo (**Expand main menu**). Click it again (**Collapse main menu**) to return to icons.
4. To return to the home page, click **Home** (house icon) or the logo.

**How it works:**

* On Home, the main menu appears **expanded**, with the area names. When you choose an area or open a screen in an area (for example, through the Home shortcuts), it collapses to icons.
* Areas and items restricted to Administrators do not appear for other profiles. An area whose screens have all been blocked for your user also disappears from the menu.
* The **Favorites** area brings together the screens you marked with the star. See [Favorites and page search](/en/power-monitor/favoritos-e-busca.md).
* The **Users**, **Billing** and **Settings** utilities are restricted to Administrators. **Support** is visible to everyone.

### Area panel

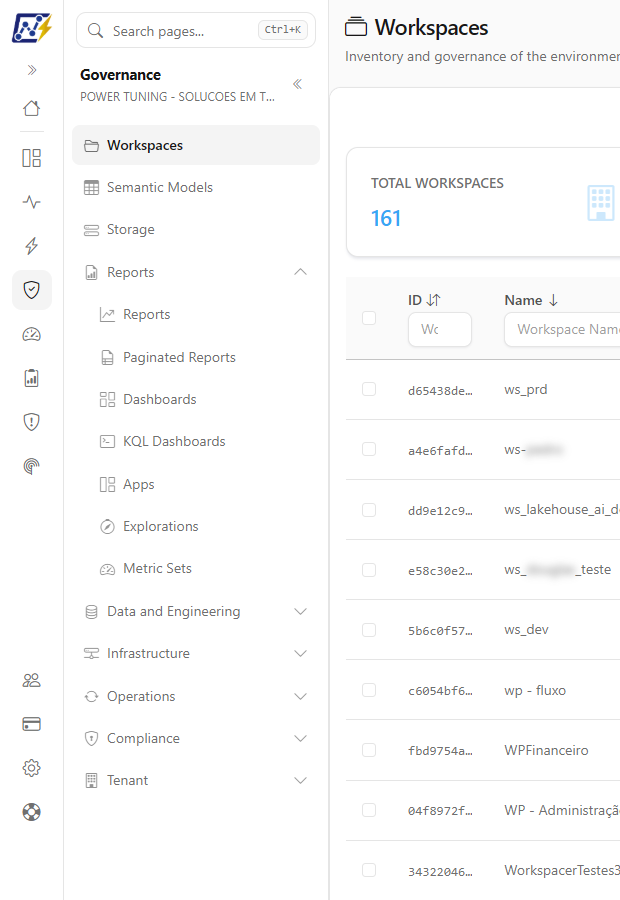
**What it is:** the list of screens in the chosen area, opened beside the main menu. At the top of the panel are the page search field, the area name and your organization's name. The currently open screen is highlighted, and each screen has a star to mark it as a favorite.

**What it is for:** navigating between screens on the same subject without going back to Home.

<figure><picture><source srcset="/files/9kcAHJS2PICaNuIn2ISf" media="(prefers-color-scheme: dark)"><img src="https://3938213054-files.gitbook.io/~/files/v0/b/gitbook-x-prod.appspot.com/o/spaces%2FH2bFRBmIfyK3kwVKbldl%2Fuploads%2Fgit-blob-980f76b649f78e7e9295663c1d51126da45d6656%2Fpm-visao-geral-painel-da-area-governanca-en.png?alt=media" alt="Governance area panel with the Reports group expanded showing its subitems"></picture><figcaption><p>Governance area panel with the Reports group expanded</p></figcaption></figure>
**How to use:**

{% stepper %}
{% step %}

### Choose the area

In the main menu, click the area for the subject (for example, **Governance**). The area panel opens beside it with the list of screens.
{% endstep %}

{% step %}

### Open the screen

Click the screen name (for example, **Workspaces**). The screen opens and the item is highlighted in the panel.
{% endstep %}

{% step %}

### Expand a group, when there is one

Some items are groups with subitems, identified by a down arrow. In Governance, after Workspaces, Semantic Models and Storage come the **Reports** (Paginated Reports, Dashboards, Apps and other types), **Data and Engineering**, **Infrastructure**, **Operations**, **Compliance** and **Tenant** groups. In Mapping, after Scan Logs come the **Inventory**, **Models and reports**, **Capacity and cost**, **Audit and compliance** and **Operations** groups. Click the group to expand or collapse the subitems. This click does not change the screen. The group of the screen currently open is already expanded.
{% endstep %}

{% step %}

### Collapse the panel to gain space

Click the double-arrow button to the right of the area name (**Collapse menu**). The panel disappears, leaving only the main menu with icons. To reopen it, click the icon of any area in the main menu.
{% endstep %}
{% endstepper %}

**How it works:**

* The collapsed panel is remembered **in this browser**: on your next visit, it stays collapsed until you reopen it.
* The **Capacities** area brings together capacity screens that also exist in other areas (Dashboards, Monitoring, Governance, Audit and Mapping). They are the same screens, accessible through both paths.
* The **Performance** area brings together the performance screens: Average Execution Time, Performance Assessment, Model Cleanup and Lakehouse and Warehouse.
* Details of the menu states (launch, work and focus) are in [Interface and navigation](/en/power-monitor/interface-e-navegacao.md#collapse-and-expand-the-menu).

### Top controls

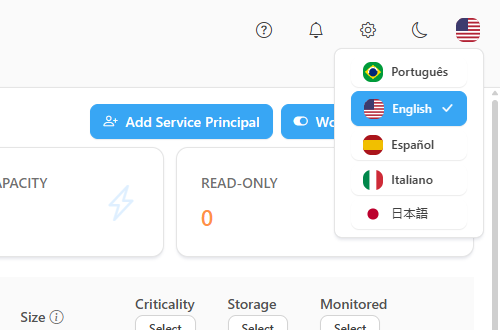
**What it is:** the group of icons in the upper-right corner of every screen, in this order: **Install on phone** (only on compatible phones and tablets), **Help**, **What's new**, the **Settings** gear (Administrators only), the light/dark theme toggle and the language selector.

**What it is for:** opening the documentation of the current screen, following the news, adjusting the appearance and language of the interface and, for administrators, reaching the organization's settings from any screen.

<figure><picture><source srcset="/files/PauV7vYcqT6H4kRtbjqw" media="(prefers-color-scheme: dark)"><img src="https://3938213054-files.gitbook.io/~/files/v0/b/gitbook-x-prod.appspot.com/o/spaces%2FH2bFRBmIfyK3kwVKbldl%2Fuploads%2Fgit-blob-e77d3c5aa31d271fa9ca3b2bb6c1107d9fbdb759%2Fpm-interface-barra-topo-en.png?alt=media" alt="Top controls with Help, What&#x27;s new, the settings gear, the theme button and the language selector open"></picture><figcaption><p>Top controls with the language selector open</p></figcaption></figure>

**How to use:**

1. To open the documentation of the screen you are using, click the question mark (**Help**). To see the news of each version, click the bell (**What's new**).
2. To switch between the light and dark themes, click the moon/sun icon.
3. To change the language, click the flag and choose **Português**, **English**, **Español**, **Italiano** or **日本語**. The change applies immediately to all screens.
4. Administrators can click the gear to open [Settings](/en/power-monitor/configuracoes.md).

More details in [Interface and navigation](/en/power-monitor/interface-e-navegacao.md#top-of-page-actions).

### User menu

**What it is:** your user (avatar, name and email) at the bottom of the main menu. With the menu showing icons only, just the avatar appears, and the name shows up when you hover over it.

**What it is for:** confirming which account you are signed in with and ending the session.

<figure><picture><source srcset="/files/WdGH2u7AlB4VVlrAiM2H" media="(prefers-color-scheme: dark)"><img src="https://3938213054-files.gitbook.io/~/files/v0/b/gitbook-x-prod.appspot.com/o/spaces%2FH2bFRBmIfyK3kwVKbldl%2Fuploads%2Fgit-blob-7ee752d2d473b97eb1c713bbe33607fba8197287%2Fpm-visao-geral-menu-do-usuario-en.png?alt=media" alt="User menu open at the bottom of the main menu with the Exit option"></picture><figcaption><p>User menu with the Exit option</p></figcaption></figure>

**How to use:**

1. Click your avatar (or your name) at the bottom of the main menu.
2. Click **Exit** to end your Power Monitor session.

### AI Assistant

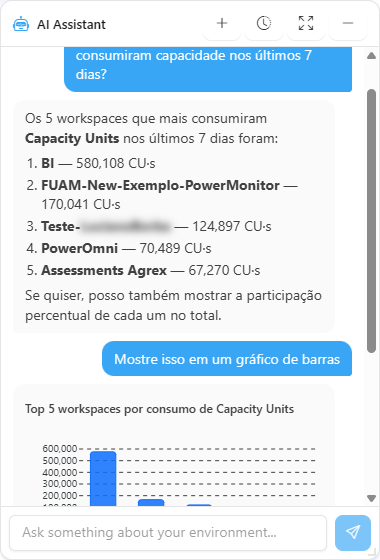
**What it is:** a floating chat, available on every screen through the round button in the lower-right corner, that answers natural language questions about your environment using the data collected by Power Monitor.

**What it is for:** getting quick answers (for example, "is any gateway offline right now?") without needing to know which screen holds the information.

<figure><picture><source srcset="/files/6is01tvPGUlteczOA670" media="(prefers-color-scheme: dark)"><img src="https://3938213054-files.gitbook.io/~/files/v0/b/gitbook-x-prod.appspot.com/o/spaces%2FH2bFRBmIfyK3kwVKbldl%2Fuploads%2Fgit-blob-29d4dce8abfc84a00d26426bbd1f92bda54f666d%2Fpm-assistente-ia-conversa-en.png?alt=media" alt="AI Assistant window with a question and an answer with a chart"></picture><figcaption><p>AI Assistant</p></figcaption></figure>

**How to use:** click the round button in the lower-right corner, type the question and send it. The assistant only works when the organization has an AI provider configured and spending limit available. See [AI Assistant](/en/power-monitor/assistente-de-ia.md).

### Portal areas

**What it is:** the set of menu areas, each dedicated to a subject.

**What it is for:** knowing which area to look in for each piece of information. Click a card to open the area's documentation.

<table data-view="cards"><thead><tr><th></th><th></th><th data-hidden data-card-target data-type="content-ref"></th></tr></thead><tbody><tr><td><strong>Home</strong></td><td>Home page with page search, the alert counter, your favorites and shortcuts to all screens</td><td><a href="/en/power-monitor/pagina-inicial.md">Home</a></td></tr><tr><td><strong>Dashboards</strong></td><td>Main Dashboard, Governance, Capacity, Capacity Overview, Efficiency, Monitoring (TV), Report Access, Permissions, Capacity Cost and Artifact Refreshes</td><td><a href="/en/power-monitor/dashboards.md">Dashboards</a></td></tr><tr><td><strong>Monitoring</strong></td><td>Capacity consumption, semantic models, Fabric items, Spark sessions, data freshness, Mirroring, gateways, data source credentials, alerts and SLA report</td><td><a href="/en/power-monitor/monitoramento.md">Monitoring</a></td></tr><tr><td><strong>Performance</strong></td><td>Average execution time, performance assessment, model cleanup and Lakehouse and Warehouse analysis</td><td><a href="/en/power-monitor/performance.md">Performance</a></td></tr><tr><td><strong>Governance</strong></td><td>Inventory of workspaces, reports, semantic models, storage, data engineering and data science, capacities, gateways, connections, schedules, deployment pipelines, deployment and model history, compliance and privacy, access reviews, labels and domains</td><td><a href="/en/power-monitor/governanca.md">Governance</a></td></tr><tr><td><strong>Capacities</strong></td><td>Everything about capacities in one place: consumption, cost, anomalies, governance (pause, resume, change size (SKU)) and executed actions</td><td><a href="/en/power-monitor/capacidades.md">Capacities</a></td></tr><tr><td><strong>Data Quality</strong></td><td>Lineage, Environment X-Ray, data dictionary, best practices scores (models and reports) and AI score, environment inventory and data exposure</td><td><a href="/en/power-monitor/qualidade-de-dados.md">Data Quality</a></td></tr><tr><td><strong>Audit</strong></td><td>Tenant events, report views, permissions and their history, behavioral risk, Service Principals, row-level security, direct sharing, e-mail subscriptions, application events, emails sent and capacity actions</td><td><a href="/en/power-monitor/auditoria.md">Audit</a></td></tr><tr><td><strong>Mapping</strong></td><td>Collections (scans) of inventory, models and reports, capacity and cost, audit and compliance, and operations, with the run history (administrators)</td><td><a href="/en/power-monitor/mapeamento.md">Mapping</a></td></tr><tr><td><strong>Users</strong></td><td>Users, profiles, workspace scope and page blocking (administrators)</td><td><a href="/en/power-monitor/usuarios.md">Users</a></td></tr><tr><td><strong>Billing</strong></td><td>Tiers, monthly average, invoices, installments and billing audit (administrators)</td><td><a href="/en/power-monitor/faturamento.md">Billing</a></td></tr><tr><td><strong>Settings</strong></td><td>Organization, monitoring, notifications, alert channels, AI and additional permissions (administrators)</td><td><a href="/en/power-monitor/configuracoes.md">Settings</a></td></tr><tr><td><strong>Support</strong></td><td>How to contact the Power Monitor team</td><td><a href="/en/power-monitor/suporte.md">Support</a></td></tr><tr><td><strong>Interface and navigation</strong></td><td>Menu, theme, language, top notices, exports and mobile use</td><td><a href="/en/power-monitor/interface-e-navegacao.md">Interface and navigation</a></td></tr><tr><td><strong>Favorites and page search</strong></td><td>Star on the menu screens, Favorites menu and page search (Ctrl+K)</td><td><a href="/en/power-monitor/favoritos-e-busca.md">Favorites and page search</a></td></tr><tr><td><strong>AI Assistant</strong></td><td>Natural language questions about your environment</td><td><a href="/en/power-monitor/assistente-de-ia.md">AI Assistant</a></td></tr></tbody></table>

## Rules and behavior

### Who can access what

Power Monitor follows the **"open screen, restricted action"** rule:

* Most screens can be **viewed by all users** in the organization.
* **Write actions** (turning on monitoring, triggering scans, editing metadata, granting permissions, scheduling capacity actions, etc.) are **restricted to Administrators**. For other profiles, the action button does not appear or is disabled.
* The **Mapping**, **Users**, **Billing** and **Settings** areas, and some screens with personal or individual usage data (such as Departed Owners, Power BI Licenses, Behavioral risk, SLA Report and Environment X-Ray), are **restricted to Administrators**. Screens such as the Report Access Dashboard and the Permissions Dashboard have no exclusivity mark: who sees them depends on the page access of each user's profile. Once the organization customizes page access (creates or edits profiles, or user locks), the menu and Home follow only the page locks, but write actions and screens with personal data remain restricted to Administrators on the server.
* An administrator can **restrict a user to certain workspaces** (the user sees only data from those workspaces) and **block specific pages** per user. Blocked pages disappear from the menu and from Home, and direct access through the address leads to the access denied screen. See [Users](/en/power-monitor/usuarios.md).

If an action you need is not available, ask an administrator in your organization to perform it or to review your profile in [Users](/en/power-monitor/usuarios.md).

### Where the data comes from

* **Inventory and metadata:** scans through the Power BI and Fabric admin APIs, run during installation and then **daily** (the frequency of several scans can be adjusted in **Settings › Monitoring**), in addition to on-demand scans in **Mapping**.
* **Capacity consumption:** the **Microsoft Fabric Capacity Metrics** app in your tenant, read every few minutes.
* **Refreshes, runs and gateways:** continuous checks, in cycles of minutes.
* **User activity:** Power BI/Fabric activity events, collected three times a day when collection is enabled in **Settings › Audit**.

Only **monitored workspaces** appear on the screens, generate alerts and are included in billing. See [Workspaces](/en/power-monitor/governanca/workspaces.md).

### Notices at the top of the screens

In specific situations, a notice bar appears above the content of every screen, for example when the trial period is ending, when there is an overdue payment or when the tenant access credential is about to expire. See [Interface and navigation](/en/power-monitor/interface-e-navegacao.md#notices-at-the-top-of-the-pages).

### First steps after installation

{% stepper %}
{% step %}

### Check the inventory

Open *Governance › Workspaces* and check that the tenant's workspaces were found by the initial scan.
{% endstep %}

{% step %}

### Choose what to monitor

As an Administrator, turn on monitoring for the workspaces that should appear on the screens and generate alerts. See [Workspaces](/en/power-monitor/governanca/workspaces.md).
{% endstep %}

{% step %}

### Track it through the dashboards

Use the [Dashboard](/en/power-monitor/dashboards/dashboard-principal.md) and the [Monitoring Dashboard](/en/power-monitor/dashboards/dashboard-de-monitoramento.md) to track the environment day to day.
{% endstep %}
{% endstepper %}

## Frequently asked questions

<details>

<summary>I do not see the Mapping area or the Users, Billing and Settings icons. Why?</summary>

These areas are restricted to the **Administrator** profile. For other profiles, they do not appear in the menu or on Home.

</details>

<details>

<summary>The area panel disappeared. How do I get it back?</summary>

You probably clicked **Collapse menu**. Click the icon of any area in the main menu and the panel appears again. Because the collapsed state is saved in the browser, it stays that way until you reopen it.

</details>

<details>

<summary>Why does the same screen appear in two areas of the menu?</summary>

The **Capacities** area was created to bring together in one place the capacity screens that are also in Dashboards, Monitoring, Governance, Audit and Mapping. It is the same screen, with the same data, accessible through both paths.

</details>

## Related pages

* [Home](/en/power-monitor/pagina-inicial.md)
* [Interface and navigation](/en/power-monitor/interface-e-navegacao.md)
* [Favorites and page search](/en/power-monitor/favoritos-e-busca.md)
* [Users](/en/power-monitor/usuarios.md)
* [First access](/en/readme/primeiro-acesso.md)
* [Key Features](/en/principais-funcionalidades.md)
* [Frequently asked questions](/en/perguntas-frequentes.md)


---

# Agent Instructions
This documentation is published with GitBook. GitBook is the documentation platform designed so that both humans and AI agents can read, navigate, and reason over technical content effectively. Learn more at gitbook.com.

## Querying This Documentation
If you need additional information that is not directly available in this page, you can query the documentation by asking a question.

Perform an HTTP GET request on the following URL with the `ask` and `goal` query parameters:

```
GET https://docs.powermonitor.com.br/en/power-monitor/visao-geral.md?ask=<question>&goal=<user_goal>
```

`ask` is the immediate question: it should be specific, self-contained, and written in natural language.
`goal` is what the user is ultimately trying to achieve, the reason they need the answer. Sharing it helps GitBook give you a better, more relevant answer. A goal is most helpful when it describes the outcome the user wants rather than restating the question. For example, with `ask=how do I create an API token`, a goal like `automate deployments from our CI pipeline` lets GitBook tailor the answer to that use case.

The response will contain a direct answer to the question and relevant excerpts and sources from the documentation.

Use this mechanism when the answer is not explicitly present in the current page, you need clarification or additional context, or you want to retrieve related documentation sections.